GBPUSD Hovers at $1.33: A Battle for Control at Key Levels
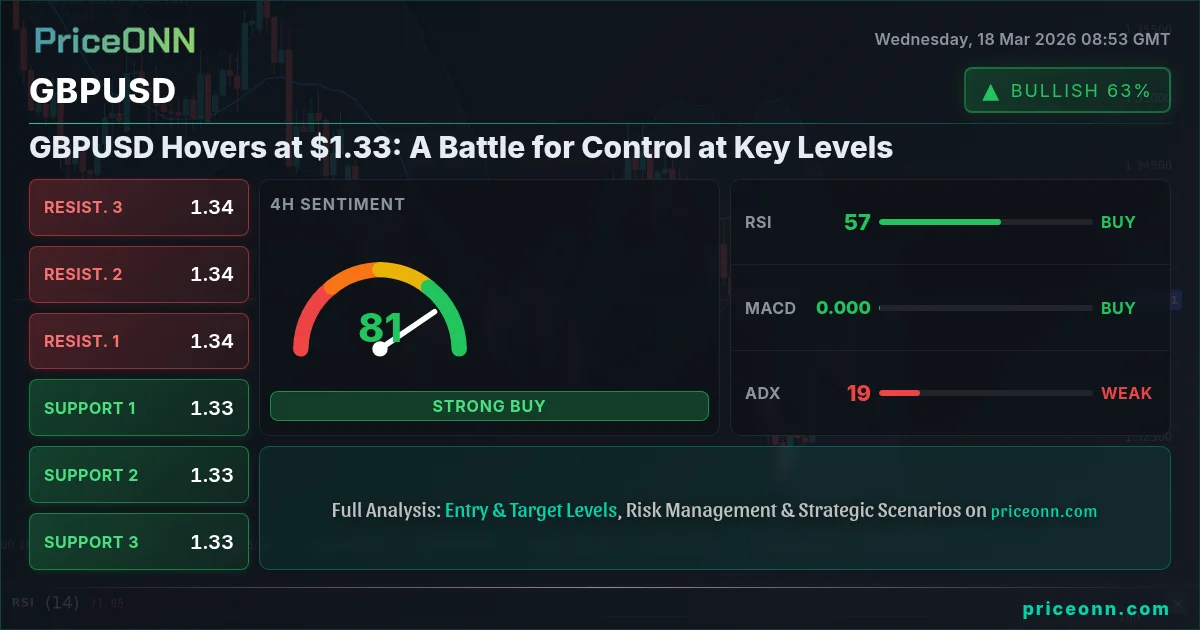
GBPUSD is trading at $1.33, caught between critical support and resistance. A daily close above $1.3372 could signal upside, while a break below $1.3296 risks further declines.
GBPUSD is currently locked in a tight range, hovering precariously around the $1.33 mark. This psychological level, coupled with significant technical boundaries, has created a critical juncture for the pair. Traders are intensely watching to see whether Sterling can muster the strength to push higher or if the prevailing headwinds will force it lower. The current price action suggests a market in consolidation, but the underlying forces at play hint at a potential breakout. Understanding the interplay between technical signals, macroeconomic drivers, and market sentiment is paramount for navigating this pivotal moment.
- GBPUSD is trading at $1.33, with a daily RSI of 43.29 indicating a bearish lean.
- Critical support is identified at $1.3296, a level that has shown resilience previously but risks further declines if breached.
- Resistance looms at $1.33875, a break above which could open the door for a bullish move towards higher targets.
- DXY strength at 99.38 is a significant factor, exerting downward pressure on GBPUSD, while mixed signals from 4H and 1D charts suggest caution.
The GBPUSD's dance around $1.33 is more than just a price point; it represents a tug-of-war between opposing market forces. On the daily chart, the pair exhibits a bearish trend, reinforced by a daily RSI(14) reading of 43.29. This suggests that while the price might be consolidating, the underlying momentum leans towards sellers. The ADX at 31.4 further confirms a strong downtrend is in place on the daily timeframe, indicating conviction behind the move. However, the 1-hour and 4-hour charts present a slightly different, albeit cautious, picture. The 1H trend is technically bullish, and the 4H trend is neutral, showing some signs of temporary respite or potential consolidation before the next major move. This multi-timeframe conflict is precisely why traders are exhibiting a 'watch and wait' approach.
The Bull's Roadmap: What Needs to Happen for Sterling to Rally
Navigating the Resistance Barrier
For GBPUSD to embark on a sustained upward journey, it must first conquer the immediate resistance levels. The most critical hurdle is the R1 resistance at $1.33875. A decisive close above this level on the daily chart would be a significant bullish signal, suggesting that the bearish sentiment is waning. This breakout would need to be supported by increasing trading volume and a shift in momentum across multiple timeframes. The 1H Stochastic is already showing a bullish signal (%K > %D), and the 4H Stochastic is in overbought territory (K=93.19, D=88.6), hinting at potential buying pressure, though the latter also suggests a risk of a short-term pullback if the price doesn't accelerate upwards.
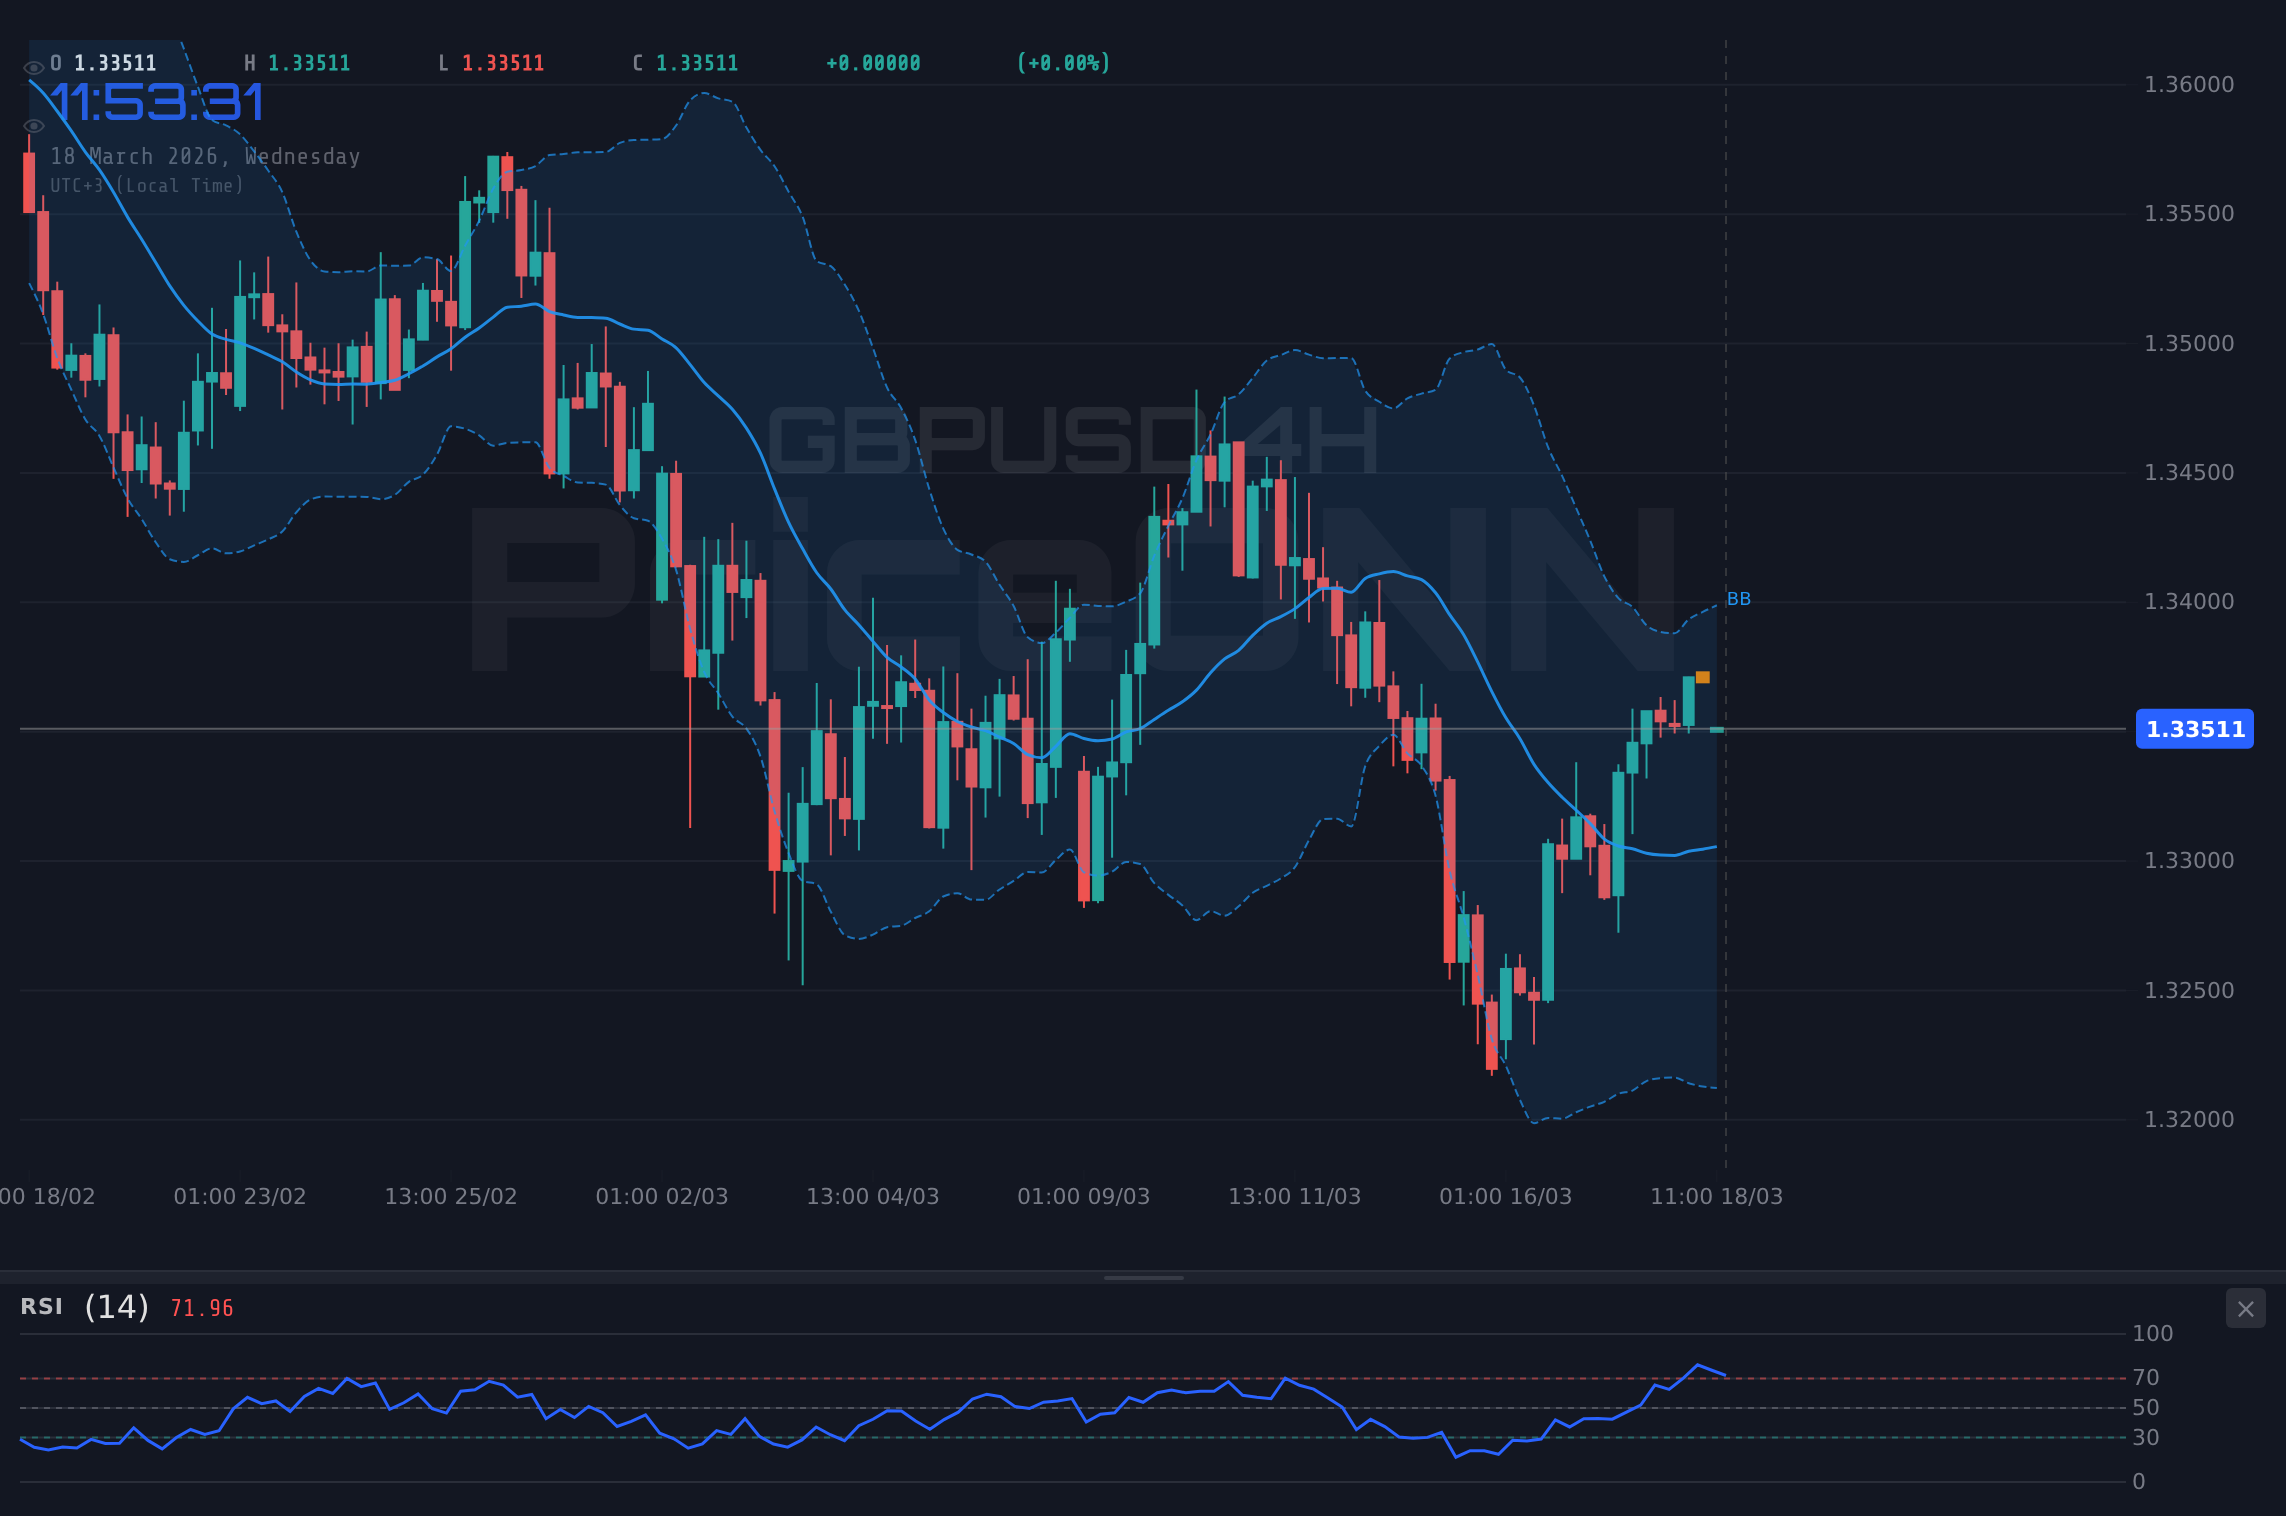
Beyond $1.33875, the next significant resistance lies at $1.3421 (R2). A break and hold above this level would further solidify the bullish case, potentially targeting the R3 resistance at $1.34786. Such a move would likely require a significant shift in market sentiment, perhaps driven by positive economic data from the UK or a dovish turn from the Federal Reserve. On the technical front, a sustained move above the middle Bollinger Band on the daily chart, which is currently acting as resistance, would be a crucial confirmation. The ADX on the 4H chart is relatively weak at 19.29, suggesting that any upward move might lack strong trend conviction initially, making it susceptible to reversals if not properly supported by fundamental catalysts.
The Role of Macroeconomic Data and Sentiment
The narrative for a GBPUSD rally is heavily dependent on the UK's economic outlook and the US Federal Reserve's policy stance. Positive UK inflation data, perhaps showing a faster-than-expected decline, or robust employment figures could provide the necessary impetus for Sterling to strengthen. Conversely, any indication from the Fed that interest rates will remain higher for longer, or even potential rate hikes, would likely bolster the US Dollar (as indicated by the DXY currently at 99.38) and put pressure on GBPUSD. The current 4H Stochastic at 93.19 is flashing an overbought warning, indicating that a short-term pullback is possible even if the longer-term trend is set to turn bullish. A consolidation above $1.33598 (4H resistance acting as new support) would be a healthy sign before attempting further upside.
Where Bears Take Control: The Downside Risk Scenario
Testing the Support Structure
The bearish case for GBPUSD hinges on its ability to break decisively below the key support levels. The immediate support is found at $1.3296 (S1 on the daily chart). A failure to hold this level, especially with significant volume, could trigger a cascade of selling, leading to a retest of the $1.32388 (S2) support. The daily RSI at 43.29 and MACD showing negative momentum support this downside view. If the price decisively closes below $1.3296, it would invalidate any short-term bullish aspirations and likely send Sterling towards the $1.32053 (S3) level. The 1H chart, while showing a bullish Stochastic, is still battling the daily bearish trend, making it vulnerable to a sharp reversal.
The strength of the US Dollar, as reflected by the DXY's current position at 99.38 and its daily uptrend, remains a formidable obstacle for GBPUSD. If geopolitical tensions escalate or US economic data continues to surprise to the upside, the DXY could surge, dragging GBPUSD lower. The 4H chart's ADX at 42.63 (for XAGUSD, but indicative of strong trends in related markets) and the daily ADX at 31.4 for GBPUSD itself, both point towards strong trending conditions, suggesting that once a direction is established, it can be powerful. A break below $1.32053 would open up a much larger downside target, potentially retesting lows not seen in months, though this would require significant bearish catalysts.
Economic Indicators Favoring a Bearish Outlook
For Sterling to falter, we would need to see negative surprises in UK economic data. Weak inflation figures that suggest deflationary pressures, or disappointing employment reports, could significantly weigh on the currency. On the flip side, any hawkish commentary from the Bank of England, hinting at a pause or reversal in rate cuts due to persistent inflation concerns, could also support Sterling, but in the short term, if the Fed remains hawkish, the dollar's strength would likely dominate. The current daily signals are predominantly 'SELL' (6 out of 7), underscoring the prevailing bearish sentiment on the longer timeframe. The 1H Stochastic is showing a bullish crossover, but this is occurring against a strong daily downtrend, making it a potentially deceptive signal.
The Waiting Game: Consolidation Around $1.33
Factors Keeping GBPUSD in a Range
The neutral scenario for GBPUSD involves price action remaining confined within the current trading range, likely between the immediate support at $1.3296 and resistance at $1.33875. This 'flat' market condition often occurs when traders are awaiting significant economic data releases or central bank policy decisions. The upcoming economic calendar will be crucial. Any uncertainty surrounding the Federal Reserve's next move or the Bank of England's inflation outlook could lead to a period of indecision. On the technical front, this consolidation would be characterized by oscillating indicators and choppy price action, with neither the bulls nor the bears able to establish firm control.
The RSI readings across different timeframes (43.29 daily, 55.47 4H, 50.33 1H) show a divergence, with the daily leaning bearish and the higher timeframes showing more neutrality or even a slight bullish inclination. This mixed signal environment is a hallmark of consolidation. The ADX values also reflect this; the daily ADX at 31.4 suggests a strong trend, but the 1H and 4H ADX values are much lower, indicating weaker trends or ranging conditions on those frames. This conflict means that significant moves might be short-lived, with price quickly reversing back into its range. Scalpers might find opportunities within this range, but swing traders would likely remain on the sidelines, waiting for a clearer directional bias to emerge.
The Importance of Key Events
For GBPUSD to remain range-bound, key upcoming events need to either confirm existing biases without providing a strong new direction or create enough uncertainty to paralyze market participants. For instance, if US inflation data comes in slightly above expectations but not dramatically so, and Fed commentary remains cautiously optimistic, it might not be enough to push the DXY significantly higher, nor enough to convince the Bank of England to drastically alter its policy outlook. This delicate balance could keep GBPUSD pinned between $1.3296 and $1.33875 for an extended period. The Stochastic indicators are also showing conflicting signals: the 1H and 1D are showing bullish crossovers from oversold/neutral territory, while the 4H is in overbought territory and showing a bearish crossover. This is the definition of a mixed signal environment, perfect for range-bound trading, but frustrating for trend followers.
Probabilistic Outlook: Where the Smart Money Might Be Leaning
The Most Likely Scenario
Considering the current technical landscape, the daily chart's strong bearish signals (RSI 43.29, ADX 31.4, predominantly SELL signals) carry significant weight. While the intraday and 4-hour charts show some bullish potential, they are often subject to noise and short-term fluctuations. The prevailing trend on the most significant timeframe (daily) suggests that the path of least resistance is still downwards. Therefore, the bearish scenario, while not a guaranteed outcome, appears to be the most probable in the short to medium term, assuming no major shifts in macroeconomic data or central bank policy. I would assign a 60% probability to the bearish scenario playing out, 30% to a neutral range-bound market, and only a 10% probability to a sustained bullish breakout in the immediate future.
What Needs to Happen for the Bias to Shift
The bullish scenario, currently carrying a lower probability, would gain traction if GBPUSD can decisively break and hold above the $1.33875 resistance level. This would need confirmation from a daily RSI moving back above 50 and ideally towards 60, along with a strengthening ADX above 25 on the daily chart. Furthermore, a shift in the DXY's trend or significant dovish signals from the Fed would be necessary catalysts. Until then, the bearish undertone supported by the daily technicals remains the dominant theme. The current price action around $1.33 is a critical test; a failure to bounce strongly here could be the precursor to the bearish scenario materializing.
What I'm Watching This Week
Key Triggers to Monitor
This week, my attention will be focused on three key areas that could dictate the direction of GBPUSD:
- The $1.3296 Support Level: A daily close below this level would be a significant bearish signal, potentially triggering further downside. I'll be watching the volume on any break below this level.
- The $1.33875 Resistance Level: A sustained move and daily close above this resistance would be the primary bullish trigger. Confirmation would come from improved RSI and MACD readings on the daily chart.
- DXY and Fed Commentary: The US Dollar Index (DXY) at 99.38 is a major influence. Any significant moves in the DXY, particularly driven by Fed speeches or interest rate expectations, will be critical in shaping GBPUSD's trajectory.
The market is at a crossroads, and while the daily technicals lean bearish, the intraday charts offer glimpses of potential upside. Patience and discipline will be key. Waiting for clear signals and respecting risk management principles will be crucial for navigating the choppy waters ahead. The $1.33 level is not just a price; it's a battleground.
Bearish Scenario: Sterling's Slippage Continues
60% ProbabilityNeutral Scenario: The Range-Bound Stalemate
30% ProbabilityBullish Scenario: The Sterling Rally Ignites
10% ProbabilityFrequently Asked Questions: GBPUSD Analysis
What happens if GBPUSD breaks below the $1.3296 support level?
A daily close below $1.3296 would invalidate short-term bullish hopes and likely trigger further selling pressure. This could lead to a retest of the $1.32388 support, with a potential move towards $1.32053 if the bearish momentum persists.
Should I buy GBPUSD at current levels of $1.33 given the mixed technical signals?
Caution is advised. While some intraday indicators show bullish potential, the daily trend remains bearish with an RSI at 43.29. A buy signal would require confirmation of a sustained break above $1.33875, supported by improving daily momentum and a shift in DXY.
Is the daily RSI at 43.29 a strong sell signal for GBPUSD?
An RSI of 43.29 indicates a bearish lean but is not yet in oversold territory. It suggests that sellers have the upper hand on the daily chart, supporting the bearish outlook. However, it does not signal an immediate, aggressive sell-off on its own.
How will the upcoming Fed commentary affect GBPUSD this week?
Hawkish Fed commentary, suggesting higher-for-longer interest rates, would likely strengthen the DXY and put downward pressure on GBPUSD. Conversely, dovish remarks could ease dollar strength and offer Sterling some relief, potentially supporting a move towards resistance levels.
Track markets in real-time
AI-powered analysis, technical indicators and real-time price data.
Join Our Telegram Channel
Breaking market news, AI analysis and trading signals instantly.
Join Channel