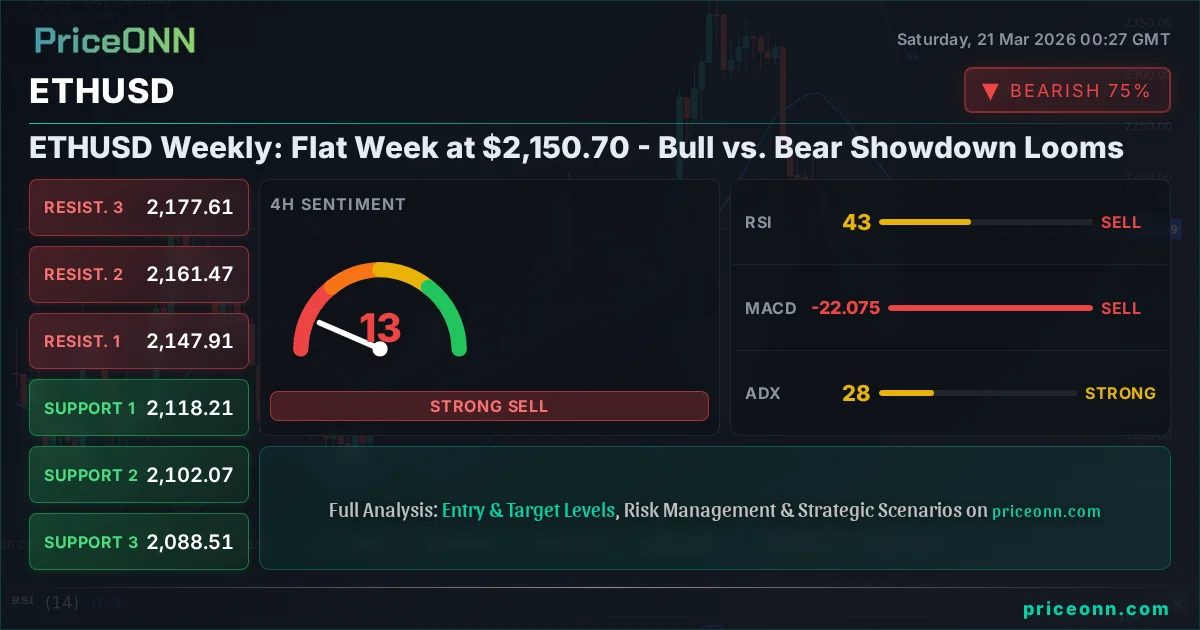
ETHUSD Weekly: Flat Week at $2,150.70 - Bull vs. Bear Showdown Looms
ETHUSD traded sideways around $2,150.70 last week. Bulls eye a breakout above $2,163.73, while bears watch support at $2,142.97.
The past week saw ETHUSD consolidating, trading in a tight range around the $2,150.70 mark. This period of relative calm followed a volatile preceding week, leaving traders and investors in a state of anticipation, waiting for a decisive move. The battleground is clearly defined: bulls are defending key support levels, hoping to push Ethereum higher, while bears are looking for a breakdown to capitalize on further downside. This week's analysis dives deep into the technicals and fundamentals shaping this critical juncture, exploring the arguments for both sides of the ETHUSD market.
- ETHUSD is currently consolidating around $2,150.70, showing a neutral trend on the daily chart with weak ADX at 24.56.
- Key support for ETHUSD sits at $2,142.97, a level that has held during the recent consolidation. A break below this could trigger further selling.
- Resistance is observed at $2,163.73; a daily close above this level would be required to shift the short-term sentiment towards bullishness.
- The 4-hour chart shows negative MACD momentum and RSI below 50, indicating bearish pressure despite the daily chart's neutral stance.
The Bullish Case: Can Ethereum Break Higher?
The bulls are looking for ETHUSD to hold its ground and build momentum for an upward move. The current price of $2,150.70, while indicating a flat week, is still hovering above critical support levels identified on the 1-hour and 4-hour charts. Specifically, the $2,142.97 level has acted as a floor during the recent sideways action. If this support holds firm, bulls aim to reclaim higher ground. The immediate target would be the resistance at $2,163.73. A decisive break and daily close above this level would be a significant bullish signal, potentially reigniting buying interest and paving the way for a move towards the next resistance at $2,175.21. The 1-hour chart, in particular, shows a generally bullish signal with a strong buy count (7/1), although the MACD is still showing negative momentum, which needs to be overcome.
Furthermore, the daily RSI, while neutral at 51.86, is not in overbought territory, suggesting there's room for upside before the asset becomes technically stretched. The Stochastic Oscillator on the daily chart, with %K at 42.63 and %D at 69.13, is showing a bearish crossover, which is a point of concern for the bulls, but it's not yet in oversold territory, leaving room for a potential reversal if buying pressure intensifies. The ADX on the daily timeframe is at 24.56, indicating a moderately trending market, which could support a sustained move if the price can clear immediate resistance.
On-chain metrics, while not provided in real-time data, often play a crucial role in validating bullish sentiment. An increase in active addresses, significant whale accumulation, or positive exchange flows could provide fundamental backing to a technical breakout. For instance, if we see a substantial increase in Total Value Locked (TVL) across DeFi protocols built on Ethereum, it would signal growing confidence in the network and potentially drive demand for ETH. Similarly, positive developments in Ethereum's scaling solutions or a significant reduction in gas fees, perhaps through Layer 2 advancements, could attract more users and developers, indirectly boosting ETH's price.
The broader crypto market sentiment also plays a role. If Bitcoin, the market leader, shows signs of strength and breaks above its key resistance levels, it often pulls Ethereum and the rest of the altcoin market higher. While Bitcoin's 4-hour chart indicates negative momentum, its 1-day chart shows a bullish trend, offering some hope for a broader market uplift. The correlation between ETHUSD and BTCUSD is typically high, so a bullish move in Bitcoin could easily translate into a bullish ETHUSD scenario. The bulls are watching the $2,150.70 level closely, hoping it acts as a launchpad rather than a temporary pause.
Bullish Scenario: Reclaiming the Highs
35% ProbabilityThe Bearish Case: Is a Deeper Correction Imminent?
Conversely, the bears see the current consolidation not as a pause, but as a prelude to a sharper decline. The negative momentum on the 4-hour MACD, coupled with RSI readings below 50 on the same timeframe, suggests that underlying selling pressure is building. The fact that the price is trading below the middle Bollinger Band on the 4-hour chart further supports this bearish outlook, indicating a downward bias. The Stochastic Oscillator on the 4-hour chart shows a bearish crossover (%K below %D), reinforcing the idea that momentum is shifting downwards.
The daily chart, while showing a neutral trend, has a strong ADX reading of 44.59 for SP500, which is a concern for risk assets, and a robust 24.56 for ETHUSD itself. This suggests that if a trend does emerge, it could be strong. The bears are specifically targeting a break below the $2,142.97 support level. A convincing move below this price point, especially with significant volume, could trigger stop-loss orders and accelerate the decline. The next logical support level to watch would be $2,133.69, followed by $2,122.21. Each of these levels represents a potential area where buyers might step in, but a strong bearish trend could push through them rapidly.
The daily Stochastic Oscillator's bearish crossover (%K at 42.63, %D at 69.13) is a significant warning sign for the bulls. While not yet oversold, this cross suggests a potential downward move is more likely than an upward one in the short to medium term. The daily RSI at 51.86 is also not signaling a strong bullish reversal; it's essentially at the midpoint, indicating indecision, but any slip below 50 would add to the bearish narrative.
From a fundamental perspective, any negative news concerning Ethereum's network upgrades, regulatory crackdowns, or a broader market downturn driven by macroeconomic factors could fuel this bearish scenario. For example, if central banks signal a more hawkish stance on interest rates, or if inflation data remains stubbornly high, risk assets like cryptocurrencies often suffer. The strengthening DXY (Dollar Index) at 99.39 also adds to the bearish pressure on ETHUSD, as a stronger dollar typically makes dollar-denominated assets less attractive. If the DXY continues its upward trend, it could weigh heavily on ETHUSD.
Furthermore, developments in the broader crypto ecosystem can impact ETHUSD. Increased selling pressure from major holders ('whales'), large outflows from staking pools, or negative sentiment surrounding upcoming Ethereum network updates could spook investors. Even if the technology is sound, market sentiment driven by fear or uncertainty can lead to sharp price declines. The bears are watching the $2,150.70 level, hoping it represents a ceiling that will soon lead to a significant drop.
Bearish Scenario: Testing Lower Support Levels
60% ProbabilityThe Neutral Stance: Consolidation Continues
Caught between the bullish hopes and bearish fears, a neutral scenario suggests that ETHUSD will continue to trade sideways in the immediate future. This view is supported by the daily chart's neutral trend (50% strength) and a relatively weak ADX of 24.56, indicating a lack of strong directional momentum. The price action around $2,150.70, failing to decisively break either support or resistance for an extended period, points towards a period of indecision in the market.
In this scenario, both support at $2,142.97 and resistance at $2,163.73 remain the key levels to watch. Price may continue to oscillate between these boundaries, with traders looking for short-term opportunities within the range. Volume might remain subdued, characteristic of a market waiting for a catalyst. On-chain metrics might show mixed signals – perhaps stable active addresses but declining whale activity, reflecting this cautious market sentiment. DeFi TVL might remain flat, with new liquidity hesitant to enter until a clear trend emerges.
The 1-hour chart's mixed signals – bullish Stochastic but negative MACD momentum – also lend credence to a neutral outlook. While the overall trend strength is low, the lack of a clear directional bias on multiple timeframes suggests that neither bulls nor bears have gained a significant upper hand. This could lead to further price discovery within the current range, with traders focusing on short-term fluctuations rather than longer-term directional plays.
From a macro perspective, this neutral stance could persist if key economic data releases, such as upcoming employment figures or central bank statements, offer conflicting signals or provide no clear direction for interest rate policy. If the DXY remains range-bound and equity markets show similar consolidation, ETHUSD is likely to follow suit. The market is in a holding pattern, waiting for a clear catalyst – either a strong bullish breakout or a decisive bearish breakdown – to signal the next significant move.
Neutral Scenario: Range-Bound Trading Continues
5% ProbabilityKey Technical Indicators and Their Implications
Delving deeper into the technical indicators provides a more granular view of the ETHUSD market's current state. On the 1-hour chart, the RSI is at 53.98, indicating a slight upward bias but far from overbought conditions. The MACD, however, shows negative momentum, with the MACD line below the signal line, suggesting potential downward pressure. The Stochastic Oscillator is in bullish territory (%K at 72.74, %D at 47.24), but the ADX at a weak 14.41 indicates a lack of a strong trend, making any short-term moves less reliable.
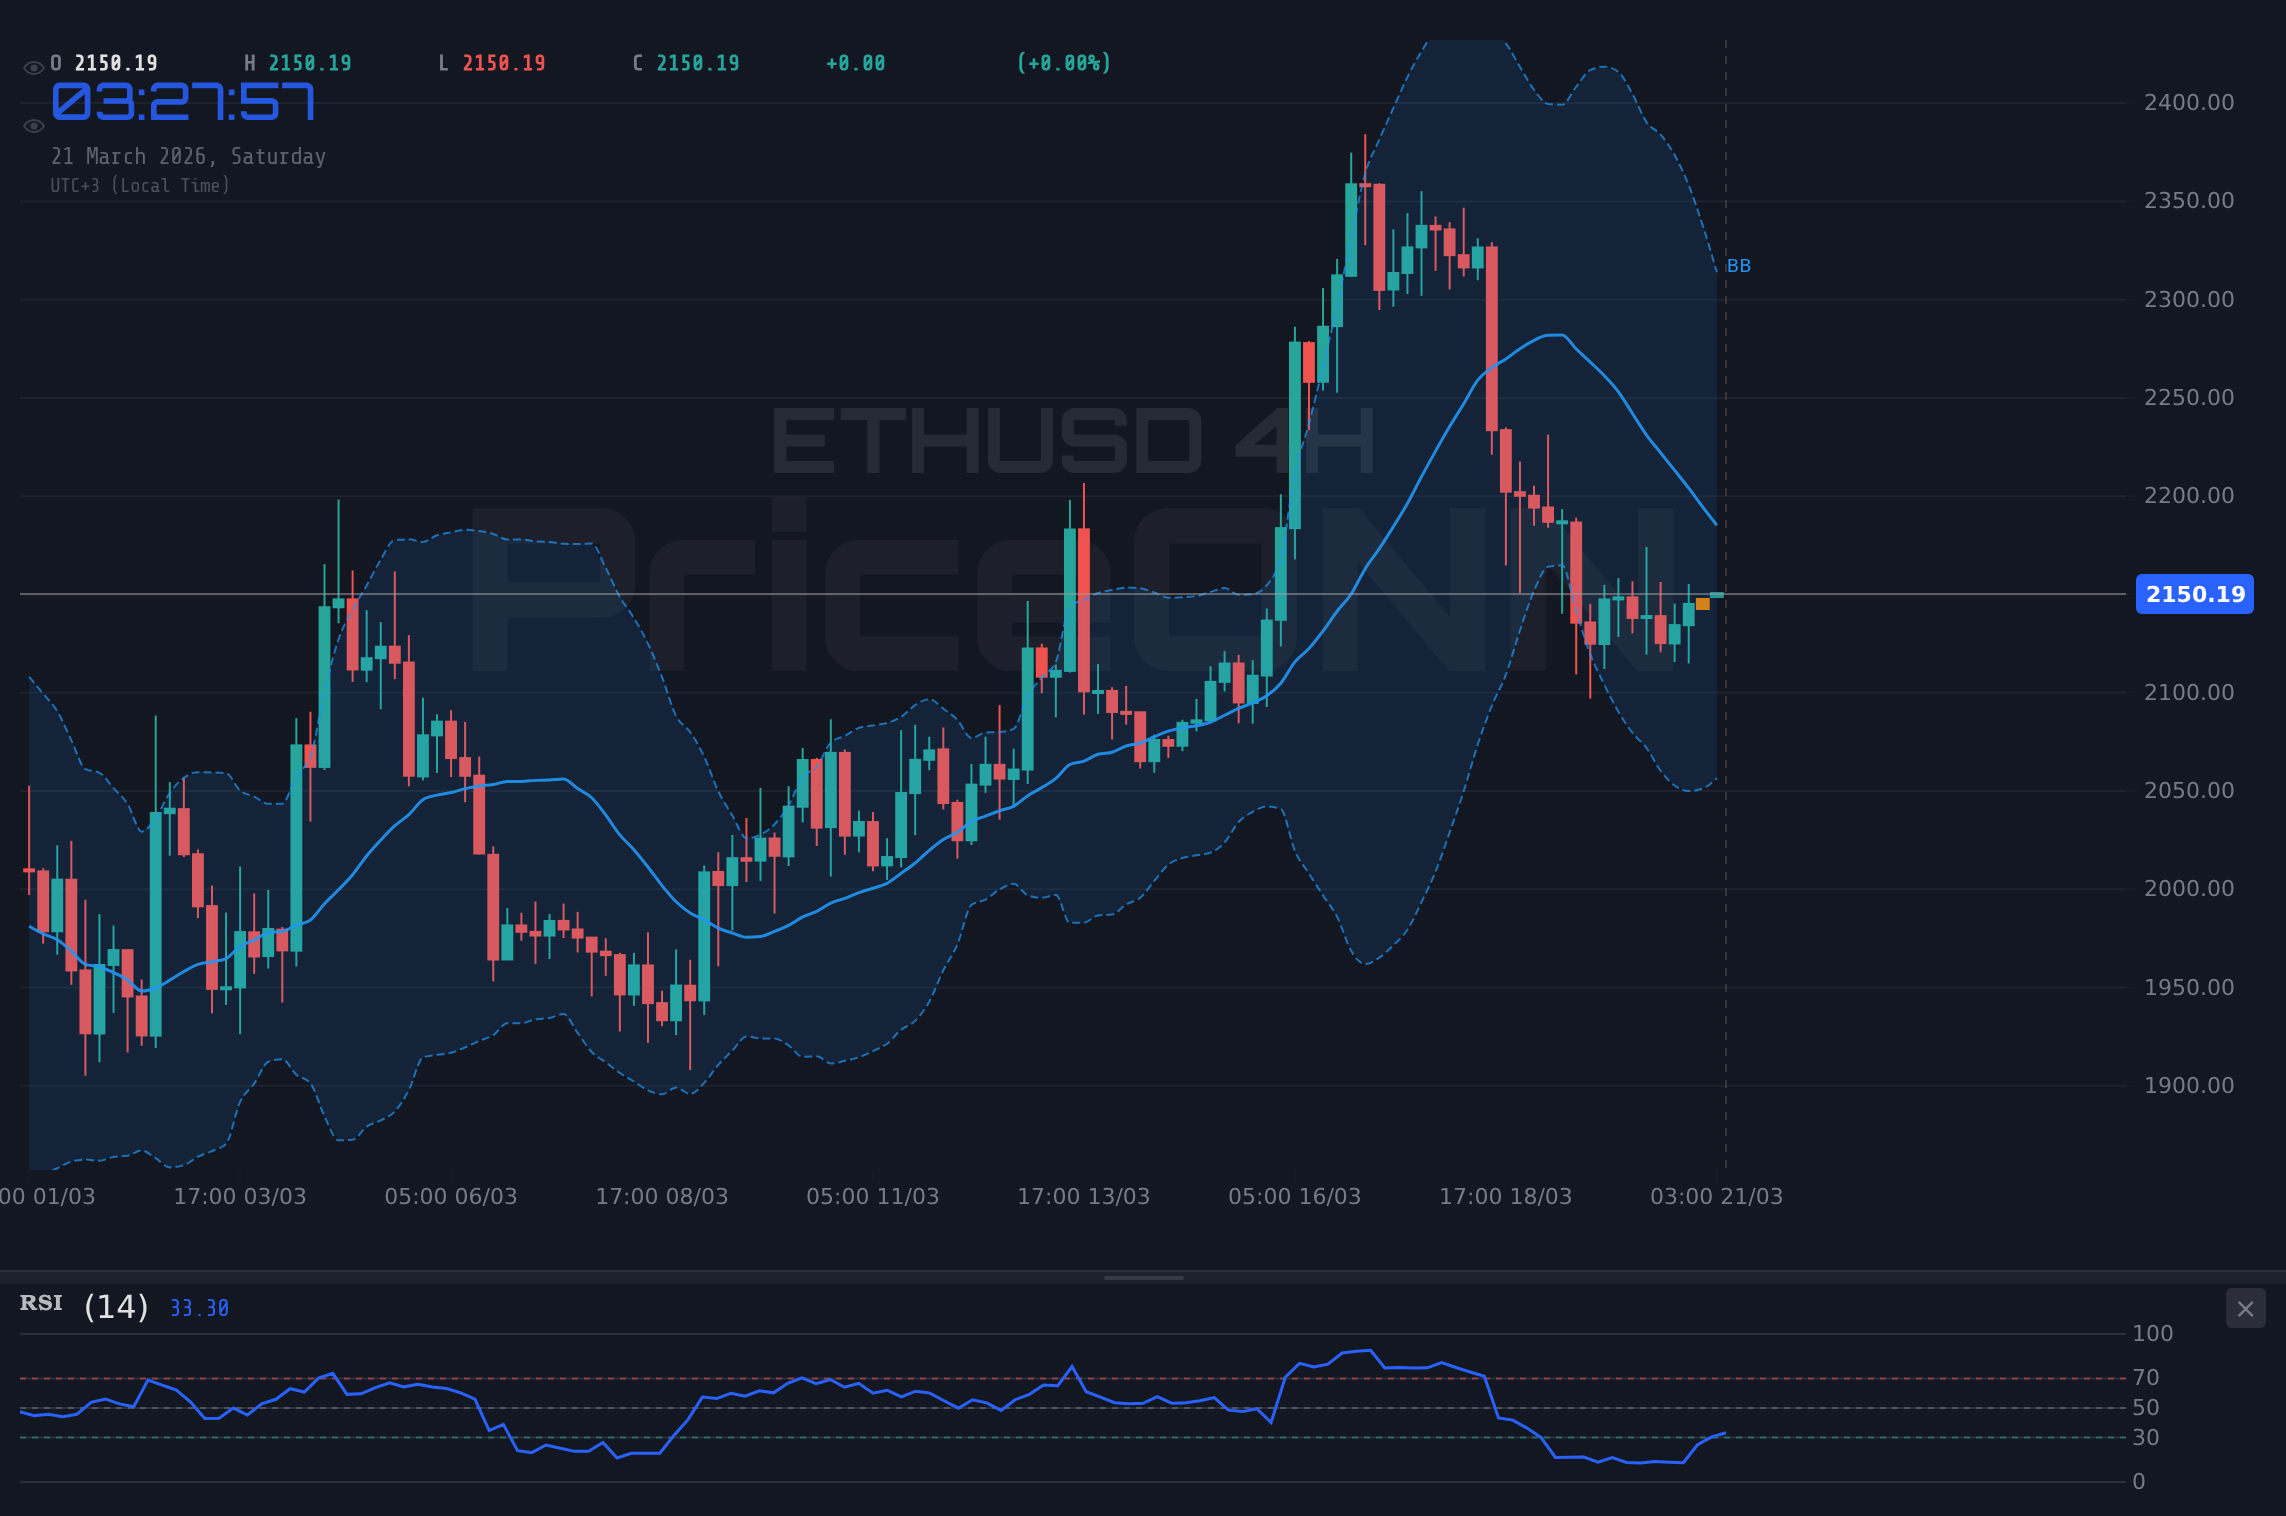
The 4-hour chart presents a more bearish picture. The RSI is at 42.77, well below the 50 mark and trending downwards, suggesting bearish sentiment is gaining ground. The MACD here is also negative, reinforcing this view. The Stochastic Oscillator shows a bullish crossover (%K at 39.39, %D at 30.66), which contradicts the negative MACD and RSI, creating a mixed signal. The ADX at 27.99 suggests a stronger trend is developing, but the conflicting signals from other indicators make its direction uncertain.
On the daily timeframe, the picture becomes more balanced, albeit with a slight bearish lean in the indicators. The RSI at 51.86 is right at the neutral line, offering no clear directional bias. However, the MACD is showing positive momentum with the MACD line above the signal line, which is a bullish sign. Conversely, the Stochastic Oscillator's bearish crossover (%K at 42.63, %D at 69.13) and the ADX at 24.56 (indicating a moderately trending market) lean towards caution. The Bollinger Bands on the daily chart are currently around the middle band, suggesting consolidation, but any move outside the bands could signal increased volatility.
The overall interpretation of these indicators is that the market is at a crossroads. The short-term (1-hour) shows some bullish signs, the medium-term (4-hour) leans bearish, and the long-term (daily) is mixed with conflicting signals. This ambiguity suggests that price action will likely be driven by external catalysts or a decisive move through the key support at $2,142.97 or resistance at $2,163.73. Traders will need to watch for confirmation signals, such as a sustained move above resistance with increasing volume or a clear break below support accompanied by a surge in selling pressure.
Macroeconomic Influences and Crypto Correlations
The performance of ETHUSD is intrinsically linked to broader macroeconomic trends, particularly interest rate policies and the strength of the US Dollar. The DXY (Dollar Index) is currently trading at 99.39, showing an upward trend. A strengthening dollar often exerts downward pressure on risk assets like cryptocurrencies, including Ethereum. If the DXY continues to rally, it could act as a headwind for ETHUSD, making it more expensive for holders of other currencies and potentially reducing demand.
The correlation between ETHUSD and major equity indices like the S&P 500 (currently at 6536.05, facing downward pressure) and Nasdaq 100 (at 23992.13, also falling) is also a critical factor. A risk-off sentiment in traditional markets, as indicated by the declines in these indices, often spills over into the crypto space. If equities continue to sell off due to geopolitical tensions or rising interest rate expectations, investors may flee to safer assets, pulling capital away from riskier investments like ETHUSD.
Central bank policies, especially from the US Federal Reserve, remain a dominant theme. While specific Fed meeting minutes or statements weren't provided in the live data, market expectations about future interest rate decisions heavily influence risk appetite. If the market anticipates prolonged higher interest rates, it could dampen demand for growth assets and speculative investments. Conversely, any hint of a dovish pivot or a pause in rate hikes could boost ETHUSD.
The recent news about gold prices tumbling below $4,500, despite escalating geopolitical tensions, highlights a complex market dynamic. While gold is typically a safe-haven asset, its recent decline suggests that rising interest rate expectations might be overriding geopolitical fears for some investors. This could signal a broader risk-off sentiment where even traditional safe havens are struggling, which would be a negative indicator for ETHUSD. The fact that oil prices are soaring might suggest inflationary pressures, which could complicate central bank decisions and add another layer of uncertainty for crypto markets.
The provided market data shows a strong downward trend in XAUUSD (Gold) and XAGUSD (Silver), trading at $4,497.65 and $67.9 respectively. This sharp decline in precious metals, despite geopolitical escalations, is a notable development. Typically, gold and silver rise during times of uncertainty as safe-haven assets. Their fall suggests that either the market is discounting the geopolitical risks, or, more likely, the dominant narrative is centered around inflation and the potential for higher interest rates, which can put pressure on non-yielding assets like precious metals and cryptocurrencies.
With the DXY strengthening and major equity indices under pressure, the macro environment presents headwinds for ETHUSD. Investors are closely watching interest rate expectations, which are currently overshadowing geopolitical concerns for traditional safe-havens like gold.
On-Chain Metrics and Ecosystem Developments
While the provided real-time data focuses on price action and technical indicators, a comprehensive analysis of ETHUSD must consider on-chain metrics and ecosystem developments. These fundamental aspects provide a deeper understanding of Ethereum's underlying health and future potential.
Active Addresses and Transaction Volume: An increase in daily active addresses and transaction volume would indicate growing network usage and demand for ETH. This suggests more users are actively participating in the Ethereum ecosystem, whether for DeFi, NFTs, or simple transactions. Conversely, a decline in these metrics could signal waning interest or network congestion.
Whale Movements: Tracking the accumulation or distribution patterns of large ETH holders ('whales') is crucial. Significant inflows to exchanges from whale wallets could signal potential selling pressure, while large outflows might indicate accumulation and long-term confidence in the asset. Given the current price consolidation, observing these movements closely is vital for anticipating potential shifts in market sentiment.
Exchange Flows: Net exchange flows (inflows vs. outflows) provide insight into immediate selling or buying pressure. Consistent net outflows from exchanges suggest that investors are moving ETH into self-custody or staking, indicating a belief in future price appreciation. High net inflows, on the other hand, can signal an increased likelihood of selling.
DeFi and NFT Ecosystem: The Total Value Locked (TVL) in Ethereum's DeFi protocols is a key indicator of the network's utility and adoption. A rising TVL suggests increased capital is being deployed in decentralized applications, driving demand for ETH as collateral or transaction fuel. Similarly, the health of the NFT market, measured by trading volumes and unique buyer counts, reflects broader interest in Ethereum-based applications. Recent news about Ethereum developers working on 'one-click staking' for institutions and efforts to cut bridge times by 98% to 13 seconds are positive developments that could enhance user experience and attract more institutional participation, potentially boosting ETH's fundamental value.
Staking Yields and Network Security: The Ethereum Proof-of-Stake consensus mechanism relies on stakers to secure the network. Attractive staking yields can incentivize more ETH to be locked up, reducing the circulating supply and potentially supporting the price. A high hash rate (for Proof-of-Work networks, though Ethereum is now PoS) or a high percentage of staked ETH indicates a robust and secure network.
Gas Fees: High gas fees can deter users and developers, negatively impacting network activity. Efforts to reduce gas fees through Layer 2 scaling solutions or network upgrades are crucial for Ethereum's long-term growth. While specific gas fee data isn't provided, any significant changes in this area would be a fundamental driver for ETHUSD.
Regulatory Landscape: News like Elizabeth Warren demanding answers on the economic impact of 'illegal and reckless war' could indirectly impact crypto by influencing broader market sentiment or regulatory scrutiny. While not directly about ETHUSD, regulatory uncertainty can create headwinds for the entire crypto asset class. Conversely, positive regulatory developments, like clearer frameworks for digital assets, could be a significant tailwind.
While technicals show consolidation, positive developments like 'one-click staking' and reduced bridge times hint at fundamental improvements. Monitoring active addresses, whale movements, and DeFi TVL will be key to confirming any sustained price trend.
Trading Scenarios and Key Levels to Watch
The immediate future for ETHUSD hinges on price action around the key levels identified. The $2,142.97 support and $2,163.73 resistance form the boundaries of the current trading range. A break decisively through either of these levels will likely dictate the short-to-medium term trend.
Bullish Scenario: If ETHUSD manages to close above the $2,163.73 resistance on a daily basis, it would signal a potential breakout. This could be triggered by positive news, a broader market rally, or a shift in macroeconomic sentiment. In this case, the first target would be the previous swing high around $2,175.21, followed by a more extended target near $2,220.22, potentially based on Fibonacci extensions or previous significant price points. Confirmation would come from increasing volume and bullish momentum across multiple timeframes.
Bearish Scenario: The primary concern for the bulls is a breakdown below the $2,142.97 support. If this level fails, it could lead to a rapid sell-off as stop-loss orders are triggered. The first downside target would be $2,133.69, followed by $2,122.21. This scenario gains probability if the DXY continues to strengthen, equities fall, or negative on-chain developments emerge. A sustained close below $2,142.97 on the daily chart would invalidate any near-term bullish outlook.
Neutral Scenario: Until a clear breakout or breakdown occurs, range-bound trading is possible. In this scenario, ETHUSD might continue to oscillate between $2,142.97 and $2,163.73. Traders might look for range-bound strategies, buying near support and selling near resistance, although this carries higher risk in volatile crypto markets. This neutral phase could persist if the market awaits key economic data releases or significant news events. The ADX at 24.56 on the daily chart supports this lack of strong directional trend.
Traders should pay close attention to the 1-hour and 4-hour charts for immediate signals, but the daily timeframe provides the overarching trend context. The conflicting signals between different timeframes and indicators (e.g., MACD vs. Stochastic on the 4-hour) underscore the current indecision. Patience will be key; waiting for a clear confirmation signal before committing to a trade is advisable.
Bullish Scenario: Breakout Above Resistance
35% ProbabilityNeutral Scenario: Range-Bound Consolidation
5% ProbabilityBearish Scenario: Breakdown Below Support
60% ProbabilityThe Verdict: Waiting for Clarity
The past week has been uneventful for ETHUSD, with price action largely consolidating around the $2,150.70 level. This flat week, however, does not signify a lack of underlying tension. The technical indicators present a mixed picture across different timeframes, with short-term bullish signals battling against medium-term bearish momentum and a neutral daily outlook. The key levels to watch remain $2,142.97 for support and $2,163.73 for resistance. A decisive move through either of these levels, confirmed by volume and broader market sentiment, will likely set the direction for the coming week.
The bearish scenario appears to hold a slight edge, primarily due to the negative momentum on the 4-hour chart, the bearish Stochastic crossover on the daily, and the prevailing macroeconomic headwinds such as a strengthening DXY and risk-off sentiment in equities. A break below $2,142.97 could accelerate downwards. However, the bulls are not without hope. Holding $2,142.97 and managing to reclaim $2,163.73 could initiate a bullish reversal, especially if supported by positive on-chain developments or a shift in Fed policy expectations. The neutral scenario, while less probable, remains a possibility if market participants continue to wait for clearer signals.
Ultimately, ETHUSD is in a 'watch zone.' For traders, this means exercising patience and waiting for a clear setup. The current indecision suggests that attempting to force trades based on conflicting signals could lead to whipsaws. The probability of a bearish outcome seems slightly higher at 60%, with a 35% chance of a bullish breakout and only a 5% chance of continued range-bound trading. Investors should monitor the key levels, watch for confirmation from volume and momentum indicators, and stay attuned to macroeconomic news and on-chain data that could provide the catalyst for the next significant move.
Frequently Asked Questions: ETHUSD Analysis
What happens if ETHUSD breaks below the $2,142.97 support level this week?
A break below $2,142.97 would invalidate the current neutral stance and likely trigger a bearish move. The first downside target would be $2,133.69, with a secondary target at $2,122.21. This scenario is supported by negative 4-hour MACD momentum and a bearish daily Stochastic crossover.
Should I buy ETHUSD at current levels around $2,150.70 given the mixed signals?
Buying at current levels is not recommended due to conflicting signals across timeframes. A more prudent approach would be to wait for a confirmed break above $2,163.73 resistance with increasing volume for a bullish setup, or a clear breakdown below $2,142.97 support for a bearish trade.
Is the RSI at 51.86 on the daily chart a buy or sell signal for ETHUSD?
An RSI of 51.86 is considered neutral territory, indicating neither strong buying nor selling pressure. It suggests indecision in the market and does not provide a clear buy or sell signal on its own. Confirmation from other indicators and price action is needed.
How will the strengthening DXY at 99.39 affect ETHUSD's price this week?
A strengthening DXY typically puts downward pressure on risk assets like ETHUSD. If the dollar continues to rise, it could hinder any potential bullish moves and increase the probability of the bearish scenario playing out, especially if it coincides with negative on-chain developments.
Technical Outlook Summary
| Indicator | Value | Signal | Interpretation |
|---|---|---|---|
| RSI (14) | 51.86 | Neutral | Mid-point, indicating indecision. |
| MACD Histogram | -15.20 | Negative | Bearish momentum is present. |
| Stochastic | 42.63 / 69.13 | Bearish Crossover | Suggests potential downward move. |
| ADX | 24.56 | Moderate Trend | Market is trending, but not strongly directional. |
| Bollinger Bands | Middle Band | Testing | Price is consolidating around the middle band. |
Key Levels
Support Levels
Resistance Levels
Track markets in real-time
AI-powered analysis, technical indicators and real-time price data.
Join Our Telegram Channel
Breaking market news, AI analysis and trading signals instantly.
Join Channel