BTCUSD Weekly Outlook: $70,582.00 Holds Firm Amidst Volatility - A Watchful Eye on Key Levels
BTCUSD closed flat at $70,582.00 last week. Analysis reveals a bullish bias but caution is needed. Key support at $68,939.67, resistance at $71,755.67.
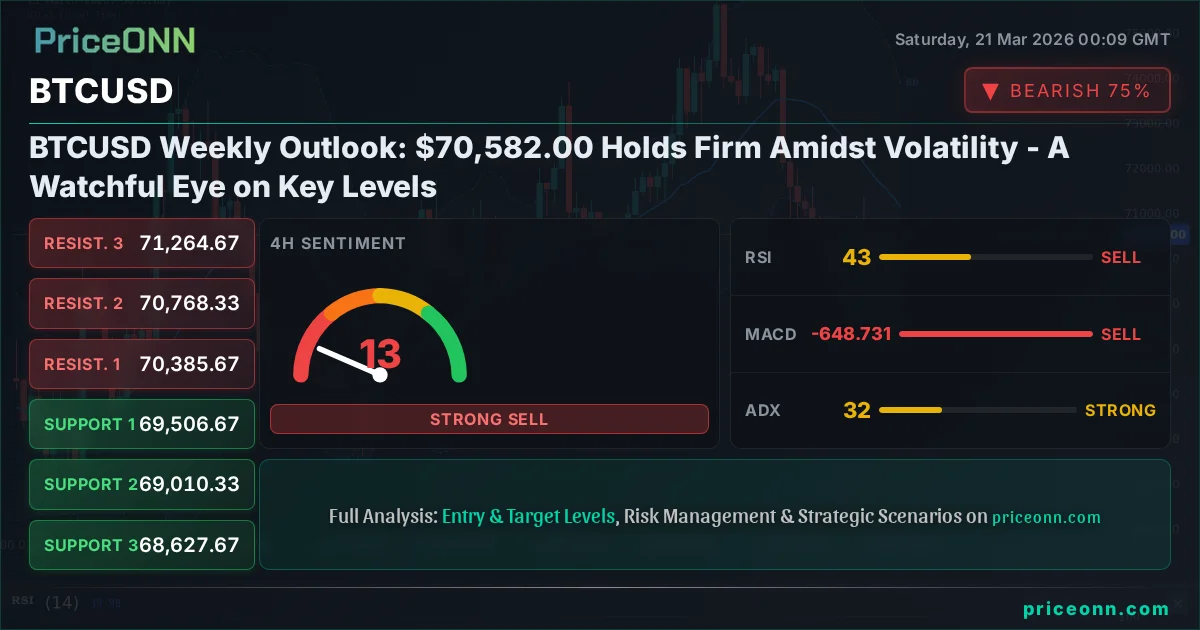
The past week saw Bitcoin (BTCUSD) consolidate around the $70,582.00 mark, closing with a flat profile but maintaining an underlying bullish sentiment. While the price action might appear uneventful on the surface, a deeper dive into the technical indicators and market structure reveals a complex interplay of forces. This analysis dissects the key developments from the past week, examines the critical levels that defined the trading range, and outlines what traders across different time horizons should watch for in the coming days. The current consolidation around $70,582.00 suggests a market pause rather than a definitive trend shift, with significant price action potentially on the horizon as key economic data and geopolitical developments continue to unfold. Understanding the nuances of Bitcoin's price action in the context of broader market correlations, particularly with the US Dollar Index (DXY) and equity markets, is paramount for navigating the current landscape.
- RSI at 49.7 on the daily chart signals a neutral-to-bearish momentum, indicating a lack of strong conviction from either bulls or bears.
- Critical support sits at $68,939.67, a level that has been tested and held previously, acting as a key floor for the current market structure.
- The MACD histogram showing positive momentum suggests underlying bullish pressure, but it remains below the signal line, hinting at caution.
- Fed rate expectations continue to influence BTCUSD's correlation with DXY; a hawkish stance from the Fed could pressure Bitcoin downwards, while a dovish outlook might support it.
Navigating the Consolidation: BTCUSD's Weekly Performance
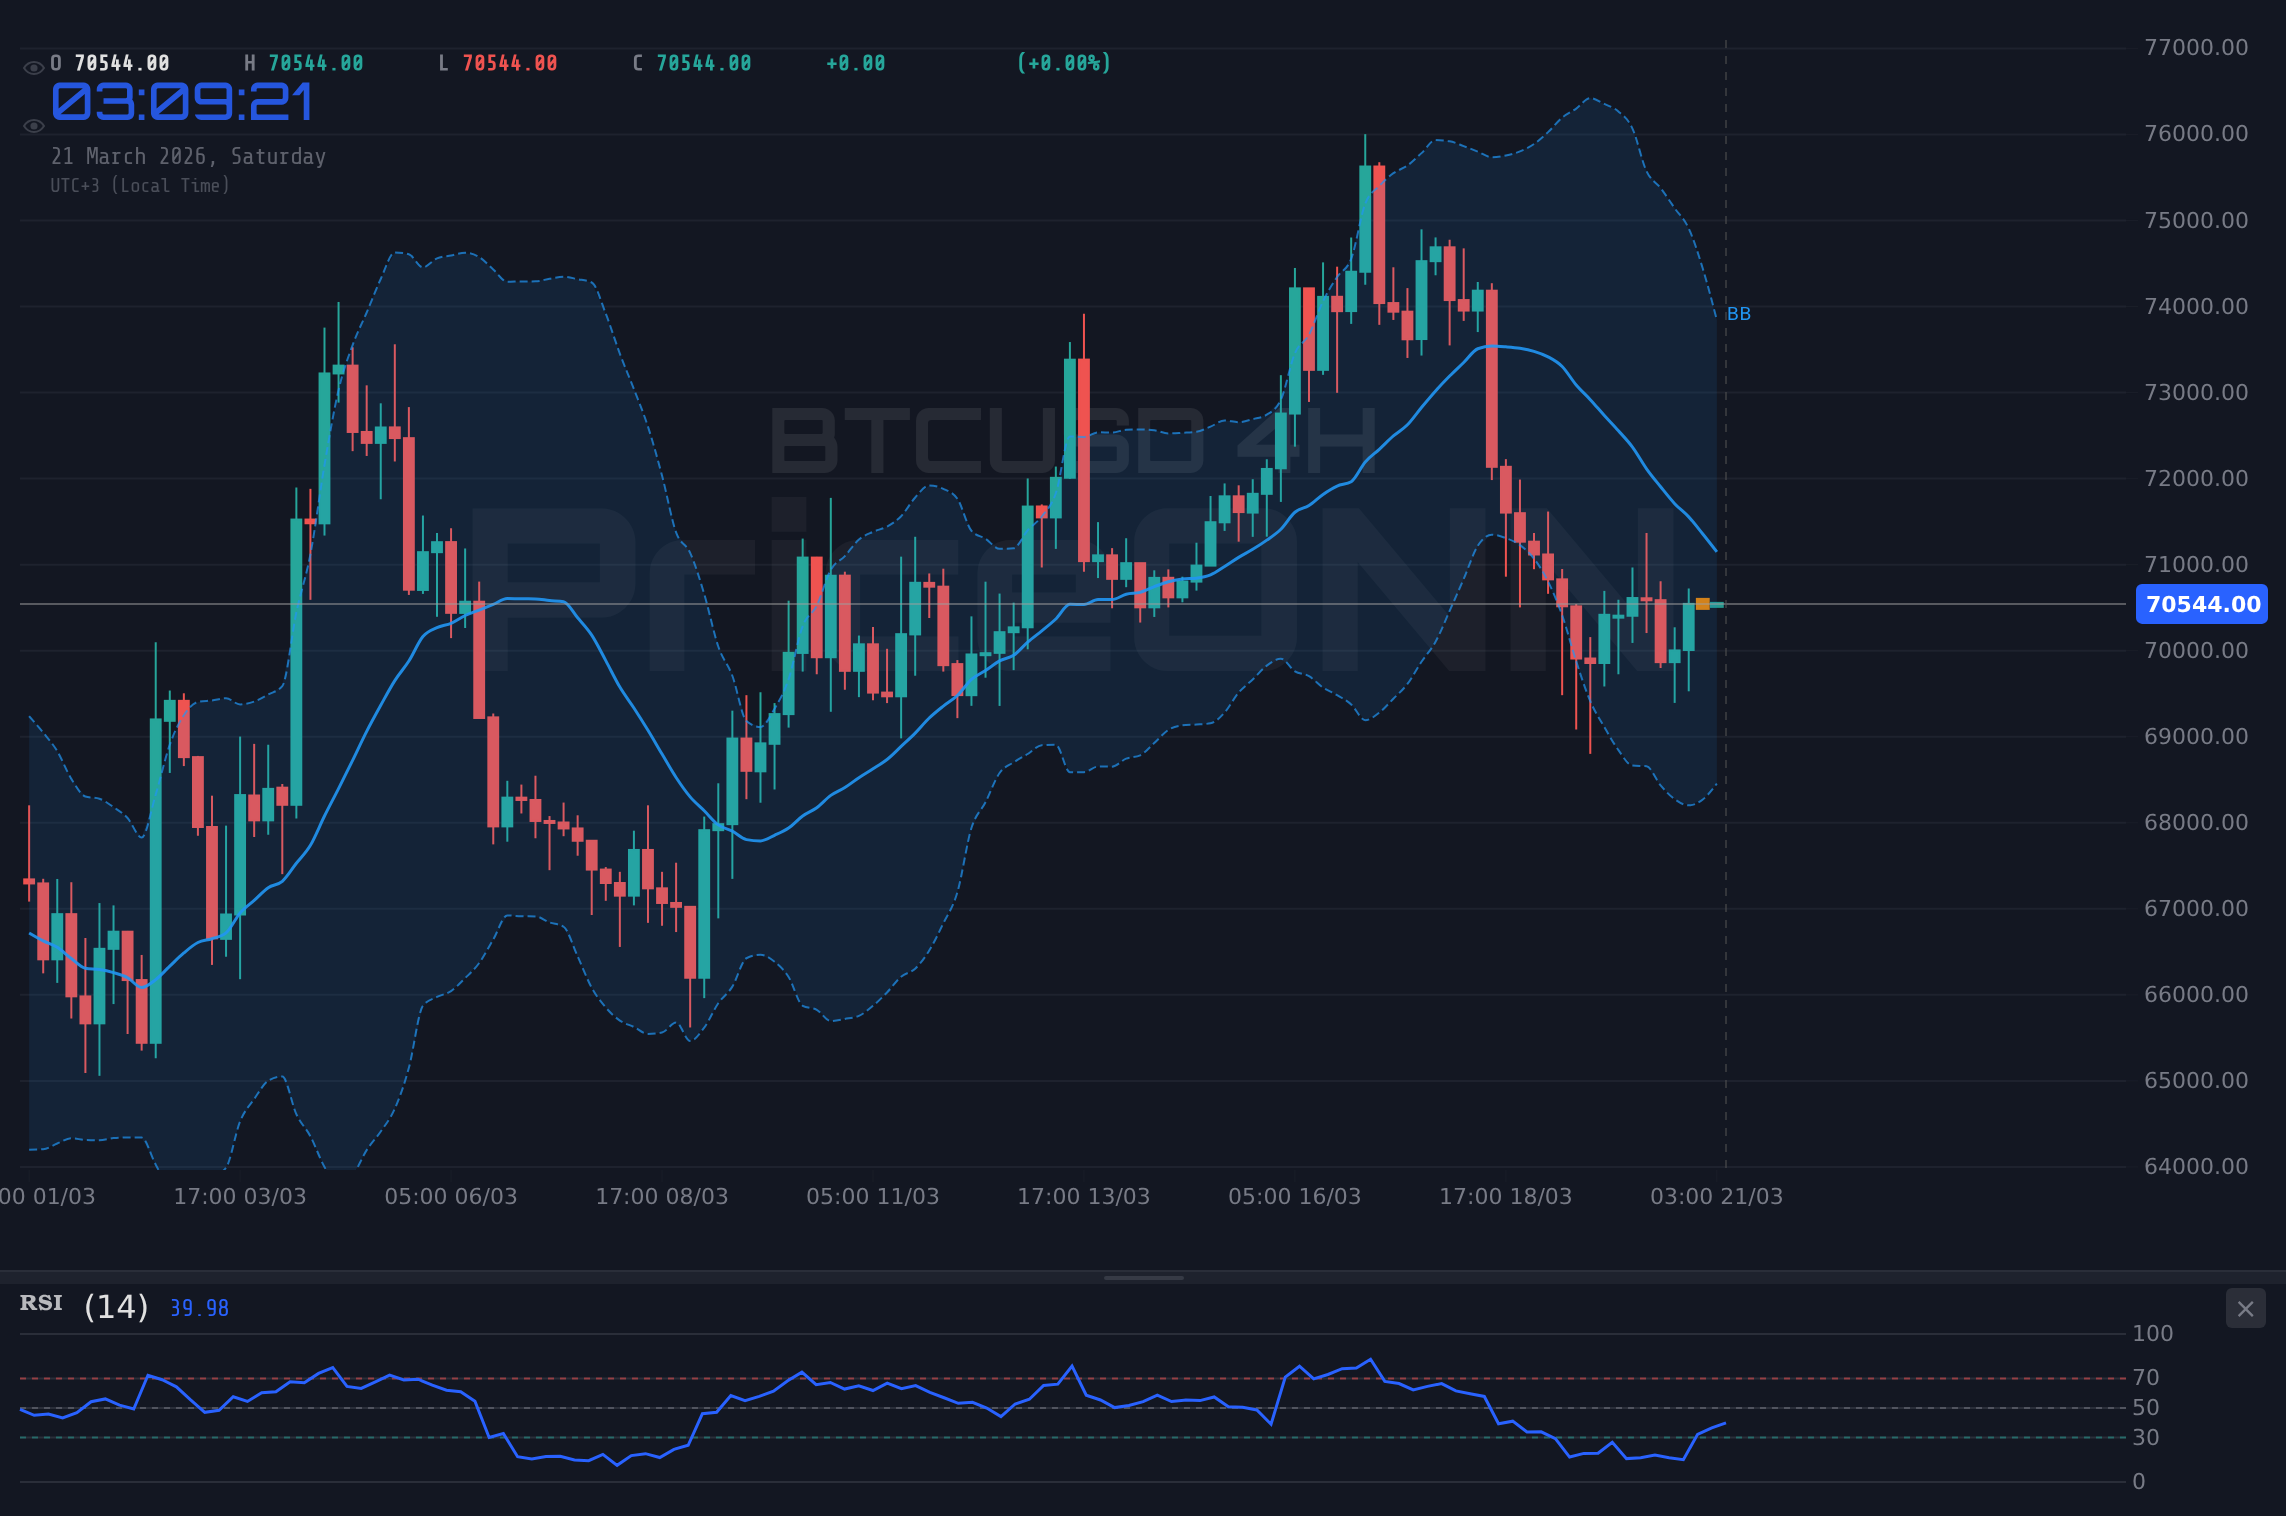
Bitcoin (BTCUSD) experienced a relatively quiet week, ultimately closing near its starting point around the $70,582.00 level. This period of consolidation followed a period of significant upward momentum, suggesting that the market is digesting recent gains and assessing the next direction. The daily chart shows the Relative Strength Index (RSI) hovering around 49.7, a reading that typically signifies a neutral market sentiment. This suggests neither extreme overbought nor oversold conditions are present, allowing for potential price discovery in either direction. However, the MACD histogram, while indicating positive momentum, remains below its signal line. This divergence implies that while there's underlying buying pressure, it hasn't yet translated into sustained upward movement, a common characteristic of markets consolidating before a significant move. The ADX at 23.82 on the daily timeframe indicates a moderate trend strength, neither a strong trending market nor a completely flat one, further underscoring the current indecisive phase.
From a price action perspective, the trading range observed was between a low of $69,393 and a high of $71,368. The inability of buyers to push decisively past the $71,000 mark and the subsequent failure to break decisively below the $69,000 support level highlight a market in equilibrium, albeit a tense one. This equilibrium is often a precursor to a significant breakout or breakdown, driven by catalysts such as macroeconomic data releases, regulatory news, or shifts in institutional sentiment. For scalpers, the tight intraday ranges around $70,582.00 might offer short-term opportunities, but the lack of strong directional momentum requires careful risk management. Swing traders, on the other hand, will be closely watching for a decisive breach of either the support at $68,939.67 or the resistance at $71,755.67 to initiate positions aligned with the emerging trend.
Long-term investors, meanwhile, may view this consolidation as a period of accumulation or a chance to re-evaluate their positions based on fundamental developments. The on-chain metrics provide a more granular view. Active addresses have remained relatively stable, suggesting that retail interest hasn't waned significantly, but also hasn't surged to indicate a new wave of adoption. Whale movements, though not showing massive outflows or inflows, have indicated strategic repositioning, with some large holders potentially accumulating at lower price points within the range. Exchange flows have been mixed, with some inflows suggesting potential selling pressure, but not at levels that would indicate panic or a major capitulation event. The overall picture is one of cautious optimism, with the market waiting for a clearer signal.
Technical Landscape: Indicators and Price Action
Delving deeper into the technicals, the daily chart for BTCUSD presents a mixed but cautiously optimistic picture. The RSI(14) at 49.7 is a key level to watch. Readings below 50 generally indicate bearish momentum, but a value so close to the midpoint suggests a lack of strong downward conviction. Historically, RSI values in this zone have often preceded significant trend changes. If the RSI begins to climb above 50, it would signal a shift towards bullish momentum, potentially targeting higher resistance levels. Conversely, a sustained drop below 40 would confirm strengthening bearish sentiment. The MACD, a trend-following momentum indicator, shows a histogram that is positive but below the signal line on the daily chart. This suggests that while upward momentum exists, it is currently being suppressed. A bullish crossover, where the MACD line crosses above the signal line, would be a crucial buy signal, especially if accompanied by increasing volume. The current negative momentum, however, means that any upward move needs to be monitored closely for confirmation.
The Stochastic Oscillator, which measures the speed of price changes, is currently showing %K at 28.33 and %D at 64.33 on the daily timeframe. This reading is in the oversold territory (typically below 20), but the fact that %K is below %D presents a bearish signal, indicating that the downward momentum is still dominant in the short-term. However, a bullish crossover here, with %K rising above %D and both moving out of the oversold zone, could signal a potential bottoming formation. This would be a critical sign for swing traders looking for entry points. The ADX (Average Directional Index) at 23.82 on the daily chart indicates a moderate trend. An ADX value above 25 typically signifies a strong trend, while values below 20 suggest a weak or non-trending market. The current reading implies that the market is not yet in a strong directional trend, which aligns with the consolidation observed. However, if the ADX starts to climb significantly, it would signal the beginning of a more pronounced move, either up or down, depending on other indicators.
On the 4-hour timeframe, the picture becomes slightly more bearish in the short term, with the RSI at 43.12 and the MACD histogram below its signal line, indicating negative momentum. The Stochastic Oscillator %K (51.35) is above %D (47.57), which is a bullish signal within this timeframe, suggesting a potential short-term bounce. However, the ADX at 32.45 on the 4-hour chart indicates a strong downward trend in this shorter timeframe. This conflict between different timeframes - a potential short-term bullish signal on the Stochastic versus a strong bearish trend on the ADX and MACD - is characteristic of choppy, range-bound markets. It highlights the need for traders to be highly selective and manage risk meticulously. For scalpers, the intraday fluctuations might offer opportunities, but the conflicting signals across timeframes suggest a higher degree of caution is warranted.
Correlation Analysis: DXY, Equities, and Oil's Influence
The performance of BTCUSD cannot be analyzed in isolation; its correlation with broader market assets, particularly the US Dollar Index (DXY), major equity indices like the S&P 500 and Nasdaq, and crude oil prices, provides crucial context. Currently, the DXY is showing a strong upward trend on the daily timeframe, with an ADX of 34.64 and RSI at 58.15. Historically, a strengthening dollar often puts pressure on risk assets like Bitcoin, as it increases the cost of holding non-dollar denominated assets and signals a potential shift towards safer investments. With the DXY trading around 99.39, this inverse correlation is a significant factor to monitor. If the DXY continues to climb, it could act as a headwind for BTCUSD, potentially pushing it towards the lower end of its current range.
The major equity indices, S&P 500 and Nasdaq, have experienced significant pullbacks over the past week. The S&P 500 is down 1.21% on the day, trading at 6536.05, with a strong bearish trend indicated by its daily ADX of 44.59. Similarly, the Nasdaq has fallen 1.65% to 23992.13, also showing a strong bearish trend on the daily chart. This broader market weakness, often driven by inflation concerns or geopolitical tensions, typically correlates with a decline in risk appetite. Bitcoin, often considered a risk-on asset, tends to suffer during such periods. The current correlation suggests that a continued selloff in equities could drag BTCUSD lower, potentially testing its key support levels. The fact that BTCUSD is consolidating while equities are falling might indicate a temporary decoupling, but this divergence is unlikely to persist indefinitely.
Crude oil prices, particularly Brent crude trading at $112.79 with a very strong daily uptrend (ADX 65.23), serve as a proxy for inflation expectations and geopolitical risk. A surge in oil prices often signals rising inflation, which can complicate central bank policy decisions and increase market uncertainty. While higher oil prices might indirectly benefit Bitcoin through inflation hedging narratives, the immediate impact is often negative if it fuels fears of aggressive monetary tightening. The current environment, where oil prices are soaring amidst geopolitical tensions, adds another layer of complexity. This combination of a strong dollar, falling equities, and rising oil prices creates a challenging backdrop for risk assets, making the $70,582.00 level for BTCUSD a critical point of observation rather than a clear buy signal.
On-Chain Metrics and Crypto Ecosystem Developments
Beyond price action and macro correlations, the underlying health of the Bitcoin network, as reflected in on-chain metrics, provides vital insights. Active addresses, a measure of network usage, have remained relatively stable throughout the consolidation phase. This indicates sustained interest from the user base, but not the explosive growth often seen during bull market frenzies. A significant increase in active addresses could signal renewed retail or institutional interest, potentially driving price higher. Conversely, a sharp decline would suggest waning engagement and could precede further price weakness. Whale movements are also closely monitored. While there haven't been massive, sustained outflows from whale wallets to exchanges, suggesting a lack of immediate selling pressure from large holders, there have been some strategic movements. These movements could indicate accumulation at current levels or preparation for future market action. Tracking the balance of BTC on exchanges provides a real-time gauge of selling pressure; a consistent decrease in exchange balances generally supports a bullish outlook, while significant inflows can signal an increased risk of selling.
The broader cryptocurrency ecosystem is also evolving, with developments in Decentralized Finance (DeFi) and Non-Fungible Tokens (NFTs) playing a role in Bitcoin's narrative. The recent launch of 'SlowFi' protocols like OP_NET directly on Bitcoin's blockchain, without relying on bridges or wrapped tokens, represents a significant step towards native Bitcoin DeFi. This innovation could potentially increase Bitcoin's utility and demand, driving value beyond its role as a store of value. However, the adoption and scalability of these solutions remain to be seen. Regulatory news continues to be a critical factor. Any developments regarding the approval of new Bitcoin ETFs, clarification on crypto taxation, or pronouncements from major regulatory bodies can trigger significant price volatility. For instance, the recent news about Gemini facing a lawsuit and potential regulatory scrutiny in other jurisdictions, while not directly impacting Bitcoin's core technology, adds to the overall uncertainty in the crypto space and can influence investor sentiment. The ongoing institutional adoption trend, evidenced by companies like Maestro launching mining-backed credit markets, suggests a maturing ecosystem, but the market remains sensitive to any regulatory headwinds.
Bitcoin Dominance, the percentage of the total cryptocurrency market capitalization held by Bitcoin, is another key metric. Currently, Bitcoin's dominance has been fluctuating, often acting as a barometer for broader market sentiment. When Bitcoin dominance rises, it typically suggests that investors are favoring the perceived safety and liquidity of Bitcoin over altcoins. Conversely, a declining dominance might indicate increased risk appetite, with capital flowing into altcoins in search of higher returns. Understanding this dynamic is crucial for assessing the overall health of the crypto market. The correlation between Bitcoin and major altcoins like Ethereum (ETHUSD), which is trading around $2,147.84, also provides context. While they often move in tandem, divergences can signal shifts in market leadership. The current mixed signals across these on-chain and ecosystem indicators reinforce the idea that BTCUSD is in a holding pattern, awaiting clearer catalysts.
Trading Scenarios and Key Levels to Watch
Given the current technical and fundamental backdrop, several scenarios could unfold for BTCUSD. The most immediate scenario to watch revolves around the $70,582.00 price point. A decisive daily close above this level, supported by increasing volume and positive MACD signals, could signal the resumption of the upward trend. In this bullish scenario, the first target would be the resistance at $71,755.67, followed by a more significant push towards $73,094.33. The invalidation for this scenario would be a close back below $69,393, indicating that the bullish momentum was a false breakout.
Conversely, a breakdown below the critical support level of $68,939.67 presents a bearish scenario. This level has acted as a floor multiple times and a sustained break below it, especially on high volume and with bearish confirmation from indicators like a falling RSI and MACD crossover, would suggest a deeper correction. The immediate targets in this case would be $67,462.33, followed by a more substantial move towards $66,123.67. The invalidation for this bearish thesis would be a swift recovery back above $68,939.67, suggesting the breakdown was a liquidity grab.
A neutral or consolidation scenario remains highly probable given the current indecisive signals across multiple timeframes. In this case, BTCUSD could continue to trade within the established range, potentially oscillating between the support at $68,939.67 and resistance at $71,755.67. This sideways movement might continue until a significant catalyst emerges. During such periods, traders might focus on shorter-term opportunities within the range, but the risk of a sudden breakout or breakdown remains elevated. The ADX at 23.82 on the daily chart supports this view, indicating a lack of strong trending conditions. Patience will be key for traders, waiting for a clear directional bias to emerge before committing significant capital.
Bearish Scenario: The Breakdown Below Support
55% ProbabilityBullish Scenario: Breaking the Consolidation Highs
30% ProbabilityNeutral Scenario: Range-Bound Trading Continues
15% ProbabilityHistorical Context and Long-Term Perspective
Looking back at Bitcoin's history, periods of consolidation around significant price levels have often preceded major moves. The current situation around $70,582.00 is reminiscent of previous consolidation phases where the market digested substantial gains before embarking on new rallies or undergoing significant corrections. For instance, after the 2021 bull run, Bitcoin experienced several months of sideways trading between $30,000 and $40,000. During that period, on-chain metrics showed shifts in holder behavior, and the network continued to develop, laying the groundwork for the subsequent recovery. The current consolidation, occurring after a rapid ascent, suggests a similar phase of market recalibration. The resilience of the $68,939.67 support level is particularly noteworthy. Historically, such levels, when tested multiple times and holding firm, often become strong foundations for future price appreciation. However, a decisive break below these levels can trigger a cascade of sell orders as technical traders and automated systems react.
The influence of macroeconomic factors on Bitcoin's long-term trajectory cannot be overstated. The narrative surrounding Bitcoin as a potential inflation hedge or a digital gold alternative is constantly being tested against its correlation with risk assets. When central banks globally adopt accommodative monetary policies (low interest rates, quantitative easing), risk assets, including Bitcoin, tend to perform well. Conversely, periods of monetary tightening, characterized by rising interest rates and a strengthening dollar, often create headwinds. The current environment, marked by persistent inflation concerns and the Federal Reserve's policy stance, presents a complex challenge. While some argue that Bitcoin's fixed supply makes it an ideal hedge against inflation, its price action has often mirrored that of high-growth tech stocks, reacting more to liquidity conditions and risk sentiment than to inflation itself. This duality means that long-term investors must consider both the cryptocurrency's unique properties and its behavior within the broader financial ecosystem.
Furthermore, the concept of Bitcoin halving events, which periodically reduce the rate at which new Bitcoins are created, has historically been a significant catalyst for bull markets. The next halving is anticipated to occur soon, and the market is likely pricing in some of its potential effects. While the immediate price impact of halvings can be debated, the reduction in supply typically leads to increased scarcity, which, coupled with sustained or growing demand, can drive prices higher over the medium to long term. Understanding this supply-side dynamic is crucial for long-term investors who believe in Bitcoin's scarcity-driven value proposition. The interplay between this programmed scarcity, evolving demand from institutional and retail investors, and the broader macroeconomic climate creates a dynamic landscape for Bitcoin's long-term price trajectory.
Key Takeaways for Different Trader Types
For scalpers operating on the 1-hour charts, the current environment around $70,582.00 presents a challenge due to low volatility and conflicting signals. The Stochastic Oscillator on the 1H chart shows a bullish signal (%K above %D), but the ADX at 16.99 indicates a weak trend. This suggests that short-term bounces might occur, but they are likely to be capped by resistance levels like $70,943, and any dips could find support near $70,365. Scalpers should focus on tight risk management, small position sizes, and quick exits, aiming to capture small gains from intraday fluctuations rather than expecting sustained moves. The key is to avoid getting caught in choppy price action and to wait for a clearer directional bias before increasing exposure.
Swing traders, who typically operate on 4-hour and daily charts, will be looking for clearer signals to enter positions. The current indecision, with the daily RSI at 49.7 and the ADX at 23.82, suggests waiting for a decisive breakout or breakdown. A confirmed daily close above $71,755.67 would be a strong bullish signal, potentially targeting $73,094.33 and beyond. Conversely, a break below the crucial support at $68,939.67 could signal a larger correction, with targets around $67,462.33. The conflicting signals between the 4H Stochastic (bullish) and the daily ADX (moderate trend) highlight the importance of waiting for confluence across multiple indicators and timeframes before committing. Patience is paramount; forcing trades in a range-bound market often leads to losses.
Long-term investors, focusing on the daily and weekly charts, will likely view this consolidation phase around $70,582.00 as an opportunity. The underlying bullish trend, supported by positive MACD momentum on the daily chart and the historical significance of the $68,939.67 support level, suggests that this could be a period of accumulation. While macroeconomic headwinds like a strengthening DXY and falling equities present risks, the long-term narrative of Bitcoin as a scarce digital asset and potential inflation hedge remains intact. Developments in Bitcoin's DeFi ecosystem, such as the emergence of native 'SlowFi' protocols, could also contribute to long-term demand. Investors should focus on the fundamental strength of the network, the progress of institutional adoption, and the potential impact of future halving events, rather than getting overly concerned with short-term price fluctuations. Dollar-cost averaging during periods of consolidation can be a prudent strategy for those with a long-term horizon.
Market Sentiment and Geopolitical Undercurrents
Market sentiment surrounding BTCUSD appears to be cautiously optimistic, leaning towards a bullish bias despite the recent consolidation. The fact that Bitcoin has held its ground around $70,582.00 while major equity indices have seen significant declines suggests a degree of resilience. This resilience could be attributed to the ongoing narrative of Bitcoin as a potential safe haven or inflation hedge, although its correlation with risk assets often challenges this notion. The recent tumble in gold prices below $4,500, despite escalating geopolitical tensions, is a perplexing development. Typically, gold rallies during times of geopolitical uncertainty as a safe-haven asset. Its decline, coupled with the strengthening DXY, suggests that either the market is pricing in a resolution to conflicts, or that higher interest rate expectations are overshadowing geopolitical risks. This unusual behavior in gold warrants attention, as any shift could impact Bitcoin's safe-haven appeal.
The geopolitical landscape remains a significant source of uncertainty. Escalating tensions in the Middle East, as reported by various news outlets, continue to be a backdrop for market activity. While oil prices have surged, reflecting these tensions, the impact on risk assets like Bitcoin has been mixed. Some analysts suggest that rising oil prices, indicative of potential inflation, could indirectly benefit Bitcoin as an inflation hedge. However, the more dominant narrative often sees Bitcoin behaving as a risk-on asset, susceptible to sell-offs when broader market sentiment turns negative due to geopolitical fears. The correlation between Bitcoin whales moving significant amounts of capital ($100M+ reported recently) amidst this turmoil and the oil price spike adds another layer of complexity. These movements could be a reaction to perceived market instability or a strategic repositioning ahead of anticipated volatility.
Regulatory developments also continue to play a crucial role in shaping market sentiment. While there haven't been major breakthroughs or setbacks specifically for Bitcoin this past week, the ongoing scrutiny of crypto exchanges and financial products remains a factor. News like Gemini facing lawsuits and potential regulatory actions in certain jurisdictions serves as a reminder of the regulatory risks inherent in the crypto space. As institutional adoption grows, regulatory clarity becomes increasingly important. Any positive regulatory news, such as the approval of new Bitcoin-related financial products or clearer guidelines for exchanges, could provide a significant boost to market sentiment and potentially fuel further price appreciation. Conversely, unfavorable regulatory actions could dampen enthusiasm and lead to increased selling pressure.
Frequently Asked Questions: BTCUSD Analysis
What happens if BTCUSD breaks decisively below the $68,939.67 support level?
A sustained daily close below $68,939.67, confirmed by high volume and negative momentum from indicators like RSI and MACD, would invalidate the current bullish bias. This could trigger a sell-off targeting $67,462.33, and potentially extend to $66,123.67 as bears take control.
Should I buy BTCUSD at current levels around $70,582.00 given the mixed technical signals?
Caution is advised. While the daily MACD shows positive momentum, the RSI at 49.7 and daily ADX at 23.82 suggest indecision. A more prudent approach for swing traders would be to wait for a clear breakout above $71,755.67 or a confirmed test and hold of the $68,939.67 support.
Is the RSI at 49.7 a sell signal for BTCUSD on the daily chart?
An RSI of 49.7 is not a definitive sell signal; it indicates neutral momentum. Readings below 50 generally lean bearish, but values so close to the midpoint suggest a lack of strong conviction. A confirmed drop below 40 would be a stronger bearish indicator, while a move above 50 would signal strengthening bullish sentiment.
How will the strengthening DXY around 99.39 affect BTCUSD this week?
A strengthening US Dollar Index (DXY) typically puts downward pressure on risk assets like Bitcoin due to increased holding costs and a shift towards safer assets. If the DXY continues its upward trend, it could act as a headwind for BTCUSD, potentially pushing it towards the lower end of its current trading range near $68,939.67.
The market is currently at a critical juncture. While the underlying sentiment remains cautiously bullish, the technical indicators present a mixed picture, and macroeconomic headwinds persist. The consolidation around $70,582.00 is a testament to the market's uncertainty. For scalpers, short-term opportunities may exist within the range, but require stringent risk management. Swing traders should await a decisive breakout or breakdown, confirming the next directional move. Long-term investors may view this as a potential accumulation phase, focusing on the fundamental drivers and long-term scarcity narrative. The interplay between technical levels, on-chain data, and macroeconomic factors will dictate Bitcoin's path forward. Patience and discipline remain the most valuable tools for navigating this complex market environment.
Technical Outlook Summary
| Indicator | Value | Signal | Interpretation |
|---|---|---|---|
| RSI (14) | 49.7 | Neutral | Lack of conviction from either bulls or bears. |
| MACD Histogram | -0.23 | Bullish Momentum (Suppressed) | Underlying buying pressure, but not yet confirmed. |
| Stochastic | 28.33 / 64.33 | Bearish Signal (Oversold) | %K < %D in oversold zone; suggests downward momentum persists. |
| ADX | 23.82 | Moderate Trend | Market not in a strong directional trend; consolidation likely. |
| Bollinger Bands | Middle Band | Watch | Price is near the middle band, indicating a potential pivot point. |
Key Levels for BTCUSD
Track markets in real-time
AI-powered analysis, technical indicators and real-time price data.
Join Our Telegram Channel
Breaking market news, AI analysis and trading signals instantly.
Join Channel