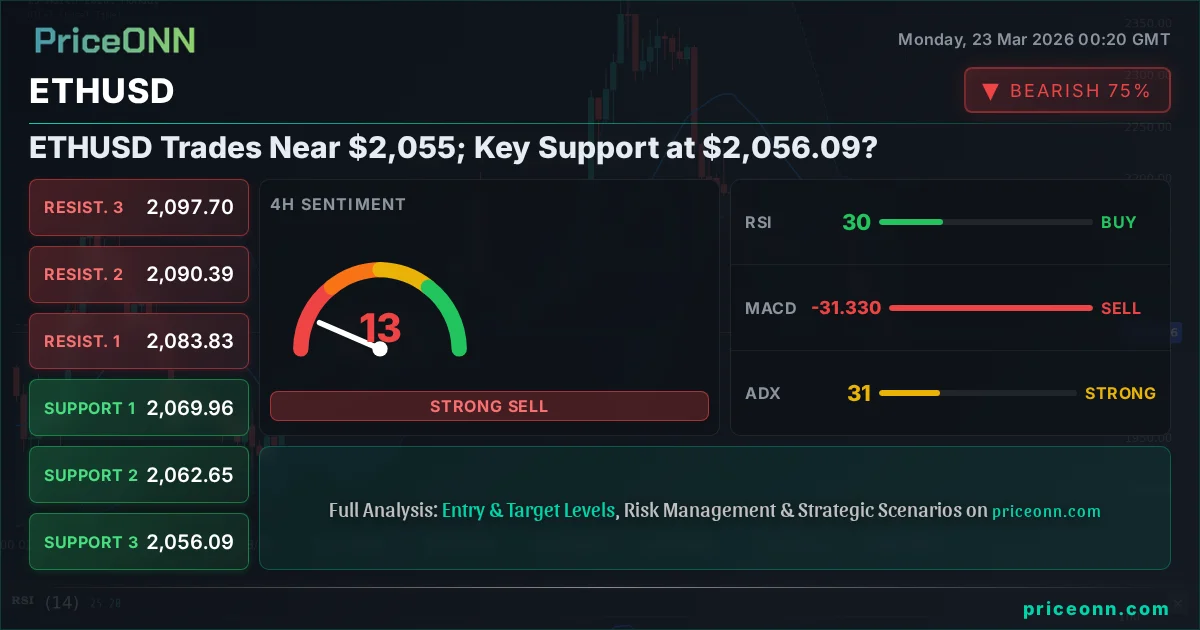
ETHUSD Trades Near $2,055; Key Support at $2,056.09?
ETHUSD is trading near $2,055.12, with significant technical indicators pointing towards potential downside risk. Key support levels are being tested.
The cryptocurrency market is in a precarious position, and ETHUSD is currently at the heart of the storm, trading precariously close to $2,055.12. Having shed a significant 4.46% in the last 24 hours, the second-largest digital asset by market capitalization is flashing warning signs that traders cannot afford to ignore. The current price action, coupled with a confluence of bearish technical indicators across multiple timeframes, suggests that the path of least resistance is currently to the downside. This analysis delves into the critical technical levels, the underlying sentiment, and the potential scenarios that could unfold for Ether in the coming days.
- ETHUSD is trading at $2,055.12, down 4.46% on the day, with a strong bearish trend indicated by ADX at 44.17 on the 1H chart.
- Key support levels to watch are $2,056.09 (4H), $2,055.12 (current price), and $2,038.97 (1H), while resistance looms at $2,097.70 (4H) and $2,105.77 (1H).
- RSI is hovering in oversold territory (29.7 on 4H, 34.85 on 1H), suggesting potential for a short-term bounce, but MACD and Stochastic indicators remain bearish on multiple timeframes.
- The broader market sentiment, influenced by DXY's strength and equity market declines, is creating headwinds for risk assets like ETHUSD.
The recent price action in ETHUSD paints a concerning picture for bulls. The sharp 4.46% decline from its recent highs, bringing the price down to $2,055.12, is not an isolated incident but rather a continuation of a broader trend that has seen the asset struggle to maintain upward momentum. On the 1-hour chart, the Average Directional Index (ADX) at 44.17 underscores a strong prevailing trend, and currently, that trend is decidedly downwards. This isn't just a minor dip; it's a clear signal that sellers are in firm control, pushing the price action with conviction. The Daily chart, while showing a neutral overall trend strength of 50%, still displays a bearish momentum from its MACD readings and a weakening RSI, indicating that the underlying pressure might be building for a more significant move lower.
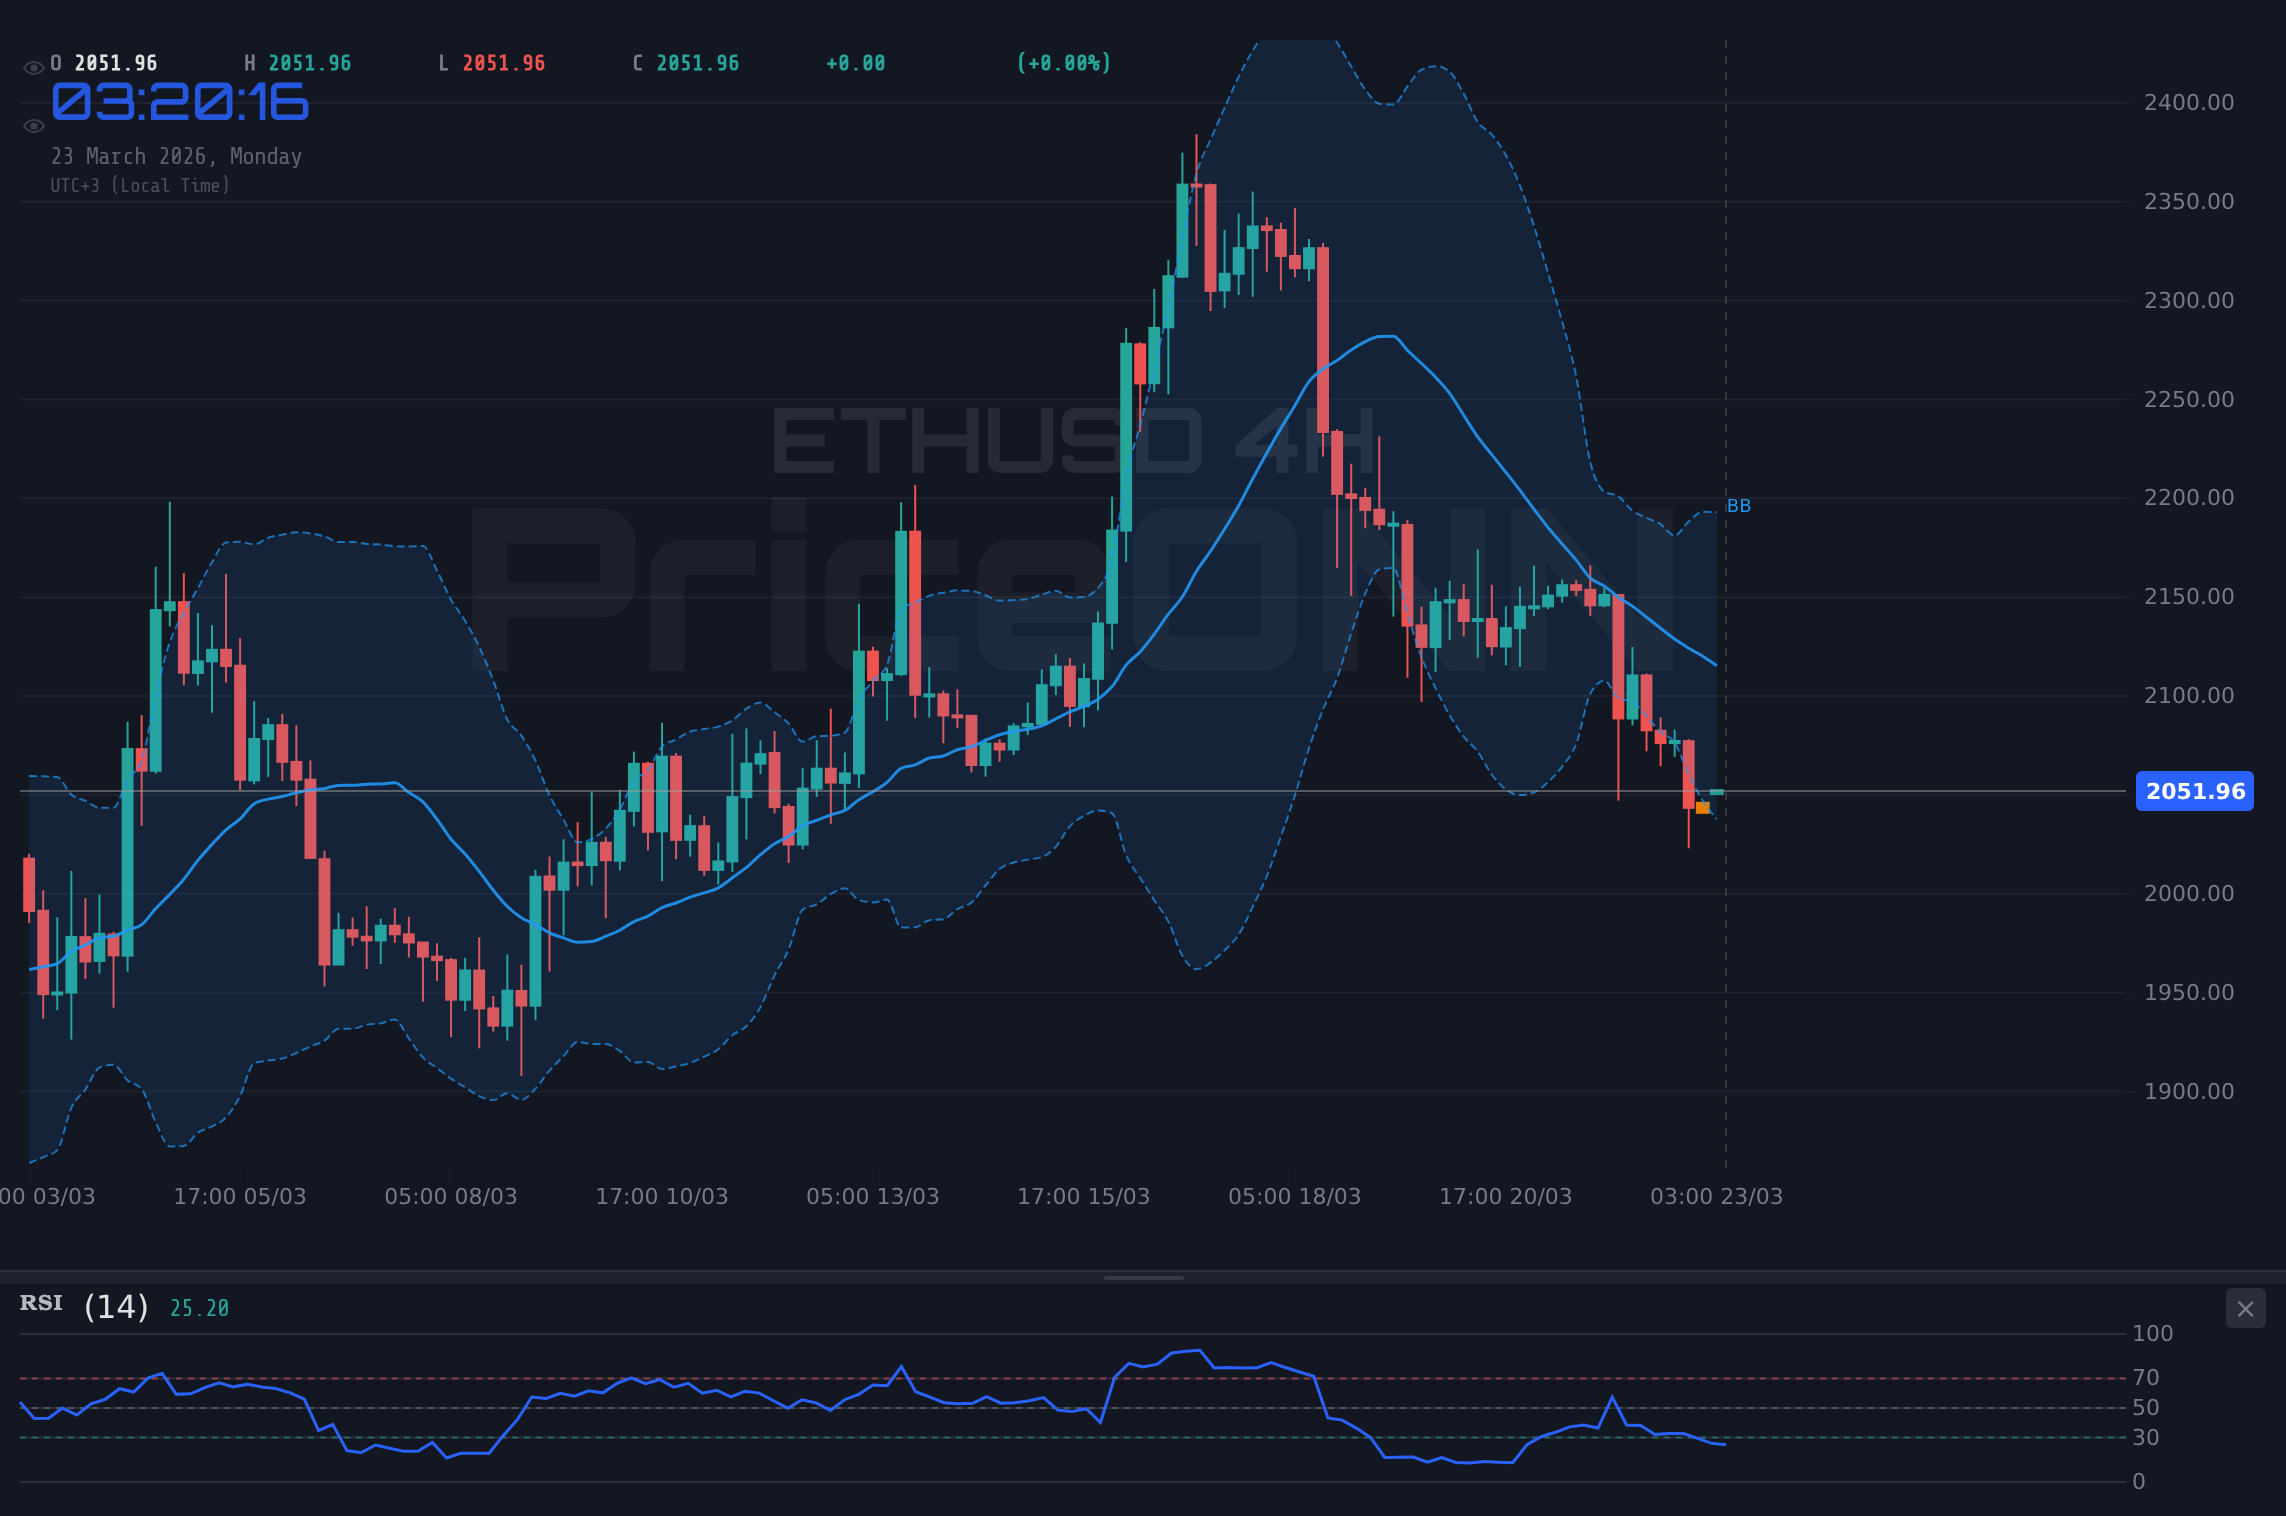
Looking at the 4-hour timeframe, the situation appears even more dire for Ether. The trend is firmly established as bearish with a 90% strength, and the Relative Strength Index (RSI) at 29.7 is deep in oversold territory. While oversold conditions often precede a bounce, the persistent negative momentum indicated by the MACD, which is trading below its signal line, and the bearish crossover on the Stochastic Oscillator (K=24.1, D=38.61) suggest that this oversold state could persist or even deepen before any substantial recovery materializes. The lower Bollinger Band is being breached, a classic sign of strong selling pressure. This 4-hour chart is a critical watch for short-term traders, as it often leads the daily sentiment.
The 1-hour technicals echo the bearish sentiment seen on the 4-hour chart, though with slightly less conviction. The ADX at 44.17 confirms a strong trend, and the MACD's negative momentum is a clear warning. However, the Stochastic Oscillator shows a potential bullish divergence with %K crossing above %D, and the RSI at 34.85, while low, is not as deeply oversold as its 4-hour counterpart. This could suggest that the immediate selling pressure might be easing, potentially leading to a brief consolidation or a minor upward correction. Nevertheless, the overarching trend remains down, and any upward movement should be viewed with extreme caution, likely presenting more of a trading opportunity for the bears to re-enter at better levels rather than the start of a sustained rally.
Navigating the Current Price Action: What Do the Indicators Say?
The confluence of technical signals across different timeframes paints a consistent picture of bearish pressure on ETHUSD. On the 1-hour chart, the MACD histogram is negative, reinforcing the downward momentum. Similarly, the 4-hour MACD is also in negative territory, with the MACD line below the signal line, a classic bearish signal. The daily MACD, despite the overall neutral trend strength, also shows negative momentum. This consistent bearish reading across the MACD indicator is a strong signal that sellers are dominating the market sentiment.
The Stochastic Oscillator provides a mixed, yet predominantly bearish, outlook. While the 1-hour %K line has crossed above %D, indicating a potential short-term bullish divergence, the 4-hour and daily Stochastic readings are decidedly bearish, with %K below %D and deep in oversold territory. This suggests that any short-term upward moves might be met with selling pressure as the broader bearish trend reasserts itself. The key here is to watch for confirmation; a sustained move above the middle Bollinger Band on the 4-hour chart would be needed to challenge the bearish Stochastic signal.
The RSI is another indicator flashing warning signs, albeit with a potential for a short-term reprieve. On the 4-hour chart, the RSI at 29.7 is deep in oversold territory, historically a zone where prices tend to find a bottom. However, as noted, oversold conditions can persist in strong downtrends. The 1-hour RSI at 34.85 and the daily RSI at 46.23 also suggest that the asset is not in overbought territory, leaving room for further price discovery to the downside before reaching extreme oversold conditions on the longer timeframe. The daily RSI, in particular, is hovering around the 40-50 level, a zone that often indicates a lack of clear direction but can easily tip into bearish territory.
Correlation with Broader Markets: DXY and Equities
The performance of ETHUSD cannot be viewed in isolation. Its correlation with broader market movements, particularly the US Dollar Index (DXY) and major equity indices like the S&P 500, is crucial. Currently, the DXY is showing a strong upward trend, particularly on the daily timeframe (92% strength), trading at 99.35. A strengthening dollar typically exerts downward pressure on risk assets, including cryptocurrencies, as it increases the cost of holding these assets for holders of other currencies and signals a potential shift towards safer investments. The fact that DXY is pushing higher while ETHUSD is falling is a textbook example of this inverse relationship.
The equity markets are also sending cautionary signals. The S&P 500 is down 1.8% today, trading at 6496.8, and the Nasdaq 100 has fallen 2.28% to 23836.88. Both indices are exhibiting strong bearish trends on their respective 1-hour and 4-hour charts. This broader risk-off sentiment in the equity markets often spills over into the cryptocurrency space. Investors tend to reduce their exposure to higher-risk assets like crypto when major stock indices are declining, fearing a wider economic slowdown or increased geopolitical tensions. This correlation suggests that until equities find a stable footing or begin to recover, ETHUSD may continue to face headwinds.
On-Chain Metrics and Ecosystem Developments
Beyond the charts, on-chain data and ecosystem developments offer further clues into ETHUSD's current predicament. While specific on-chain data like active addresses, whale movements, and exchange flows are not provided in the market data feed, general trends in the Ethereum ecosystem can be inferred. The recent exploit of the USR stablecoin, which saw it plummet by 86% to $0.14, while not directly impacting ETH, highlights the inherent risks and volatility within the broader crypto space. Such events can dampen overall market sentiment and lead to broader sell-offs as investors become more risk-averse.
Furthermore, developments in the DeFi and NFT sectors, while crucial for Ethereum's long-term health, might not be providing immediate support. If Total Value Locked (TVL) in DeFi protocols is stagnating or declining, or if NFT trading volumes are low, it indicates reduced activity and potentially less demand for ETH as gas fees might be less of a driver. Regulatory news, a constant factor in the crypto world, also plays a significant role. Any uncertainty or adverse developments regarding stablecoin regulation, ETF approvals (or rejections), or other crypto-related policies could further pressure ETHUSD. Without specific data on these fronts, it's prudent to assume that the current market environment is not conducive to positive fundamental catalysts for ETH.
Trade Scenarios: What Lies Ahead for ETHUSD?
Given the current technical setup and market correlations, several scenarios can be envisioned for ETHUSD. The prevailing bearish sentiment suggests that the most probable outcome involves further downside pressure. However, the oversold conditions on shorter timeframes cannot be entirely dismissed.
Bearish Scenario: Downside Momentum Continues
65% ProbabilityNeutral Scenario: Consolidation Around Current Levels
25% ProbabilityBullish Scenario: Short-Term Bounce from Oversold
10% ProbabilityThe bearish scenario appears to be the most likely, especially if ETHUSD fails to hold the crucial support level around $2,056.09. A break below this could trigger stop-loss orders, accelerating the decline towards the $2,005.57 mark. The 4-hour chart shows a support level at $2,056.09, and a breach of this would be a significant bearish signal. Resistance, on the other hand, is clearly defined on the 1-hour chart at $2,105.77, and a decisive move above this level would be required to invalidate the bearish outlook and open the door for a potential move towards $2,164.66 on the daily chart.
The Role of Central Banks and Macroeconomic Data
While the provided market data doesn't include specific central bank policy announcements or upcoming macroeconomic releases, their influence on ETHUSD cannot be overstated. The current strength of the DXY suggests that market participants might be anticipating hawkish signals from the Federal Reserve or other major central banks, or perhaps reacting to existing monetary policy stances. If upcoming economic data, such as inflation figures or employment reports, continue to indicate persistent inflation or a robust labor market, it could reinforce expectations of higher-for-longer interest rates. This would typically be bearish for risk assets like ETHUSD, as higher rates increase the cost of capital and reduce the present value of future earnings and growth prospects.
Conversely, any signs of dovishness from central banks, or data that suggests a cooling economy and inflationary pressures, could provide a much-needed boost to ETHUSD. However, given the current bearish technicals and the strength of the dollar, such a scenario seems less likely in the immediate short term. Traders will be closely watching any commentary from Fed officials for hints about future policy direction. The current market pricing, as reflected in the DXY's strength, seems to be leaning towards a more restrictive monetary policy environment, which would continue to cast a shadow over cryptocurrencies.
Conclusion: Patience and Risk Management are Key
The current technical landscape for ETHUSD is decidedly bearish, with multiple indicators pointing towards further downside. The price is trading below key support levels, momentum indicators are flashing red, and correlations with strengthening dollar and falling equities add to the negative sentiment. While oversold conditions on shorter timeframes might offer a temporary reprieve, the overall trend suggests caution is warranted.
Frequently Asked Questions: ETHUSD Analysis
What happens if ETHUSD breaks below the $2,056.09 support level?
A break below the $2,056.09 support on the 4-hour chart would likely trigger further selling pressure, potentially accelerating towards the $2,005.57 level. This would invalidate any short-term bullish divergence and reinforce the bearish trend.
Should I consider buying ETHUSD at current levels around $2,055.12 given the oversold RSI?
While the RSI is oversold on shorter timeframes, the overall bearish trend and negative MACD momentum suggest caution. A more prudent approach would be to wait for confirmation of a bottom, perhaps a clear hold above $2,072.37, before considering a long position.
Is the MACD histogram's negative momentum a strong sell signal for ETHUSD right now?
Yes, the negative MACD histogram across multiple timeframes indicates strong bearish momentum. While short-term bounces are possible, this signal suggests that selling pressure is dominant and any upward moves may be short-lived.
How will the strengthening DXY at 99.35 affect ETHUSD's price this week?
A strong DXY typically exerts downward pressure on risk assets like ETHUSD. This inverse correlation suggests that as long as the dollar remains strong, it will likely act as a headwind for Ether, potentially capping any rallies.
Track markets in real-time
AI-powered analysis, technical indicators and real-time price data.
Join Our Telegram Channel
Breaking market news, AI analysis and trading signals instantly.
Join Channel