ETHUSD Weekly Outlook: Navigating the $2,073.56 Level Amidst Bearish Wobble
ETHUSD faces a bearish wobble around $2,073.56. Technicals show oversold conditions on lower timeframes, but a strong downtrend persists. Next week's outlook depends on holding key support levels.
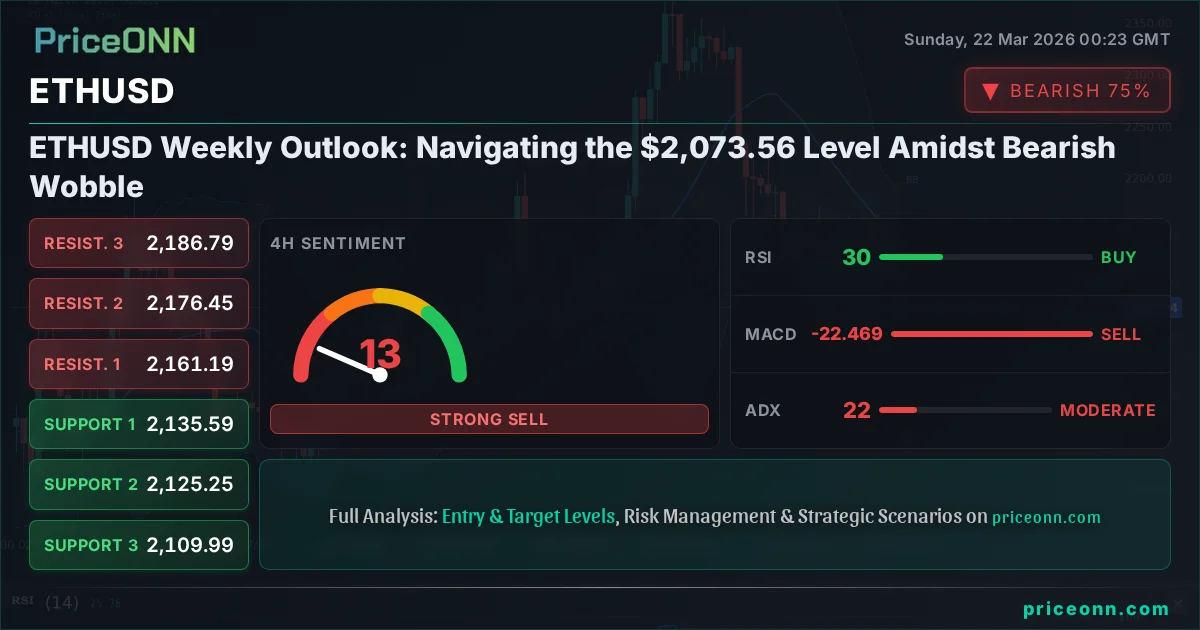
The cryptocurrency market, and particularly Ethereum (ETHUSD), has been experiencing a notable shift in sentiment this past week. As we close out the trading week, ETHUSD finds itself hovering precariously around the $2,073.56 mark. This level is more than just a price point; it represents a critical juncture where short-term bearish pressures are battling against oversold technical conditions. The past seven days have seen a decisive downturn, pushing ETHUSD into territory that demands close attention from traders and investors alike. While the daily chart suggests a neutral trend, the 1-hour and 4-hour timeframes are flashing strong sell signals, painting a picture of immediate bearish momentum. This dichotomy is where the real trading opportunities, and risks, lie for the upcoming week.
- ETHUSD is trading at $2,073.56, with 1H and 4H charts showing strong sell signals while the daily trend is neutral.
- Key support for ETHUSD is identified at $2,056.06 (daily), with immediate 1H support at $2,041.19. Breaking below these levels would confirm bearish continuation.
- RSI(14) on the 1H chart is at 19.73, indicating oversold conditions that could precede a bounce, but the ADX at 22.17 suggests a strong downtrend is in play.
- Geopolitical tensions and a strengthening US Dollar (DXY at 99.25) are creating headwinds for risk assets like ETHUSD, correlating with broader market sentiment seen in the S&P 500's decline.
The overarching narrative this week for ETHUSD has been one of cautious retreat. After a period of relative stability, the digital asset has succumbed to broader market pressures, including a strengthening US Dollar and a general risk-off sentiment that has gripped global financial markets. The DXY, or Dollar Index, is currently trading at 99.25, its upward momentum indicating a potential headwind for riskier assets. This correlation is not lost on traders; as the dollar strengthens, the cost of dollar-denominated assets like ETHUSD can appear higher for holders of other currencies, potentially dampening demand. Furthermore, the performance of traditional risk assets, such as the S&P 500 which has seen a notable decline of -1.2% to 6536.67, underscores this risk-off environment. When major stock indices falter, capital often seeks safer havens, pulling funds away from more speculative markets like cryptocurrencies.
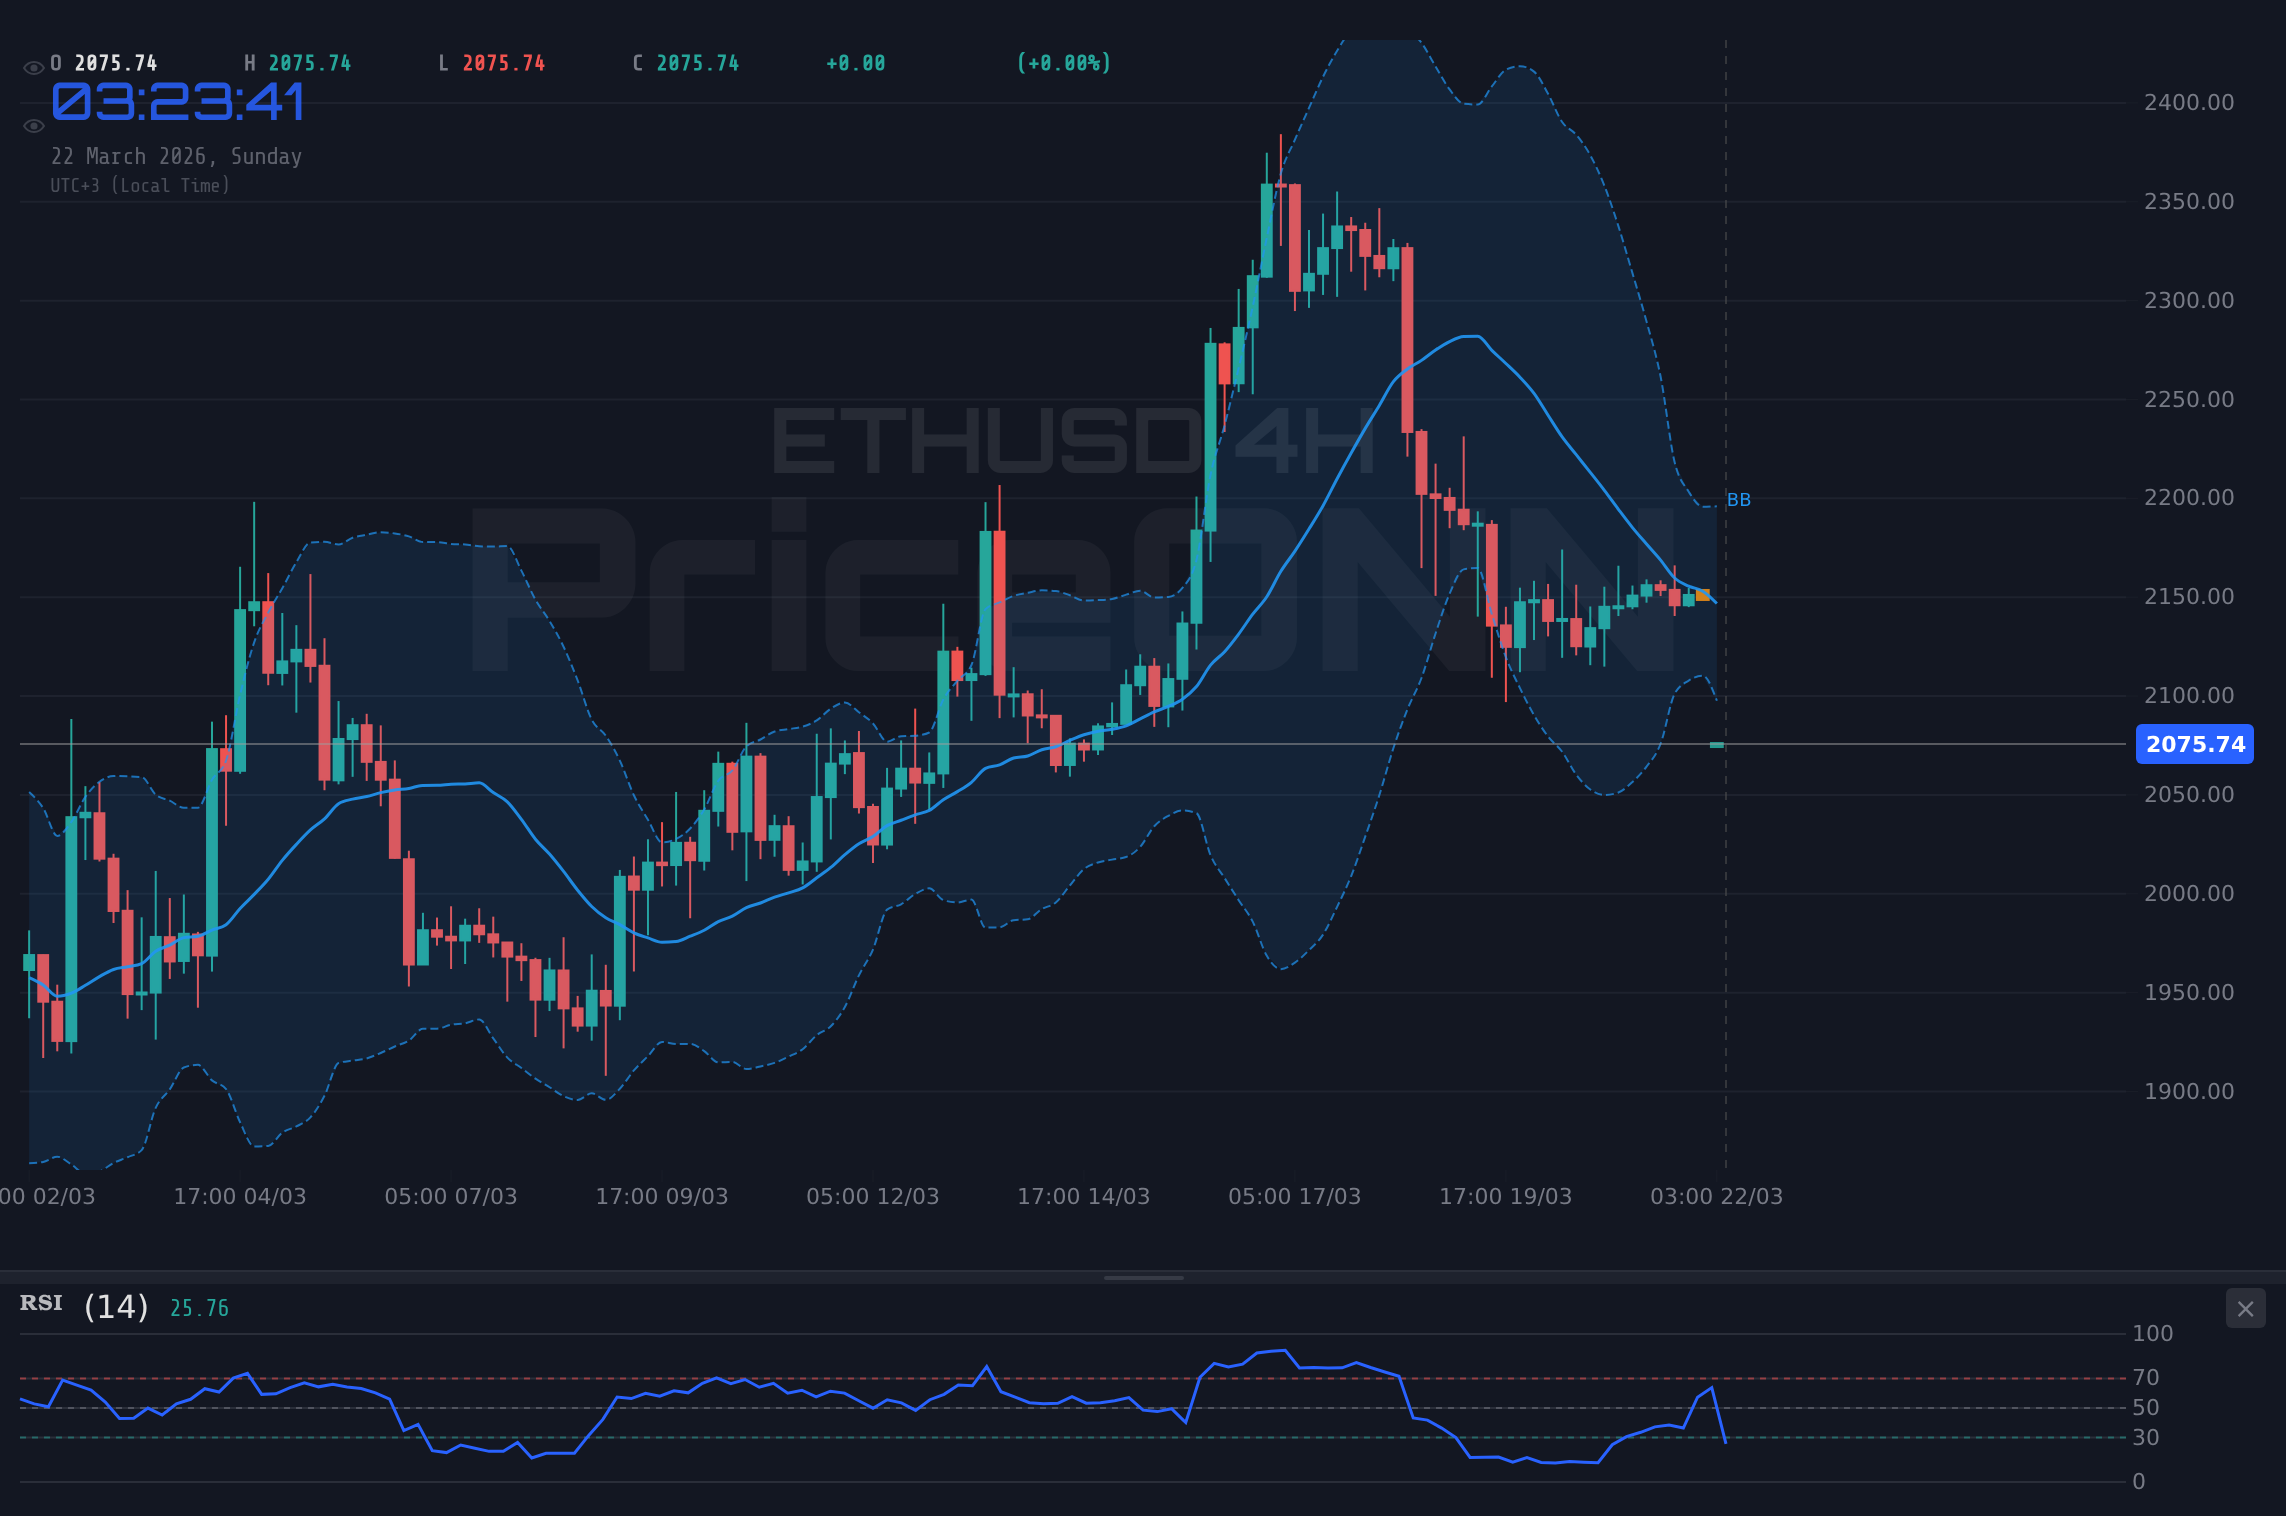
From a technical standpoint, the ETHUSD chart presents a complex picture, particularly when viewed across multiple timeframes. The 1-hour chart, which often captures short-term trading sentiment, is deeply oversold. An RSI(14) reading of 19.73 is a clear signal that sellers may have overextended themselves in the immediate term. Similarly, the Stochastic Oscillator, with %K at 10.85 and %D at 13.99, is firmly in oversold territory. On this timeframe, a bounce is technically plausible. However, this short-term picture is somewhat contradicted by the 4-hour and daily charts. The 4-hour ADX is at 22.17, suggesting a strong downtrend is active, even if momentum indicators are oversold on the shorter timeframe. The daily chart, while showing a neutral trend with an ADX of 22.5, still presents significant resistance levels far above the current price, indicating that any bounce might be short-lived unless fundamental catalysts emerge.
Let's delve deeper into the immediate technical landscape. The 1-hour chart shows support levels at $2,041.19, $2,015.31, and $2,008.85. A break below these could signal further downside pressure, potentially retesting the $2,000 psychological level. Resistance on this timeframe is seen at $2,074.86, $2,085.47, and $2,091.19. A decisive move above $2,074.86 would be the first sign of short-term bullish recovery, but confirmation would be needed from higher timeframes. The MACD on the 1-hour chart is also showing negative momentum, lurking below its signal line, which reinforces the immediate bearish bias despite the oversold oscillators. This suggests that while a short-term relief rally is possible, the overall trend remains under pressure.
Moving to the 4-hour timeframe, the picture becomes more concerning for bulls. The support levels here are slightly lower, starting at $2,109.99, then $2,085.47, and $2,073.56. Notice that our current price of $2,073.56 is itself a support level on this timeframe. A close below this could trigger further selling pressure towards the $2,056.06 daily support. Resistance on the 4-hour chart is located at $2,135.59, $2,145.75, and $2,150.31. The RSI(14) at 29.35 on this chart is also in oversold territory, but the ADX reading of 22.17 indicates a solid downtrend is in motion. The MACD is also negative, reinforcing the bearish sentiment. This suggests that the oversold conditions on the 1-hour chart might be a temporary reprieve within a larger downtrend, rather than the start of a significant reversal.
The daily chart provides the broader context. Here, ETHUSD is currently trading at $2,073.56, with support identified at $2,056.06, $2,031.47, and $2,015.31. Resistance levels loom higher, at $2,115.31, $2,145.75, and $2,174.56. The daily RSI at 47.5 is in the neutral zone, not yet indicating oversold or overbought conditions, but leaning towards bearish momentum. The MACD is positive, but its histogram is narrowing, hinting at fading bullish momentum. The ADX at 23.47 suggests a moderate trend, which, combined with the other indicators, suggests that while a strong downtrend isn't confirmed on the daily, the path of least resistance appears to be downwards. The Bollinger Bands are also trading below the middle band, reinforcing this bearish inclination. This neutral-to-bearish daily outlook means that any short-term bounces are unlikely to trigger a sustained rally without significant fundamental shifts.
Beyond the pure technicals, several fundamental factors are influencing ETHUSD's price action. The ongoing regulatory uncertainty surrounding cryptocurrencies continues to cast a shadow. While there have been positive developments, such as the potential for spot ETH ETFs and ongoing discussions about staking, regulatory bodies globally remain cautious. Any negative news or pronouncements from regulators can trigger sharp sell-offs, as seen this week. Furthermore, the broader macroeconomic environment, characterized by inflation concerns and central bank policy shifts, plays a crucial role. The Federal Reserve's stance on interest rates, for instance, directly impacts the cost of capital and risk appetite, influencing flows into and out of assets like Ethereum. The recent news about the US Dollar Index (DXY) strengthening to 99.25 and the S&P 500's decline to 6536.67 suggests a global preference for safety over risk, which is detrimental to altcoins.
On-chain metrics for Ethereum also warrant attention. While active addresses and transaction volumes might show fluctuations, they haven't provided a strong bullish signal recently. Whale movements, which can often precede significant price action, have been mixed, with some large holders appearing to accumulate cautiously while others reduce their exposure. Exchange flows data shows a net outflow of ETH from exchanges, which is typically seen as a bullish sign, indicating holders are moving assets to cold storage, potentially for staking or long-term holding. However, this positive on-chain signal is currently being overshadowed by the broader bearish market sentiment and technical downtrend. The total value locked (TVL) in Ethereum's DeFi ecosystem, a key measure of its utility and adoption, has seen some pressure, reflecting the general market downturn and reduced speculative activity in decentralized finance.
The DeFi and NFT ecosystems, while core to Ethereum's value proposition, have also experienced a cooling-off period. Volumes in decentralized exchanges (DEXs) have decreased, and NFT trading activity has slowed considerably compared to previous bull cycles. This reduction in on-chain activity can directly impact Ethereum's utility and, consequently, its price. Gas fees, while not currently at extreme levels, are always a consideration for users interacting with the Ethereum network. High gas fees can deter usage, especially during periods of network congestion or heightened speculative trading. Currently, gas fees are in a manageable range, which is a positive sign for network accessibility, but they could quickly spike if a significant price rally or network event occurs.
Institutional adoption remains a critical long-term driver for ETHUSD. While the price action this week has been negative, the underlying interest from institutional players has not entirely vanished. The ongoing discussions around Ethereum ETFs, the development of institutional-grade staking solutions, and the increasing integration of blockchain technology into traditional finance are all positive long-term indicators. However, in the short term, the current market environment, characterized by rising interest rates and geopolitical uncertainty, tends to make institutions more risk-averse. This means that significant inflows into ETH-related investment products might be delayed until market conditions stabilize or improve. The performance of Bitcoin (BTCUSD), which is currently trading at $68,797, also plays a significant role. As the market leader, Bitcoin's price action often dictates the direction for ETHUSD and the broader altcoin market.
Looking ahead to next week, several factors will be crucial for ETHUSD's price trajectory. The immediate focus will be on whether ETHUSD can hold the $2,056.06 support level on the daily chart. A failure to do so could open the door to further declines, potentially targeting the $2,000 psychological level and lower daily support at $1,973.56. Conversely, a bounce from current levels, driven by oversold conditions on lower timeframes, would need to overcome resistance around $2,074.86 and, more importantly, the daily resistance at $2,115.31. Confirmation of a bullish reversal would likely require a daily close above $2,115.31, ideally accompanied by increasing volume and positive shifts in broader market sentiment.
The macroeconomic calendar next week will be closely watched. Key data releases, such as inflation reports or central bank commentary, could significantly influence risk appetite and, consequently, ETHUSD's price. Any indication of persistent inflation or hawkish monetary policy from major central banks could further strengthen the US Dollar and weigh on cryptocurrencies. Conversely, signs of easing inflation or a more dovish stance could provide some relief to risk assets. The correlation with the DXY (currently at 99.25) and equity markets like the S&P 500 (at 6536.67) will remain a critical theme. A sustained downtrend in equities and a continued rise in the DXY would likely keep ETHUSD under pressure.
For traders, the current environment calls for a disciplined approach. The oversold conditions on the 1-hour chart suggest potential for a short-term bounce, but the stronger bearish signals on the 4-hour and daily charts indicate that any upside might be limited. A cautious strategy would involve waiting for clearer signals of trend confirmation or reversal. For those looking to enter long positions, waiting for a confirmed daily close above key resistance levels, perhaps above $2,115.31, coupled with improving market sentiment and a weakening DXY, would provide a more robust setup. Conversely, traders favoring short positions might look for a decisive break below the $2,056.06 daily support, with confirmation from increased selling volume and negative news catalysts.
The volatility observed this week in ETHUSD, currently trading at $2,073.56, is a stark reminder of the inherent risks and opportunities in the cryptocurrency market. While the immediate technical picture leans bearish, the underlying technology and long-term adoption trends for Ethereum remain compelling. The oversold indicators on shorter timeframes present a potential for a short-term relief rally, but the prevailing macro and technical headwinds suggest that caution is warranted. Patience and disciplined risk management will be key for navigating these choppy waters. The market will likely remain sensitive to macroeconomic data and geopolitical developments, making it essential to stay informed and adaptable.
Looking ahead, the $2,056.06 level on the daily chart stands out as a critical zone to watch. A hold here could initiate a recovery, but a break below it would signal further downside potential. On the resistance side, reclaiming the $2,115.31 level would be the first step towards invalidating the immediate bearish bias. Until then, expect choppiness and a potential for further downside pressure, especially if the US Dollar continues its ascent and global risk appetite remains subdued. The interplay between short-term oversold conditions and longer-term bearish trends will define ETHUSD's path in the coming days. The market is always in motion, and adaptability is the trader's greatest asset.
The path forward for ETHUSD will largely depend on its ability to either find sustained buying interest at current levels or break decisively through key resistance. The current price of $2,073.56 presents a conflict between short-term oversold signals and longer-term bearish pressures. For bulls, the hope lies in a bounce from these oversold conditions, targeting immediate resistance at $2,074.86 and then the more significant daily resistance at $2,115.31. However, the strong downtrend indicated by the ADX on the 4-hour chart at 22.17 suggests that breaking these levels will require significant buying power, likely fueled by positive shifts in macroeconomic sentiment or major crypto-specific catalysts. Without such catalysts, the risk of a retest of daily support at $2,056.06 remains high.
For bears, the ideal scenario involves ETHUSD failing to hold the $2,056.06 daily support. A confirmed break below this level, especially with increasing volume, would open up targets towards $2,000 and potentially lower. The strong downtrend signals on multiple timeframes provide a basis for this bearish outlook. The correlation with a strengthening DXY (99.25) and a falling S&P 500 (6536.67) also supports the narrative of risk aversion, which typically weighs on cryptocurrencies. Traders looking for short opportunities might wait for a breakdown below $2,056.06, using subsequent resistance levels as potential re-entry points for short positions, or targeting the next major support cluster.
The neutral scenario, which seems plausible given the conflicting signals between short-term oversold conditions and longer-term bearish trends, would involve ETHUSD consolidating within a range. This consolidation could occur between the immediate 1-hour support around $2,041.19 and resistance near $2,074.86, or a wider range defined by the daily support at $2,056.06 and daily resistance at $2,115.31. In such a scenario, volatility might decrease, and price action could become choppy as the market awaits clearer directional cues from macroeconomic data releases or significant on-chain developments. This consolidation phase could be a prelude to a larger move, but it requires careful observation of volume and price action at the boundaries of the range.
The key takeaway for investors and traders is that while short-term indicators might suggest a bounce is possible from the current $2,073.56 level, the broader trend and macroeconomic environment remain challenging for ETHUSD. The strong downtrend signals on the 4-hour chart, coupled with a strengthening dollar and risk-off sentiment in traditional markets, suggest that any upside may be limited. Therefore, a prudent approach would be to await clearer confirmation of a trend reversal before committing to significant long positions. For short-term traders, the oversold conditions on the 1-hour chart might offer tactical opportunities, but these should be managed with tight stop-losses and a clear exit strategy, acknowledging the prevailing bearish momentum.
The current technical setup for ETHUSD, trading at $2,073.56, presents a classic case of conflicting signals. The 1-hour indicators are flashing oversold, hinting at a potential short-term bounce. However, the more dominant 4-hour and daily charts are showing signs of a sustained downtrend, reinforced by a strong ADX reading and negative MACD momentum. The correlation with a strengthening DXY (99.25) and a falling S&P 500 (6536.67) adds to the bearish sentiment. Until ETHUSD can decisively break above key resistance levels, particularly the daily resistance at $2,115.31, and demonstrate sustained buying pressure, the risk of further downside towards daily support at $2,056.06 remains elevated. Traders should remain vigilant, manage risk tightly, and wait for clear directional confirmation.
Ultimately, the cryptocurrency market thrives on narrative and momentum. This week, the narrative has been decidedly bearish, driven by macro factors and technical breakdowns. While Ethereum's underlying technology and long-term potential remain strong, the short-to-medium term outlook is clouded by current market conditions. The ability of ETHUSD to hold support at $2,056.06 will be crucial in determining whether this is a temporary pullback or the start of a deeper correction. For now, patience appears to be the most rewarding strategy, allowing the market to provide clearer signals before making significant directional bets.
Volatility creates opportunity, and the current choppy conditions for ETHUSD around $2,073.56 are no exception. While the immediate technical picture displays bearish undertones, the underlying strength of the Ethereum network and ongoing development suggest resilience. Traders and investors who can navigate these fluctuations with disciplined risk management and a clear understanding of the key levels - support at $2,056.06 and resistance at $2,115.31 - will be best positioned to capitalize on future market movements. The market always provides second chances; the key is to wait for the right setup and execute with precision.
Frequently Asked Questions: ETHUSD Analysis
What happens if ETHUSD breaks below the $2,056.06 daily support level?
A break below $2,056.06 would likely trigger further selling pressure, potentially targeting the $2,000 psychological level and the next daily support at $1,973.56. This would confirm the bearish trend indicated by the 4-hour ADX at 22.17.
Should I buy ETHUSD at current levels around $2,073.56 given the oversold RSI at 19.73?
While the 1-hour RSI at 19.73 suggests oversold conditions and a potential short-term bounce, the stronger bearish signals on the 4-hour and daily charts, along with a strengthening DXY at 99.25, warrant caution. A more robust bullish setup would require a confirmed break above $2,115.31.
Is the current RSI at 19.73 on the 1-hour chart a sell signal for ETHUSD?
An RSI reading of 19.73 on the 1-hour chart is an oversold signal, typically indicating potential for a short-term bounce rather than a sell signal. However, on the 4-hour chart, RSI at 29.35 still shows bearish momentum, suggesting caution is needed.
How will the strengthening US Dollar (DXY at 99.25) affect ETHUSD this week?
A strengthening DXY often correlates with a risk-off sentiment, which tends to put pressure on risk assets like ETHUSD. This macro environment suggests that ETHUSD may face headwinds and struggle to sustain any upside moves until the DXY shows signs of weakness.
Track markets in real-time
AI-powered analysis, technical indicators and real-time price data.
Join Our Telegram Channel
Breaking market news, AI analysis and trading signals instantly.
Join Channel