BTCUSD Weekly: Bears Bite at $68,613 - Outlook Unclear Amidst Risk-Off Sentiment
BTCUSD faces selling pressure at $68,613 as risk appetite wanes. Key levels to watch as bears eye further downside.
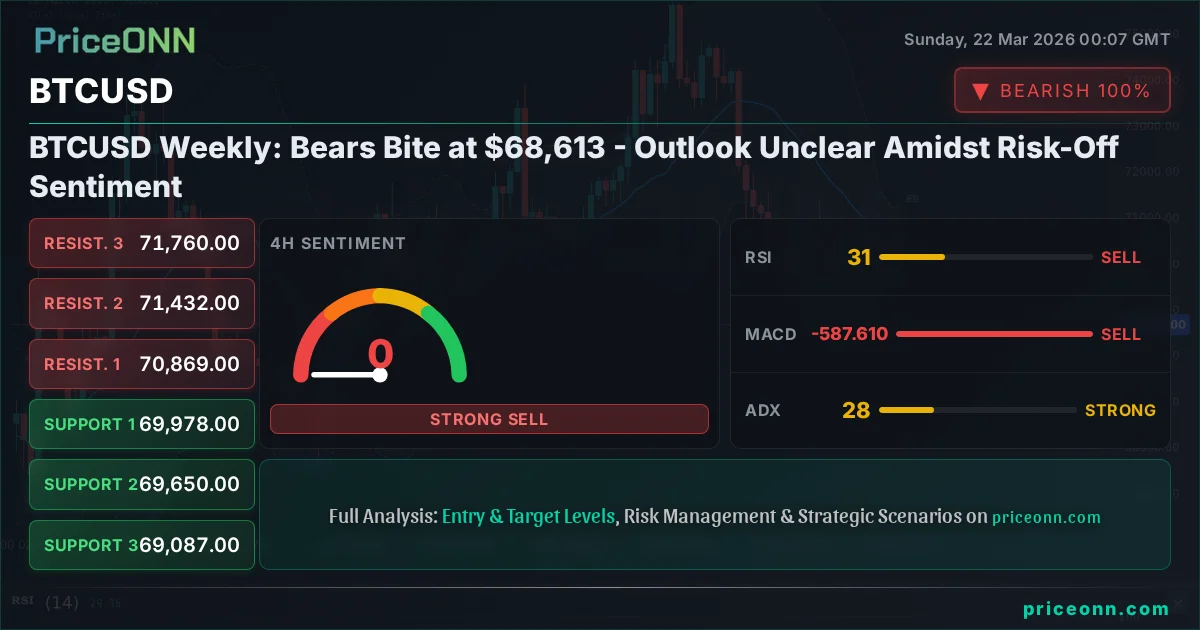
The cryptocurrency market, led by Bitcoin, is currently navigating a choppy sea. As of last Friday's close, BTCUSD found itself trading around the $68,613 mark, a level that now appears to be a critical juncture. The past week has been defined by a palpable shift in market sentiment, moving from cautious optimism to a more pronounced risk-off environment. This change has not only impacted Bitcoin but has also sent ripples across traditional markets, with equities experiencing significant pullbacks and commodities like oil seeing sharp, albeit temporary, surges driven by geopolitical anxieties. The question on every trader's mind is whether this is a temporary pause or the beginning of a more substantial correction. My read on the situation, looking at the confluence of technical signals and the prevailing macro backdrop, suggests that while short-term volatility is here to stay, the longer-term bullish thesis for Bitcoin remains intact, albeit requiring patience and careful risk management.
- BTCUSD closed last week near $68,613, with significant selling pressure evident across multiple timeframes.
- RSI readings on lower timeframes are approaching oversold territory (around 30-35), suggesting potential short-term bounces but not a confirmed trend reversal.
- Key support for BTCUSD is identified around $60,000, while resistance looms near $71,000, a level that needs to be cleared for renewed bullish momentum.
- The strengthening US Dollar Index (DXY) and declining equity markets (S&P 500, Nasdaq) are creating headwinds, indicating a broader market deleveraging event.
- Geopolitical tensions, while causing spikes in oil prices, are also contributing to a flight to safety, indirectly pressuring risk assets like Bitcoin.
Navigating the Sell-Off: What Drove BTCUSD Lower This Week?
The Technical Picture: Bears Take Control on Key Timeframes
Looking at the technical charts for BTCUSD, the past week painted a decidedly bearish picture, particularly on the shorter to medium-term timeframes. The 1-hour and 4-hour charts clearly show a dominant downtrend. On the 1H chart, the trend strength is at a formidable 99%, with sellers firmly in control. The ADX indicator at 38.15 reinforces this, signaling a strong bearish trend currently in play. The current price of $68,613 is well below several resistance levels, with the first significant hurdle at $70,356 and further up at $71,477. The RSI(14) on this timeframe hovers around 35.14, indicating weakness but not yet deep oversold conditions that would typically signal a strong bounce. MACD is firmly in negative territory, with the MACD line below its signal line, confirming bearish momentum. Bollinger Bands are also showing price trading below the middle band, and the lower band itself is being tested, a sign of significant selling pressure. The Stochastic oscillator, with K at 18.69 and D at 14.95, is in oversold territory, suggesting a potential for a brief technical bounce, but the overall trend remains decidedly downwards. This setup on the 1H chart indicates that short-term traders are likely looking for opportunities to sell into strength or fade rallies.
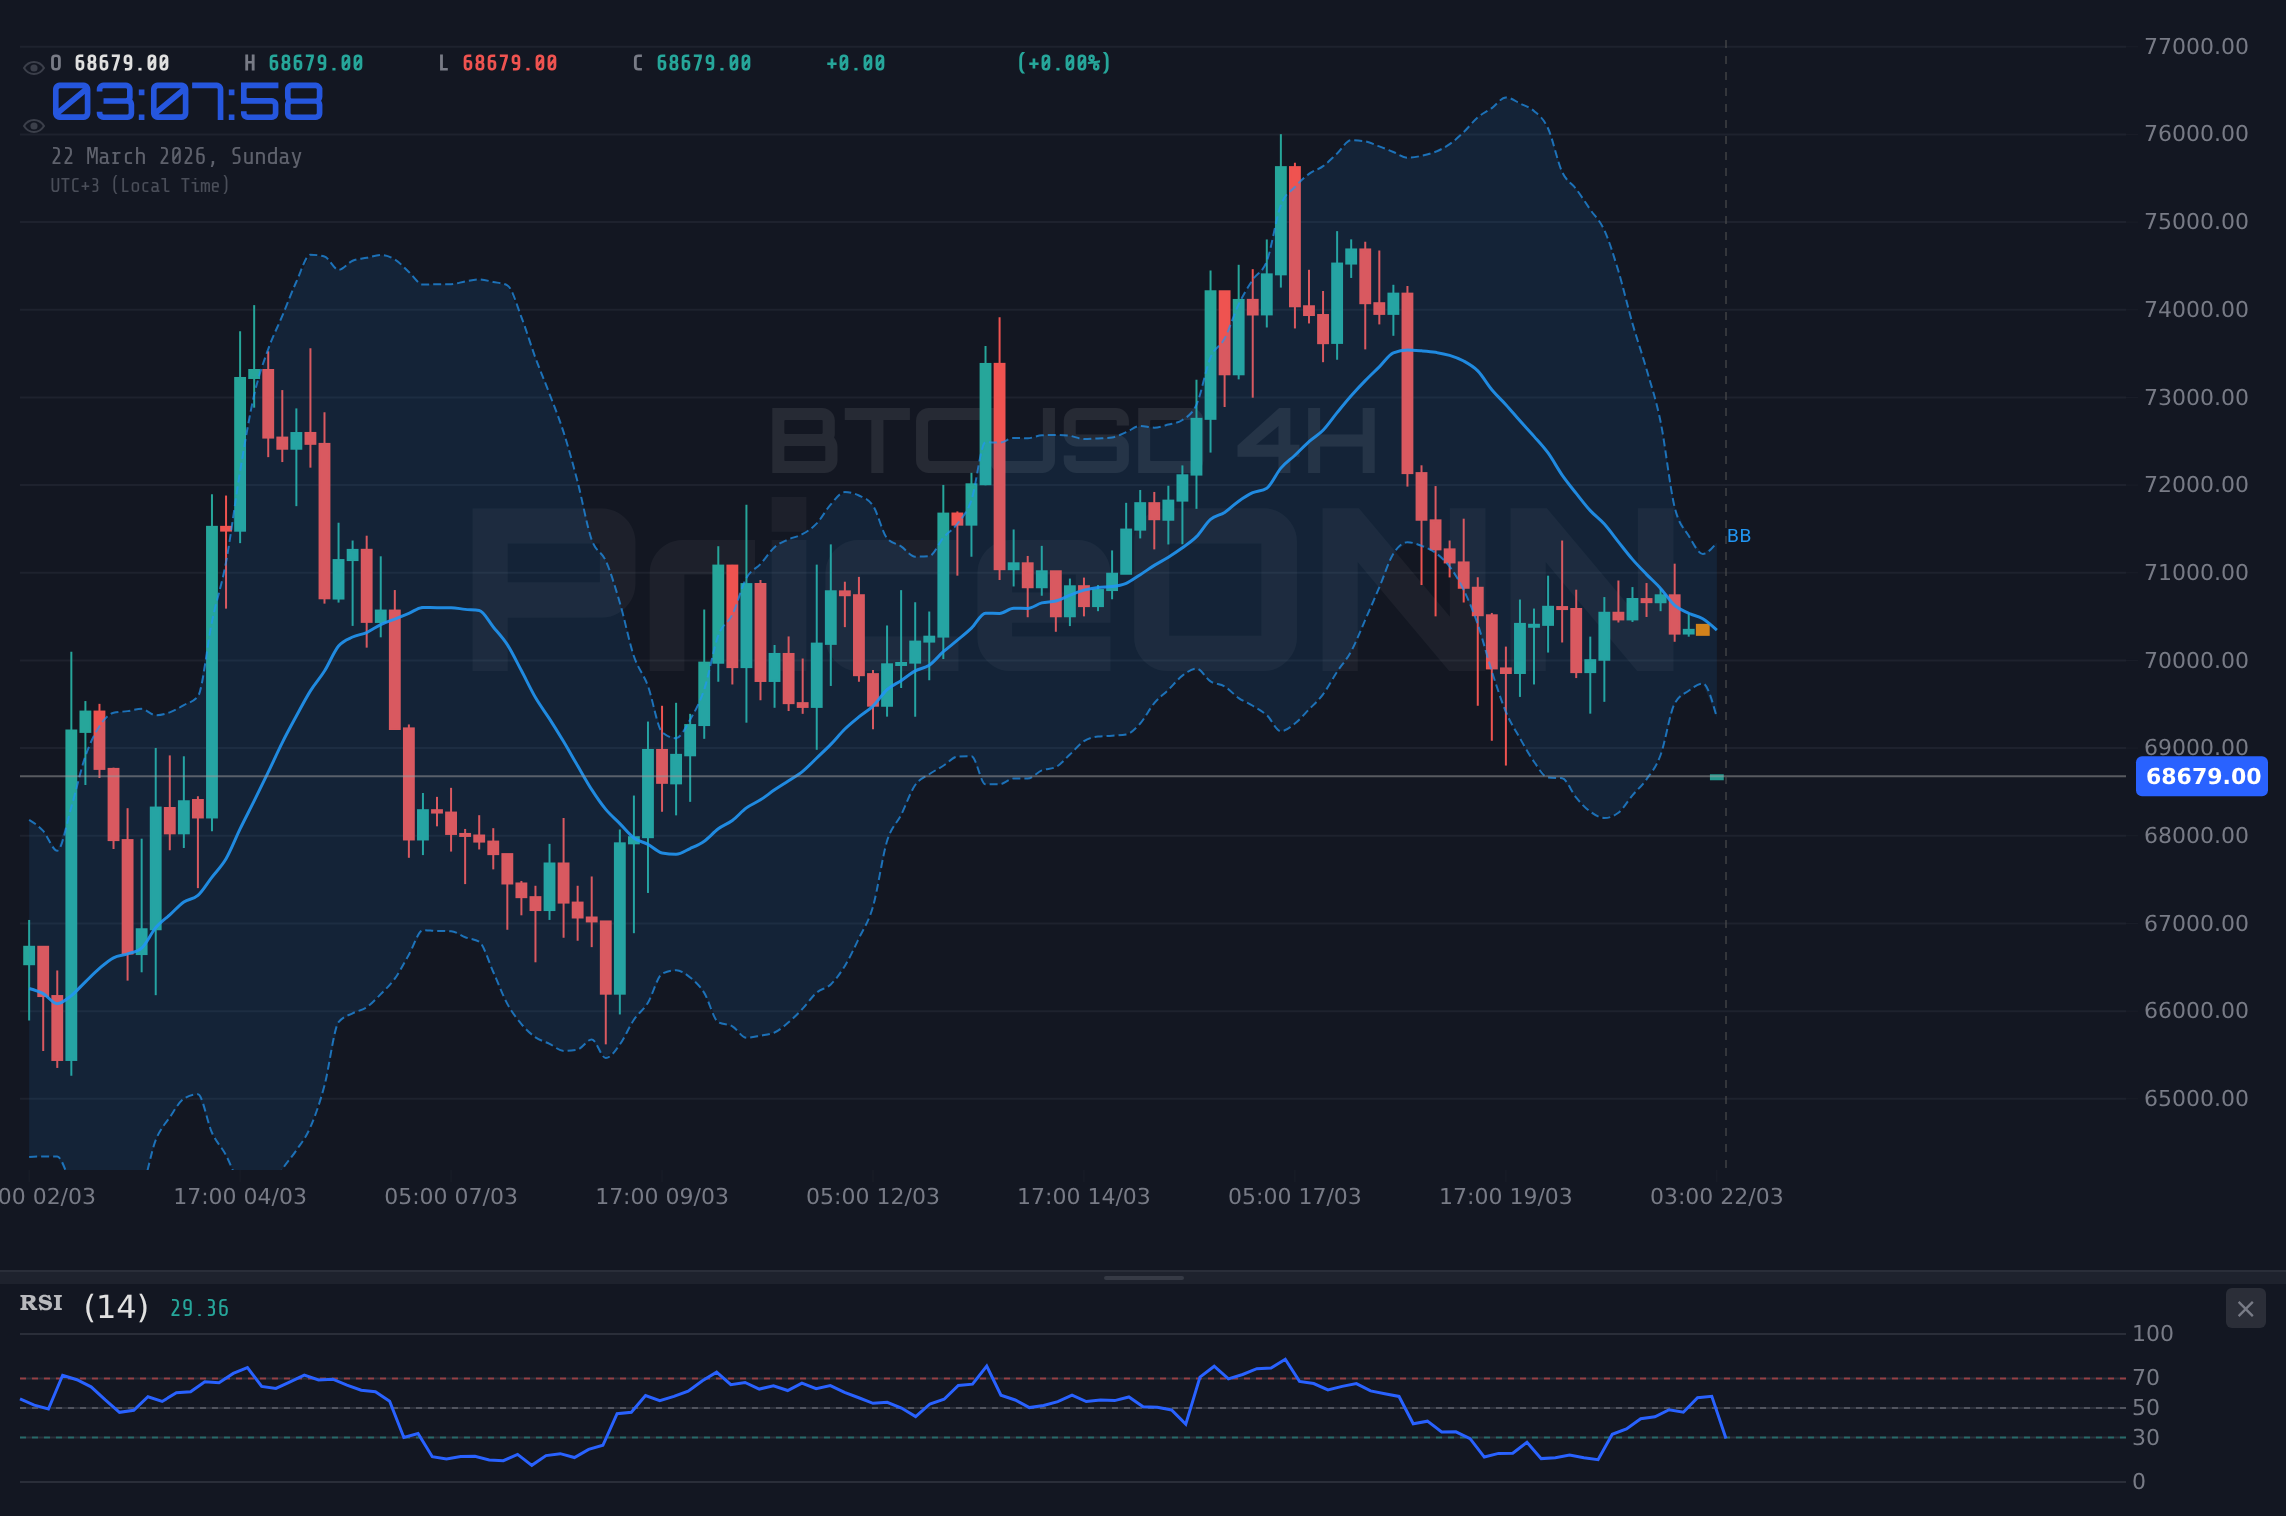
The 4-hour timeframe paints an even more concerning picture for the bulls. Here, the trend is also strongly bearish with a strength of 91%. The ADX at 22.4 suggests a moderately strong trend, which, combined with the clear downward trajectory, spells trouble for any lingering optimism. The RSI(14) is even lower than on the 1H chart, sitting at 31.33, firmly in the oversold zone and suggesting that any immediate bounce might be a technical correction rather than a reversal. MACD continues to show negative momentum, with the MACD line below its signal line. Price action is below the middle Bollinger Band, and the Stochastic oscillator, with K at 11.38 and D at 28.5, is deeply oversold, indicating that a short-term rebound is possible but the larger trend is down. The immediate support levels to watch on this timeframe are $69,978 and $69,650. Breaking these could accelerate the move lower towards the next significant psychological barrier around $68,000, and then down to the $67,527 mark. The general signal across these shorter timeframes is overwhelmingly 'SELL', underscoring the immediate bearish sentiment.
Shifting to the daily timeframe, the picture becomes slightly more nuanced but still leans bearish. The trend strength is classified as 'Neutral' at 50%, which might seem contradictory to the shorter-term sell signals. However, this 'neutral' classification on the daily chart often signifies a period of consolidation or indecision before the next major move, or it can reflect a broader, longer-term trend that is currently being challenged. The ADX here is 36.06, indicating a strong trend, but the directionality is less clear than on the intraday charts, possibly reflecting the tug-of-war between the strong short-term downtrend and the underlying longer-term bullish structure. The RSI(14) is at 37.2, still in the lower half of the neutral zone and suggesting room for further downside before reaching extreme oversold conditions. MACD is negative, with the MACD line below its signal line, confirming the prevailing bearish momentum. Bollinger Bands show price trading below the middle band, a bearish sign. Stochastic is in the oversold region (K=28, D=45.01), signaling a potential for a bounce. The daily support levels are critical: $69,502, $68,460, and $67,527. The daily resistance is found at $71,477, $72,410, and $73,452. The overall signal here is 'SAT', reflecting the dominant bearish momentum even if the daily trend isn't yet a clear-cut decline.
The Macroeconomic Crosscurrents: DXY, Equities, and Geopolitics
The Dollar's Strength: A Headwind for Risk Assets
The global financial landscape over the past week has been dominated by a confluence of factors, with the US Dollar Index (DXY) playing a pivotal role. The DXY has shown a notable upward trend, particularly on the daily chart, where its strength is rated at 92%. This strength in the dollar acts as a significant headwind for risk assets like Bitcoin. As the DXY strengthens, it typically implies a 'risk-off' sentiment in the market, where investors move their capital towards perceived safe-haven assets, such as the US dollar and US Treasuries, and away from more speculative assets. The DXY's current daily reading of 57.21 on the RSI(14) and its position above the middle Bollinger Band on the daily chart support this bullish dollar outlook. This dynamic is crucial for understanding Bitcoin's price action. Historically, a strong dollar often correlates with a weaker Bitcoin price, as seen in the current market environment. The price action around $68,613 for BTCUSD reflects this correlation; as the dollar strengthened, Bitcoin faced increased selling pressure.
The DXY's upward trajectory is further evidenced by its technical indicators. On the 4-hour chart, while the trend strength is only 85% (slightly lower than daily), the MACD is showing negative momentum, and price is below the middle band, suggesting a potential short-term pause or pullback in the dollar's ascent. However, the daily chart's strength and positive MACD momentum indicate that the broader trend for the dollar is still upwards. This is a critical piece of context for Bitcoin traders. If the dollar continues its climb, it will likely exert downward pressure on BTCUSD. The key levels for the DXY to watch are its current daily resistance around 99.72, and further up at 100.54. A sustained move above these levels would further validate the bullish dollar narrative and likely coincide with continued weakness in Bitcoin. Conversely, a failure of the DXY to break these resistance levels could signal a temporary reprieve for risk assets, including Bitcoin.
Equities Sell-Off: Risk Appetite Evaporates
The correlation between Bitcoin and the tech-heavy Nasdaq 100 and the broader S&P 500 has been a closely watched narrative. This past week, both indices experienced significant drawdowns. The Nasdaq 100, for instance, saw its 1H trend strength at a robust 99% bearish, with the ADX at 38.15, signaling a strong downtrend. The RSI(14) was around 35.14, indicating room for further decline. Similarly, the S&P 500 exhibited a strong bearish trend on the 1H (94% strength, ADX 37.97) and 4H (92% strength, ADX 24.88) charts. The daily charts for both indices also showed clear downtrends, with the S&P 500's ADX at 44.59 and Nasdaq's at 36.06, confirming strong prevailing bearish momentum. This broad-based sell-off in equities is a classic sign of diminishing risk appetite among investors. When major stock indices tumble, capital tends to flow out of speculative assets like cryptocurrencies and into safer havens. Bitcoin, despite its 'digital gold' narrative, has often behaved more like a high-beta tech stock, meaning it tends to amplify the moves seen in the equity markets. Therefore, the sharp declines in the Nasdaq and S&P 500 are a significant contributing factor to the selling pressure seen in BTCUSD around the $68,613 level.
The implications of this equity sell-off for Bitcoin are profound. It suggests that the current market environment is not conducive to speculative buying. Investors are likely de-risking their portfolios, moving away from assets that have a higher correlation with market sentiment and towards perceived safer assets. This macro backdrop makes any attempts at a bullish reversal in Bitcoin more challenging. For a sustainable rally to occur, we would likely need to see a stabilization or recovery in the equity markets. The key levels to watch for the S&P 500 would be its daily support around 6569.53, and for the Nasdaq, its support at 24166.02. A sustained break below these levels could signal further pain for risk assets, including BTCUSD. The fact that Bitcoin is experiencing a significant decline alongside these major indices suggests that its correlation with traditional risk assets remains a dominant factor in its price discovery, at least in the short to medium term. This reinforces the bearish sentiment observed on the intraday BTCUSD charts.
Geopolitical Tensions and Oil Spikes: A Double-Edged Sword
The geopolitical landscape has added another layer of complexity and volatility to the markets. Recent events, such as the attack on Qatar's Ras Laffan energy hub and ongoing tensions in the Middle East, have caused crude oil prices (Brent and WTI) to surge. Brent crude, for example, saw its 1H trend strength at 50% neutral but with RSI at 61.07 and Stochastic in overbought territory (K=93.51, D=72.44), signaling upward momentum. WTI also showed upward momentum on the 1H and 4H charts, with daily RSI at 70.58 indicating strong bullishness. This spike in oil prices, driven by supply concerns and geopolitical risk, has a dual effect. Firstly, it fuels inflation concerns. Higher energy costs translate into higher transportation and production costs across the board, potentially leading to increased inflation. Central banks, particularly the Federal Reserve, are highly sensitive to inflation data. Persistent inflation could delay or even halt any anticipated interest rate cuts, which would be negative for risk assets like Bitcoin. This is a key reason why the Fed's stance remains a significant factor influencing BTCUSD's outlook.
Secondly, the surge in oil prices, while indicative of geopolitical risk, also contributes to the broader 'risk-off' sentiment. When energy prices spike due to supply disruptions or conflict, it creates uncertainty about global economic growth and stability. This uncertainty often leads investors to seek refuge in safer assets, as mentioned earlier, which can put pressure on speculative assets like cryptocurrencies. While some might argue that Bitcoin, as a scarce digital asset, could act as a hedge against inflation similar to gold, its correlation with risk assets in recent times has often overshadowed this narrative. The past week's price action for BTCUSD at $68,613 seems to confirm this. Despite oil's surge, Bitcoin moved lower, aligning more with the equity sell-off and dollar strength than with a safe-haven narrative. The fact that gold and silver also saw significant price drops this week, as reported, further suggests that the dominant market theme is risk aversion rather than inflation hedging for many assets. This complex interplay of geopolitical risk, oil prices, inflation fears, and central bank policy creates a challenging environment for predicting short-term price movements in BTCUSD.
On-Chain Metrics and Market Structure: What the Data Reveals
Whale Movements and Exchange Flows: Signs of Caution
Delving into the on-chain metrics provides a more granular view of market sentiment and potential future price action for BTCUSD. Recent data indicates that significant whale movements have been occurring. Reports show whales moving over $100 million in Bitcoin amidst the geopolitical turmoil and oil price surge. While whale movements can be interpreted in multiple ways – accumulation, distribution, or simple reallocation – the context of a broader market sell-off is crucial. When large holders are seen moving substantial amounts of Bitcoin, especially when associated with increased volatility or price declines, it can signal caution or distribution. If these whales are moving assets to exchanges, it might suggest they are preparing to sell, potentially adding to the downward pressure. Conversely, if they are moving coins to cold storage, it could indicate a long-term accumulation strategy, which would be a more bullish signal for the future. Without more specific context on the destination of these whale movements (e.g., to exchanges vs. private wallets), it's difficult to draw a definitive conclusion, but the sheer volume suggests that significant players are actively managing their positions.
Exchange flows are another critical on-chain metric to monitor. An increase in Bitcoin flowing onto exchanges typically suggests increased selling pressure, as more supply becomes available for traders. Conversely, a decrease in exchange balances, with coins moving to cold storage, generally indicates accumulation and a more bullish outlook. While specific real-time exchange flow data isn't provided in the market context, general market sentiment suggests that during periods of sharp price declines, there is often an increase in coins moving towards exchanges from retail and potentially some whale wallets looking to exit positions or rebalance. This trend, if confirmed by on-chain data, would further support the bearish technical signals observed on the charts. The current price of $68,613 for BTCUSD is at a critical juncture where understanding these whale and exchange flows becomes paramount for assessing the conviction behind the current downtrend or the potential for a bounce.
DeFi and NFT Ecosystem Developments: Innovation Continues Amidst Downturn
Despite the broader market downturn, the cryptocurrency ecosystem continues to innovate, particularly in the Decentralized Finance (DeFi) and Non-Fungible Token (NFT) spaces. Recent news highlights the launch of OP_NET's native 'SlowFi' protocol, aiming to bring DeFi directly on-chain without the need for bridges or wrapped Bitcoin. This development is significant because it represents a move towards more integrated and potentially more secure DeFi solutions built natively on the Bitcoin blockchain. Such innovations, even if they don't immediately impact the price of BTCUSD, are crucial for the long-term adoption and utility of the cryptocurrency. The success of these native DeFi protocols could attract more institutional interest and utility for Bitcoin beyond just a store of value or speculative asset. The Total Value Locked (TVL) in DeFi protocols, while likely to see some pressure during a market downturn, remains a key indicator of the health and growth of the decentralized financial ecosystem.
Similarly, the NFT market, while experiencing its own cycles of boom and bust, continues to see development. New platforms, art projects, and utility-driven NFTs are constantly emerging. The resilience of these ecosystems, even during broader market corrections, is a testament to the underlying innovation within the crypto space. For Bitcoin specifically, the development of on-chain DeFi solutions like those proposed by OP_NET could provide a significant boost to its utility and, consequently, its long-term value proposition. While the immediate price action around $68,613 is driven by macro factors and technical trading, these fundamental developments in DeFi and NFTs are building blocks for future growth. It's important for traders to keep an eye on these developments, as they can often precede significant shifts in market sentiment or adoption trends. The ability of these ecosystems to thrive and innovate, even when BTCUSD is under pressure, suggests a robust underlying technological and community-driven momentum.
Regulatory Landscape and Institutional Adoption: The Long Game
Regulatory developments and institutional adoption remain critical long-term drivers for Bitcoin. While there might not have been major regulatory shifts announced in the last 48 hours directly impacting BTCUSD's price action around $68,613, the ongoing discussions and evolving frameworks around cryptocurrencies globally continue to shape the market. Developments like the suspension of Bitcoin Depot in Connecticut highlight the challenges and scrutiny the industry faces. However, on the flip side, news of Coinbase and Apex Group tokenizing Bitcoin Yield Funds on Base demonstrates continued institutional engagement and innovation within regulated structures. This is a crucial dichotomy: while some regulatory actions create uncertainty, others pave the way for more structured and compliant integration of digital assets into traditional finance.
The institutional adoption trend, despite short-term market volatility, generally remains positive. Large financial institutions are increasingly exploring and integrating Bitcoin and other digital assets into their offerings, whether through ETFs, custody services, or yield-generating products. This institutional interest provides a strong undercurrent of demand and legitimacy for the asset class. For instance, the ongoing discussion around Bitcoin ETFs and their flows, even if not explicitly detailed in the provided market context, is a critical factor to monitor. Positive ETF flows can signal institutional buying, while outflows can indicate selling pressure. As the market matures, the interplay between regulatory clarity and sustained institutional adoption will be key to determining Bitcoin's long-term trajectory beyond the current price levels. This ongoing narrative provides a backdrop against which short-term price action, like the recent move around $68,613, must be considered.
Trade Scenarios and Levels to Watch Next Week
Given the current market conditions, characterized by strong bearish technical signals on intraday charts, a strengthening dollar, declining equities, and geopolitical uncertainty, the outlook for BTCUSD remains highly sensitive to key levels. The price action around $68,613 is pivotal. A decisive break below the immediate support levels on the 4-hour chart, particularly $69,978 and $69,650, would likely accelerate the downtrend, potentially targeting the psychological $60,000 level. This scenario is further supported by the current macro environment favoring risk reduction. Conversely, a sustained bounce from current levels, perhaps triggered by oversold conditions on lower timeframes or a shift in macro sentiment, would need to overcome significant resistance. The critical resistance to break for any bullish revival would be the $71,477 level, and more importantly, the $73,452 mark on the daily chart. Until such a decisive break occurs, and is confirmed by follow-through buying and improved market sentiment, caution is the prevailing theme.
For traders, the strategy revolves around managing risk and waiting for clearer signals. The current environment is not conducive to aggressive long positions. Instead, focusing on short-term opportunities within the downtrend or waiting for a confirmed reversal pattern would be prudent. The 1-hour and 4-hour charts are currently favoring short positions on rallies towards resistance levels, while the daily chart suggests that any significant bounce could offer an opportunity for long-term investors to accumulate if key supports hold. Patience will be key in the coming week. Monitoring the correlation with the DXY and equity markets, as well as any significant shifts in on-chain metrics like exchange flows, will be vital for navigating these volatile conditions. The $68,613 level represents a battleground, and the outcome of this battle will likely dictate the short-to-medium term direction for BTCUSD.
Bearish Scenario: Bears Consolidate Below $70K
65% ProbabilityNeutral Scenario: Consolidation Around $68K - $70K
25% ProbabilityBullish Scenario: Bounce from Oversold Conditions
10% ProbabilityFrequently Asked Questions: BTCUSD Analysis
What happens if BTCUSD breaks below the $67,527 support level?
If BTCUSD closes a daily candle below the critical $67,527 support, it would invalidate any short-term bullish hopes and likely accelerate the downtrend. This could open the door for a rapid move towards the $65,000 and potentially the $60,000 levels as sellers seize control.
Should I buy BTCUSD at current levels around $68,613 given the oversold RSI on lower timeframes?
Buying at current levels carries significant risk due to the prevailing bearish trend and macro headwinds. While oversold RSI on 1H/4H charts might suggest a short-term bounce, a sustained move above $70,356 resistance is needed for a more convincing bullish setup. Patience and waiting for confirmation are advised; a close above $71,477 would be a stronger buy signal.
Is the RSI at 37.2 on the daily chart a sell signal for BTCUSD?
An RSI of 37.2 on the daily chart is not an outright sell signal but indicates bearish momentum. It suggests that while the price is trending down, it is not yet in extreme oversold territory, leaving room for further downside. A move below 30 would be a stronger oversold signal, potentially preceding a bounce, but the current reading confirms the bearish bias.
How will the strengthening DXY and equity sell-off affect BTCUSD this week?
The strengthening US Dollar Index (DXY) and the ongoing sell-off in equities create a risk-off environment that typically pressures speculative assets like Bitcoin. If these macro factors persist, BTCUSD is likely to face continued selling pressure, potentially testing lower support levels. A sustained break above DXY resistance or a recovery in stocks would be needed to alleviate this pressure.
The past week has underscored the sensitivity of Bitcoin to broader market sentiment and macroeconomic factors. While the underlying innovation within the crypto space continues, the dominant narrative has been one of risk aversion. For traders and investors, this means prioritizing capital preservation and waiting for clearer directional signals. The battle at the $68,613 level is fierce, and the outcome will likely be dictated by forces extending far beyond the cryptocurrency market itself. Patience and disciplined risk management are paramount as we await the next decisive move.
Track markets in real-time
AI-powered analysis, technical indicators and real-time price data.
Join Our Telegram Channel
Breaking market news, AI analysis and trading signals instantly.
Join Channel