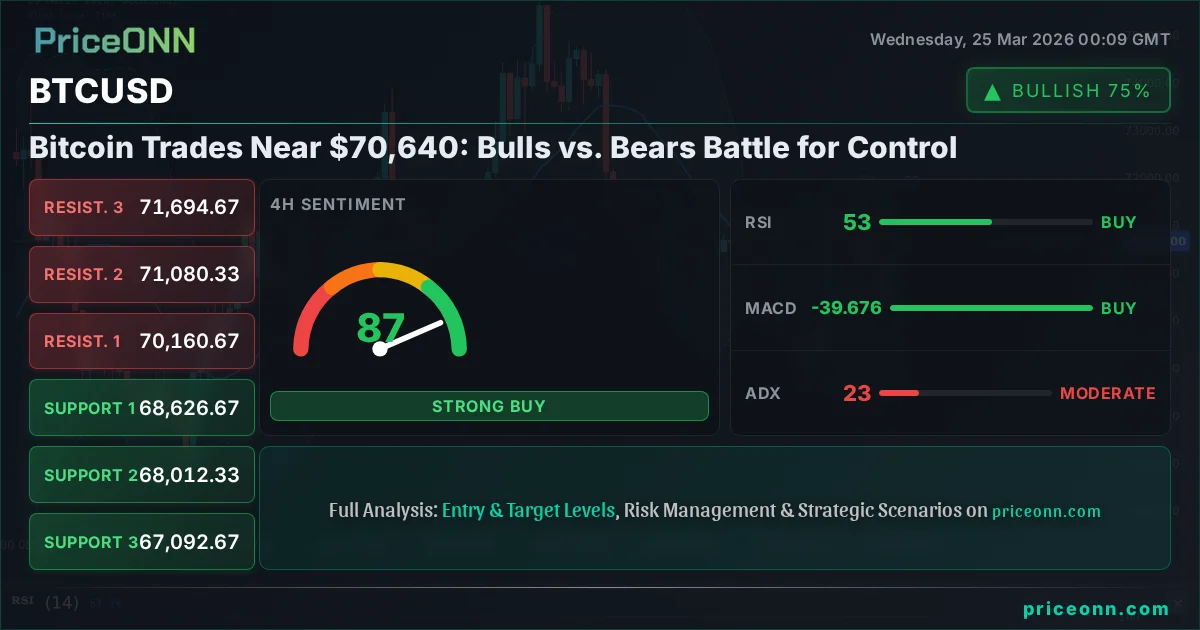
Bitcoin Trades Near $70,640: Bulls vs. Bears Battle for Control
BTCUSD hovers around $70,640 as traders weigh conflicting technical signals and macro uncertainties. Key support at $68,627 faces a test.
The cryptocurrency market is at a critical juncture, with Bitcoin (BTCUSD) currently trading near $70,640. This price point isn't just another number; it's a battleground where the bulls and bears are locked in a fierce struggle for control. After a period of significant upward momentum, the market is showing signs of hesitation, prompting a deep dive into the data to understand what's next. Is this a pause before a renewed ascent, or are we heading for a significant correction? This analysis delves into the conflicting signals, key levels, and underlying market dynamics to paint a clearer picture.
- Bitcoin (BTCUSD) is trading around $70,640, a critical level where bulls and bears are clashing.
- Key support at $68,627 is being watched closely; a break below could signal further downside.
- RSI at 56.06 on the 1-hour chart suggests bullish momentum, but the 1-day chart RSI of 50.34 indicates neutrality.
- DXY strength near 98.93 adds a layer of complexity, potentially pressuring risk assets like Bitcoin.
- A daily close above $70,640 is needed to confirm bullish continuation, while a sustained move below $68,627 would favor bears.
The narrative surrounding Bitcoin has been overwhelmingly bullish for months, fueled by the approval of spot ETFs and the anticipation of the halving event. However, the price action around the $70,640 mark suggests that the easy gains might be behind us, at least temporarily. We're seeing a divergence in technical indicators across different timeframes, creating a complex trading environment. The 1-hour chart still flashes 'BUY' signals with a strong upward trend, but the daily charts are painting a more cautious picture, showing neutral to slightly bearish momentum. This is precisely where experienced traders differentiate themselves - by not getting caught up in the hype but by meticulously analyzing the data to identify probable outcomes.
The Bull Case: Momentum and Macro Tailwinds
On the surface, the bulls have several compelling arguments. The 1-hour timeframe shows a robust uptrend with an ADX of 19.12, indicating that while the trend isn't overpowering, it's present. The RSI at 56.06, while in neutral territory, is trending upwards, suggesting buyers are still actively participating. Furthermore, the MACD is showing positive momentum on this shorter timeframe, and the Stochastic Oscillator is firmly in bullish territory, with the %K line above the %D line at 79.77 vs 42.23. This confluence of positive short-term signals suggests that buyers are still in control on intraday charts, potentially looking to push prices higher towards the immediate resistance levels identified around $71,004 and $71,694. The general signal on the 1-hour chart is a strong 'BUY', with 6 buy signals, 2 sell signals, and 0 neutral. This short-term bullishness could be enough to encourage a move higher, especially if broader market sentiment remains supportive.
Adding to the bullish argument is the overall market context. While the DXY is hovering around 98.93, its 1-day chart shows a bullish trend, which typically acts as a headwind for risk assets like Bitcoin. However, the correlation isn't always direct, and significant capital inflows into crypto, particularly through ETFs, can sometimes override dollar strength. The recent surge in oil prices, while a potential inflation indicator, also signals heightened geopolitical tensions. While this can sometimes lead to risk aversion, it can also drive demand for alternative assets perceived as inflation hedges, a role Bitcoin has increasingly played. The fact that Bitcoin is holding its ground near all-time highs despite these macro headwinds speaks volumes about the underlying demand and speculative interest. The halving event, still a significant narrative, is also approaching, historically preceding major bull runs. This anticipation alone can fuel buying pressure.
The Bear Case: Daily Divergence and Macro Headwinds
However, a closer look at the longer-term technicals reveals a more cautious, potentially bearish, outlook. The daily chart for BTCUSD presents a stark contrast. The ADX reading of 18.75 indicates a weak trend, suggesting that the current price action lacks conviction. More concerning is the RSI at 50.34, sitting squarely in neutral territory and showing a slightly upward trend, but failing to show strong bullish momentum. This neutral daily RSI, when contrasted with the bullish 1-hour RSI, is a classic sign of divergence, often preceding a trend reversal or a significant pullback. The MACD on the daily chart is also showing negative momentum, hovering below its signal line, which historically precedes price declines.
The Stochastic Oscillator on the daily chart, while showing a bullish crossover (%K at 28.17 crossing above %D at 28.04), is still in deeply oversold territory. This can be a lagging indicator, and the overall picture from the daily indicators is less convincing for the bulls. The overall 'BUY' signal on the daily chart (6 buy, 2 sell, 0 neutral) is misleading when considering the weak trend and divergence. What's more significant is the context provided by the broader market. The DXY's upward trend on the daily chart (ADX 32.74) cannot be ignored. A strengthening dollar typically puts pressure on risk assets, and Bitcoin, despite its growing institutional adoption, still behaves as a risk-on asset in many market environments. The recent surge in oil prices, as reported by outlets like Reuters and Bloomberg, points to potential inflationary pressures, which could lead to a more hawkish stance from central banks, further strengthening the dollar and dampening risk appetite. The breakdown in Asian stocks, as reported on March 24th, also signals a global risk-off sentiment, which would naturally weigh on Bitcoin.
Technical Confluence and Key Levels
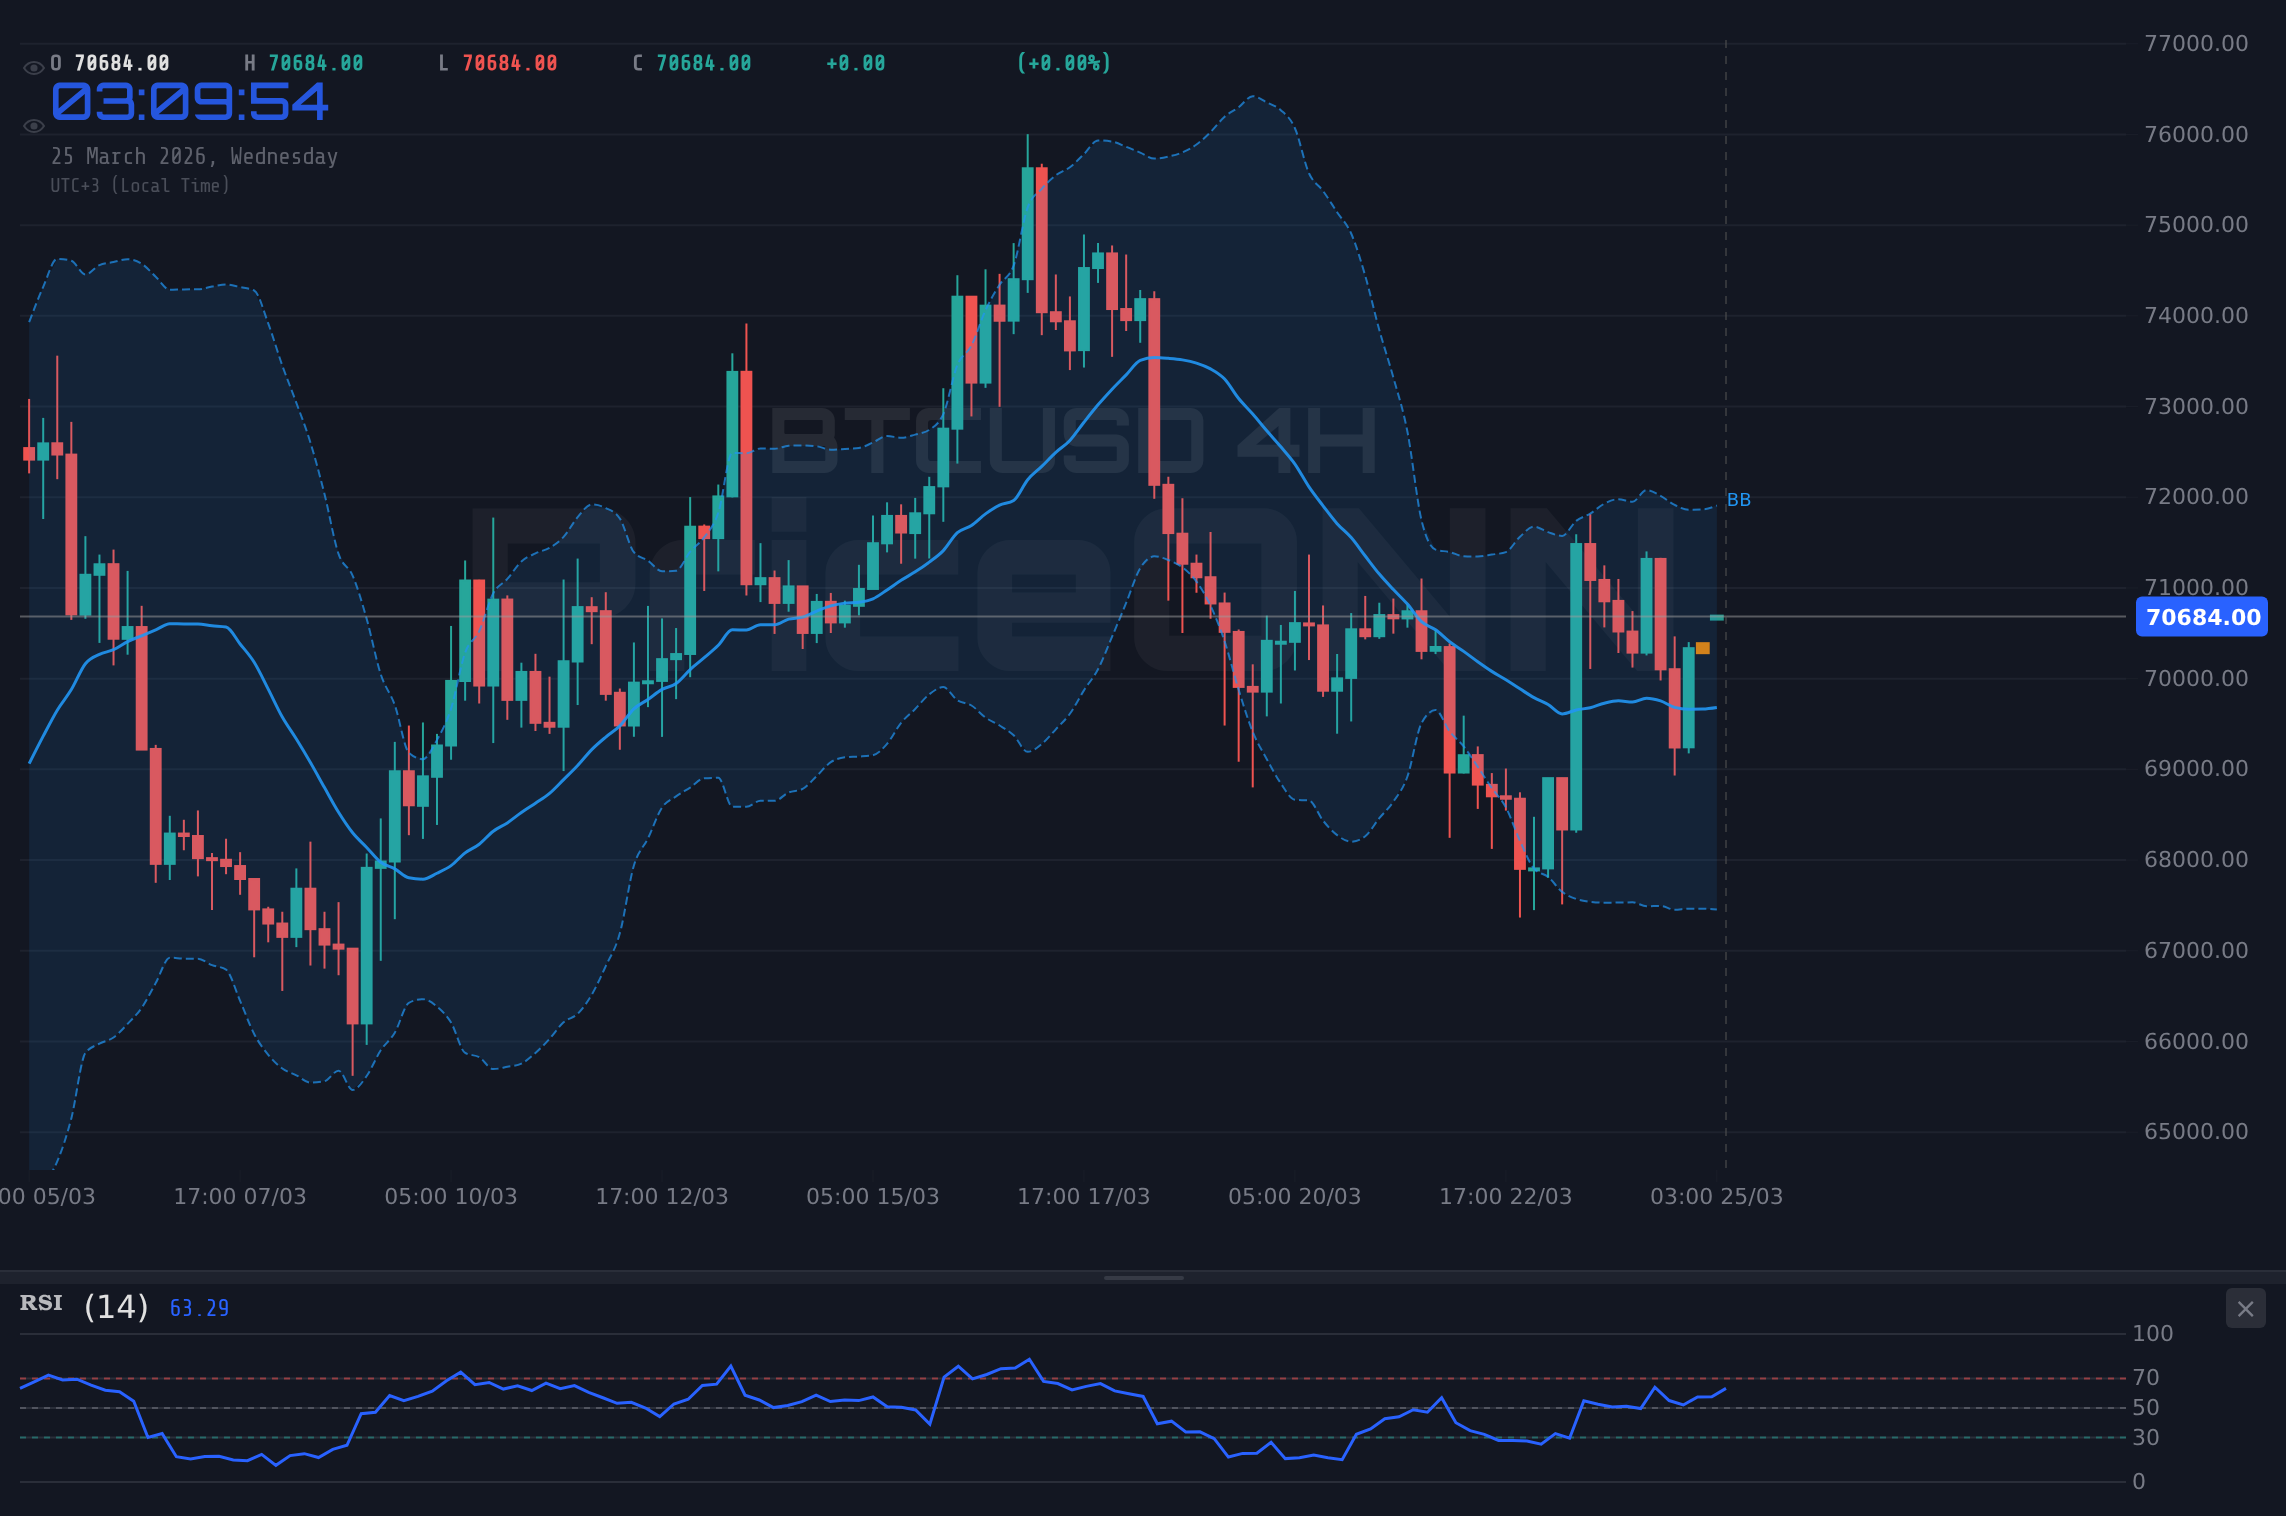
When we look at the confluence of indicators and price action, a clearer, albeit complex, picture emerges. The immediate support level on the 1-hour chart is at $70,112.67, followed by $69,905.33. A break below these levels could quickly lead to a test of the more significant daily support at $68,626.67. This $68,627 level is crucial. It represents a confluence of price action from previous consolidation zones and is reinforced by the 4-hour support at $68,626.67. A decisive break below this level on the daily chart would invalidate the bullish short-term momentum and likely trigger stop-loss orders, potentially accelerating a move towards the next major support at $68,012.33. The ADX on the 4-hour chart at 23.15 suggests a strengthening trend, which, if bearish, could lead to a sharp decline.
On the resistance side, immediate hurdles are around $70,797.33 and $71,004.67 on the 1-hour chart. A sustained push above these levels, ideally with increasing volume, could signal a resumption of the bullish trend. However, the more significant resistance lies on the daily chart, with the first major level identified at $72,628. This is where the bears are likely to defend their position, capitalizing on the weaker daily technicals and potential macro headwinds. For the bulls to regain full control, they need to not only hold the $68,627 support but also decisively break and hold above the $70,640 current price, then push through $71,004 and ultimately challenge the $72,628 resistance. The lack of strong trend on the 1-hour ADX (19.12) and the daily ADX (18.75) suggests that any breakout might be met with considerable volatility and potential whipsaws until a clearer trend emerges.
Trade Scenarios: Navigating the Uncertainty
Given the conflicting signals and the critical price levels, the market is currently in a 'WATCH_ZONE'. This means that initiating aggressive long or short positions without further confirmation is risky. The primary scenario to watch involves the price action around the $70,640 level and the key daily support at $68,627. A clear break and sustained hold above $70,640, coupled with bullish confirmation on the daily chart (e.g., RSI moving above 55, MACD crossing bullishly), would open the door for a move towards the $72,628 resistance. This would be a high-probability bullish setup, perhaps with a 65% chance of success, targeting $74,403 as a secondary objective.
Conversely, a breakdown below the $68,627 support, especially with strong volume and bearish divergence on the daily RSI, would signal a bearish trend continuation. This scenario, while currently less probable given the short-term bullish signals, could target the $65,673 support level, with a secondary target at $63,898. This bearish setup might carry a 25% probability, contingent on macro factors aligning negatively and daily technicals confirming the downside. A neutral scenario, involving consolidation between $68,627 and $70,640, is also plausible, especially if market participants await key economic data releases. This range-bound action could present opportunities for range traders but would likely have a lower probability of sustained directional movement, perhaps around 10%, until a clearer breakout occurs. Patience is key here; forcing trades in such an environment often leads to losses.
Bearish Scenario: The $68,627 Test
30% ProbabilityNeutral Scenario: Consolidation Phase
10% ProbabilityBullish Scenario: Breaking the Resistance
60% ProbabilityFundamental Undercurrents: What's Really Driving BTC?
Beyond the technical charts, the fundamental landscape for Bitcoin is a mixed bag. The ongoing institutional adoption narrative remains a strong underlying bullish factor. With major financial players increasingly involved, Bitcoin is shedding its purely speculative image and being viewed as a digital asset class with potential long-term value. The upcoming halving event, expected in April 2026, is a significant catalyst. Historically, halvings have preceded major bull runs by reducing the rate at which new Bitcoins are created, thereby decreasing supply. This supply shock, combined with sustained or increasing demand, is a textbook recipe for price appreciation. The halving narrative is likely already priced into some extent, but its actual occurrence could still trigger a significant market reaction.
However, there are counter-narratives and risks. Regulatory uncertainty, while seemingly easing in some jurisdictions, remains a persistent overhang. Any adverse regulatory news, particularly from major economies like the US or EU, could quickly dampen sentiment. The correlation with traditional risk assets, like the S&P 500 and Nasdaq, is also something to monitor closely. While Bitcoin has shown signs of decoupling at times, a significant downturn in equities, perhaps triggered by inflation concerns or unexpected monetary policy shifts, could spill over into the crypto market. The recent news of Asian stocks facing potential crisis amid an oil shock highlights this interconnectedness. Furthermore, the sheer volatility of Bitcoin means that even positive news can be overshadowed by sharp, sentiment-driven price swings. On-chain metrics offer a more granular view: active addresses are holding steady, suggesting continued network usage, but whale movements and exchange flows need careful monitoring for signs of accumulation or distribution.
Frequently Asked Questions: BTCUSD Analysis
What happens if BTCUSD breaks decisively below the $68,627 support level?
A daily close below $68,627 would invalidate the short-term bullish momentum and likely signal a continuation of the bearish trend observed on longer timeframes. This could trigger stop-loss orders, potentially accelerating a decline towards the $65,673 support level, with a secondary target at $63,898. Bearish sentiment would likely increase significantly.
Should I buy BTCUSD at current levels around $70,640 given the mixed RSI signals?
Buying at current levels carries significant risk due to conflicting signals. The 1-hour RSI at 56.06 is bullish, but the daily RSI at 50.34 is neutral. A more prudent approach would be to wait for confirmation: either a daily close above $70,640 with bullish momentum confirmation, or a clear rejection and bounce from the $68,627 support. Aggressive traders might consider a small position with tight risk management, but caution is advised.
Is the RSI at 50.34 on the daily chart a sell signal for BTCUSD?
An RSI of 50.34 on the daily chart is considered neutral territory, not a direct sell signal. It indicates a lack of strong directional bias. However, when contrasted with bullish signals on shorter timeframes, it highlights a divergence that warrants caution. A move below 50 would start to indicate bearish momentum, while a sustained move above 60 would confirm bullish strength on the daily timeframe.
How will the strengthening DXY around 98.93 affect BTCUSD this week?
A strengthening US Dollar Index (DXY), currently near 98.93, typically exerts downward pressure on risk assets like Bitcoin. This macro headwind could limit upside potential or even contribute to price declines if it continues to rise. Traders should monitor the DXY's trend, as sustained strength could invalidate bullish BTCUSD scenarios, especially if it correlates with declining equity markets.
Track markets in real-time
AI-powered analysis, technical indicators and real-time price data.
Join Our Telegram Channel
Breaking market news, AI analysis and trading signals instantly.
Join Channel