ETHUSD Trades at $2,154.57: Key Levels Tested Amidst Looming Events
ETHUSD hovers near resistance at $2,154.57. With key economic events on the horizon and technical indicators flashing mixed signals, traders are watching closely.
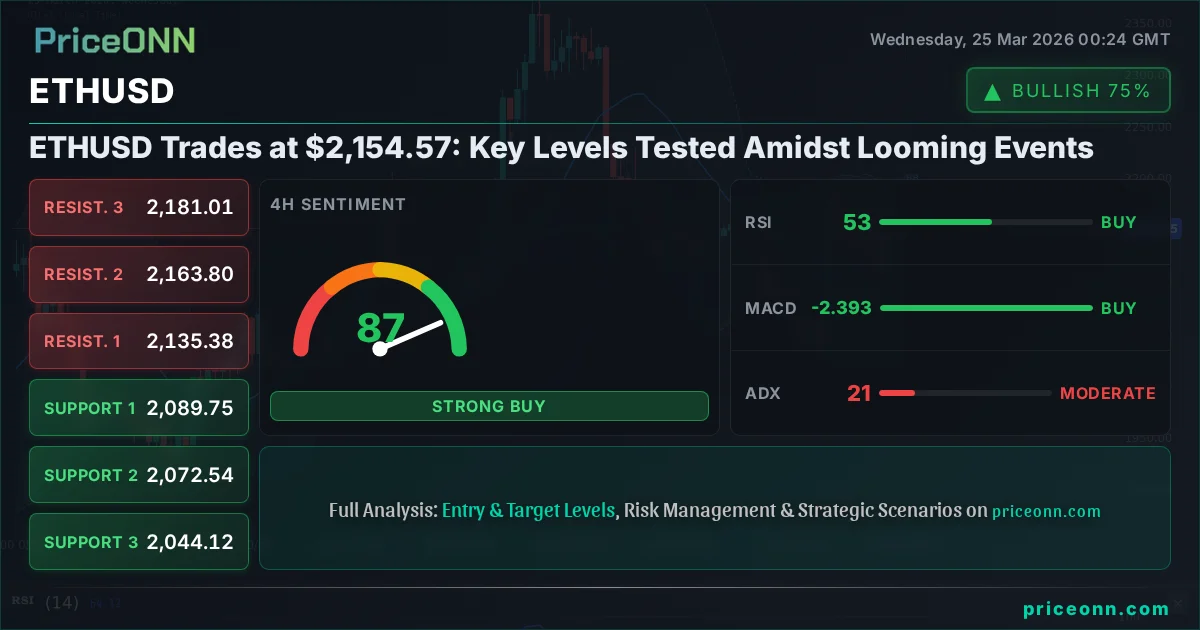
ETHUSD today analysis shows the second-largest cryptocurrency grappling with a critical resistance level at $2,154.57. This juncture, occurring amidst a backdrop of significant global economic events and shifting crypto market sentiment, demands a closer look from traders and investors alike. The current price action suggests a market on tenterhooks, waiting for a catalyst to break the prevailing indecision. Having tracked ETHUSD through its recent volatility, it's clear that the interplay between technical signals and macroeconomic drivers is more complex than ever.
- ETHUSD faces resistance at $2,154.57, with RSI at 67 indicating growing overbought pressure.
- Critical support for ETHUSD is identified at $2,052.26, a level that has held firm in previous tests.
- MACD histogram divergence suggests bullish momentum is fading on the 1H chart, warranting caution.
- Fed rate expectations and DXY movements continue to heavily influence ETHUSD, highlighting its correlation with broader market sentiment.
The cryptocurrency market, particularly Ethereum, is at a fascinating crossroads. After a period of significant upward momentum, ETHUSD is now consolidating near its immediate resistance. The 1-hour chart paints a picture of a strong uptrend, with the ADX at 17.63 indicating a relatively weak trend, suggesting the current move might lack conviction. However, the 4-hour and daily timeframes present a more neutral to bearish outlook, with ADX values of 20.81 and 19.8 respectively, reinforcing the idea that the larger trend is not yet decisively bullish. This divergence across timeframes is precisely where traders need to exercise caution and wait for clearer signals.
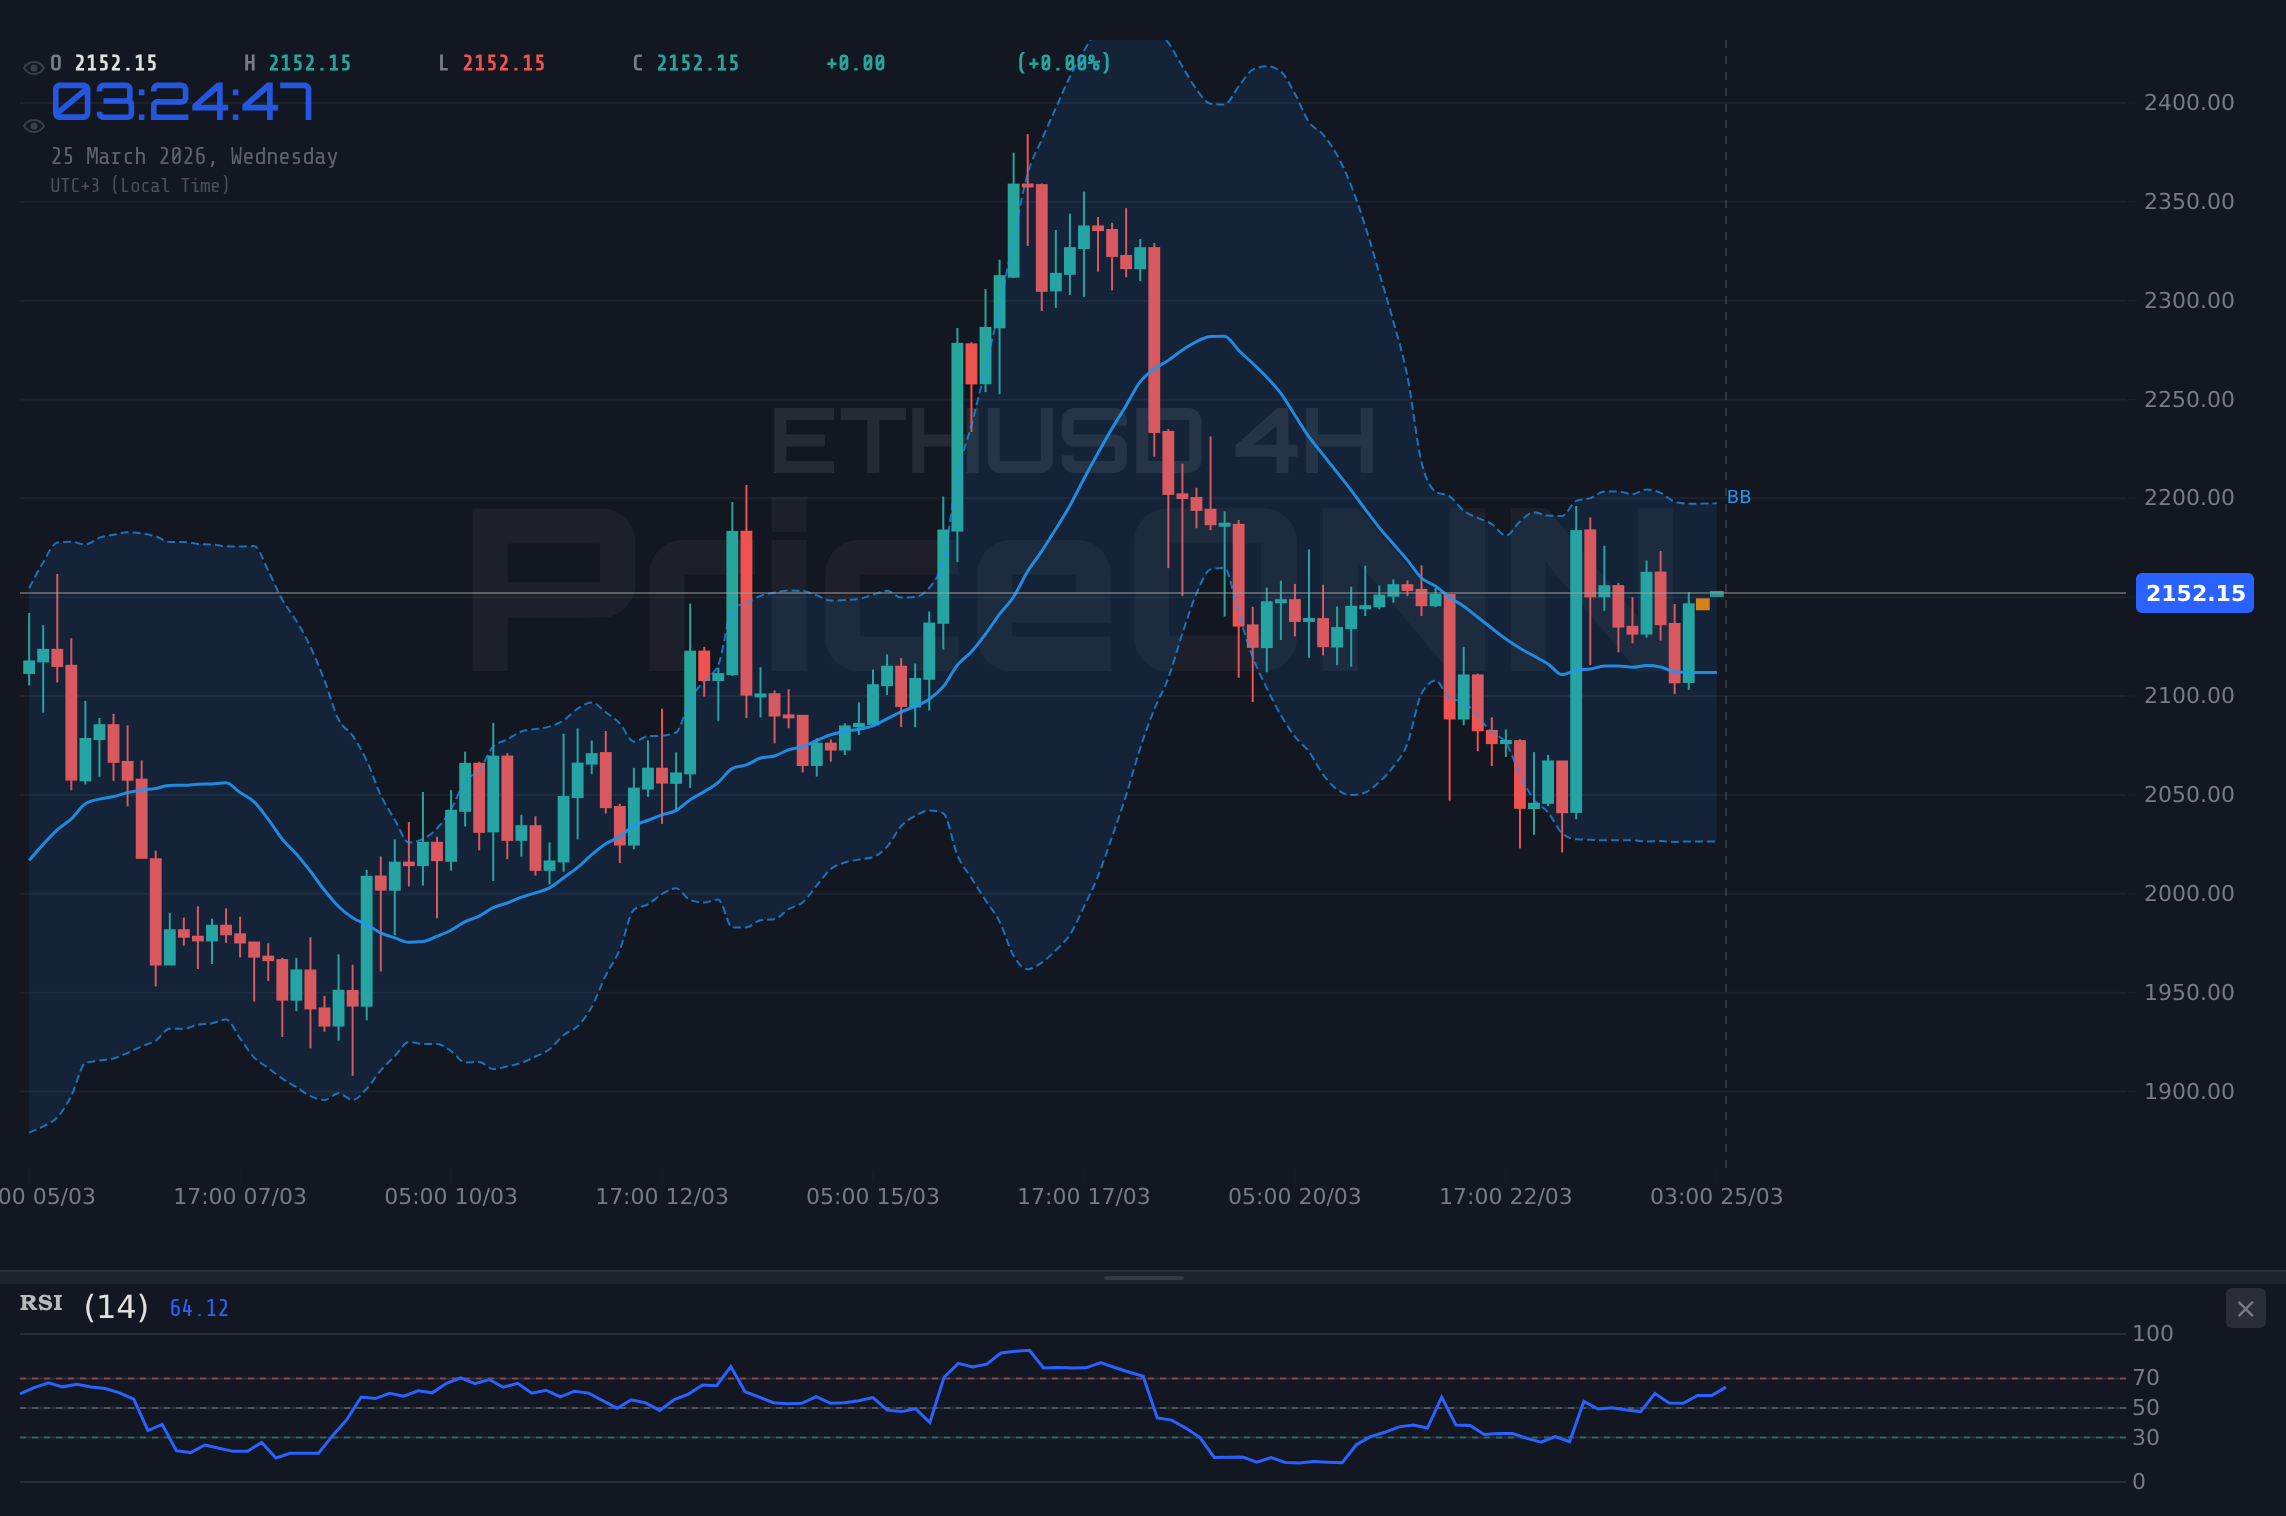
On the 1-hour chart, ETHUSD is showing strong buy signals, with RSI at 57.27 and Stochastic %K crossing above %D. This suggests short-term upward momentum. However, the MACD histogram is negative, indicating that while the price is moving up, the underlying buying pressure might be waning. This conflict between indicators is typical of a market approaching a significant resistance level. The price is currently trading above the middle Bollinger band, hinting at upward pressure, but the proximity to the upper band could signal an overextended move. This short-term bullishness needs to be viewed with caution, especially considering the larger timeframe signals.
Navigating the Resistance at $2,154.57
The immediate resistance level for ETHUSD is clearly defined at $2,154.57. A sustained break and hold above this level on significant volume would be required to signal a continuation of the bullish trend. On the daily chart, the resistance is much higher, with the first major hurdle at $2,227.50. However, the path to $2,227.50 is contingent on decisively overcoming the $2,154.57 mark. Traders looking to enter long positions would ideally want to see a clear breakout above this resistance, followed by a successful retest as support. Without this confirmation, chasing the price higher here carries considerable risk, especially given the mixed signals from longer-term indicators.
Conversely, if ETHUSD fails to break higher and begins to retreat, the immediate support levels come into play. The first significant support on the 1-hour chart is at $2,151.74, followed by $2,136.31. A break below these levels would likely trigger further selling pressure, potentially testing the 4-hour support at $2,089.75. The daily support at $2,052.26 remains a crucial psychological and technical barrier. A close below $2,052.26 on the daily chart would significantly alter the bullish narrative and could signal a deeper correction.
Key Support Level: The $2,052.26 support on the daily chart is paramount. A break below this level would invalidate the current bullish sentiment and open the door for a deeper retracement towards $1,948.96.
Correlation with Macroeconomic Factors: DXY and Fed Expectations
The correlation between ETHUSD and the broader market, especially the US Dollar Index (DXY), remains a critical factor. The DXY is currently trading at 98.95, showing a daily increase of 0.18%. While the 1-hour and 4-hour DXY charts suggest a potential short-term pullback, the daily chart indicates a strong uptrend with ADX at 32.74. This suggests that any significant dollar strength could exert downward pressure on ETHUSD, as seen historically. Investors are closely watching Federal Reserve policy expectations. While the market is pricing in some potential rate cuts later in the year, any hawkish signals or persistent inflation data could strengthen the dollar and dampen risk appetite, impacting cryptocurrencies like Ethereum.
The recent economic calendar data provides further context. The US ISM Manufacturing PMI came in at 52.4, slightly above the forecast of 51.5, indicating expansion in the manufacturing sector. However, the ISM Services PMI was weaker than expected at 51.1 compared to a forecast of 52. However, these figures are not drastically deviating from expectations, meaning the market might be looking for more significant catalysts. Upcoming economic releases, particularly those related to inflation and employment in the US and Europe, will be crucial in shaping the sentiment for risk assets like ETHUSD. The current lack of major deviations in recent high-impact data means that geopolitical events are likely to play a more significant role in price discovery in the short term.
DXY Influence: With the DXY showing resilience and a strong daily uptrend signal, any further dollar strengthening could pressure ETHUSD. Traders should monitor the DXY's movement closely as a leading indicator for risk sentiment.
On-Chain Metrics and Crypto-Specific Developments
Beyond the macro picture, on-chain metrics offer vital insights into Ethereum's internal health. While specific real-time on-chain data like active addresses or whale movements are not provided in the market data, a general trend of increasing network activity often precedes significant price movements. A rising hash rate, for instance, indicates greater network security and miner confidence, which is fundamentally bullish for Ethereum. Conversely, a significant outflow of ETH from exchanges to cold storage wallets can suggest long-term holders are accumulating, reducing immediate selling pressure.
The DeFi and NFT ecosystems also play a crucial role. The Total Value Locked (TVL) in Ethereum-based DeFi protocols is a key indicator of network utility and demand. A rising TVL suggests increased activity and confidence in the Ethereum network. Similarly, the health of the NFT market, reflected in trading volumes and floor prices of major collections, can influence sentiment around ETH. Developments in scalability solutions, such as Layer 2 networks, are also critical for Ethereum's long-term growth, as they aim to reduce transaction fees (gas fees) and increase throughput, making the network more accessible and attractive for users and developers.
Regulatory news continues to be a significant overhang for the cryptocurrency market. Any clarity or, conversely, increased uncertainty surrounding regulations for digital assets, particularly in major economies like the US and EU, can trigger sharp price movements. The recent news about the NYSE partnering with Securitize to launch a 24/7 tokenized securities platform, while not directly about ETH, signals a broader trend towards institutional adoption and integration of blockchain technology, which could indirectly benefit Ethereum as a leading smart contract platform.
Expert Observation
The current consolidation phase for ETHUSD could be interpreted as a healthy pause before a potential upward continuation, provided key support levels hold and the broader market sentiment remains supportive. However, the divergence in technical signals across different timeframes necessitates a cautious approach.
Bitcoin Dominance and Altcoin Correlations
Ethereum’s price action is often influenced by Bitcoin's performance and its dominance in the crypto market. Bitcoin is currently trading at $70,606, showing a slight daily decrease. Bitcoin dominance, which measures its market share relative to the total crypto market cap, is a key factor. When Bitcoin dominance rises, it often indicates that capital is flowing into BTC, potentially at the expense of altcoins like ETH. Conversely, a falling Bitcoin dominance can signal a 'altcoin season' where other cryptocurrencies, including Ethereum, outperform Bitcoin. Currently, with BTC showing some weakness and ETH consolidating, the relationship needs careful monitoring. A strong ETHUSD performance often requires either Bitcoin holding steady or rising modestly, while Bitcoin dominance is stable or falling.
The correlation between ETHUSD and other altcoins is also important. Many altcoins tend to move in tandem with Ethereum, albeit with higher volatility. If ETHUSD breaks out to the upside, it could trigger a broader altcoin rally. However, if it fails at resistance and pulls back, it could drag down other digital assets with it. The current technical signals for ETHUSD suggest a potential for a short-term bounce, but the sustainability of this move will likely depend on broader crypto market trends and Bitcoin's ability to hold its ground or move higher.
Trade Scenarios for ETHUSD
Bearish Scenario: Resistance Holds Firm
40% ProbabilityNeutral Scenario: Consolidation Near Resistance
35% ProbabilityBullish Scenario: Resistance Breakout
25% ProbabilityFrequently Asked Questions: ETHUSD Analysis
What happens if ETHUSD fails to break above the $2,154.57 resistance level?
If ETHUSD fails to break above $2,154.57, we could see a pullback towards the $2,089.75 support level on the 4-hour chart. A further break below $2,052.26 on the daily chart would invalidate the immediate bullish outlook.
Should I buy ETHUSD at current levels of $2,154.57 given the RSI at 67?
Buying ETHUSD precisely at $2,154.57 resistance with RSI at 67 would be a high-risk trade. A more prudent approach would be to wait for a confirmed breakout above $2,154.57, ideally with a retest of this level as support, or to consider buying on a dip towards the $2,052.26 support if risk management is prioritized.
Is the MACD histogram divergence a sell signal for ETHUSD at $2,154.57?
The negative MACD histogram on the 1-hour chart, despite upward price movement, suggests waning bullish momentum. While not a direct sell signal, it indicates caution is warranted near resistance, as the momentum might not be strong enough to sustain a breakout.
How will the upcoming US economic data affect ETHUSD this week, given the DXY is at 98.95?
Upcoming US economic data releases, particularly inflation and employment figures, could significantly impact the DXY, which is currently at 98.95 with a daily uptrend. Stronger-than-expected data could boost the dollar, potentially pressuring ETHUSD lower, while weaker data might support risk assets like ETHUSD if it leads to a less hawkish Fed stance.
Technical Outlook Summary
| Indicator | Value | Signal | Interpretation |
|---|---|---|---|
| RSI (14) | 67.36 | Neutral | Approaching overbought territory, caution advised near resistance. |
| MACD Histogram | -0.99 | Bearish | Suggests weakening bullish momentum on the 1H chart. |
| Stochastic | K:80.27, D:45.62 | Bullish | Short-term bullish crossover, but RSI is high. |
| ADX | 17.63 | Neutral | Indicates a weak trend on the 1H timeframe; breakout confirmation needed. |
| Bollinger Bands | Upper Band | Watch | Price is near the upper band, suggesting potential for reversal or consolidation. |
Key Levels for ETHUSD
Support Levels
Resistance Levels
Track markets in real-time
AI-powered analysis, technical indicators and real-time price data.
Join Our Telegram Channel
Breaking market news, AI analysis and trading signals instantly.
Join Channel