BTCUSD Trades Near $70,917: Bullish Momentum Builds
BTCUSD hovers around $70,917 as positive momentum indicators suggest a potential continuation of the bullish trend. Key levels to watch include support at $70,570 and resistance at $70,947.
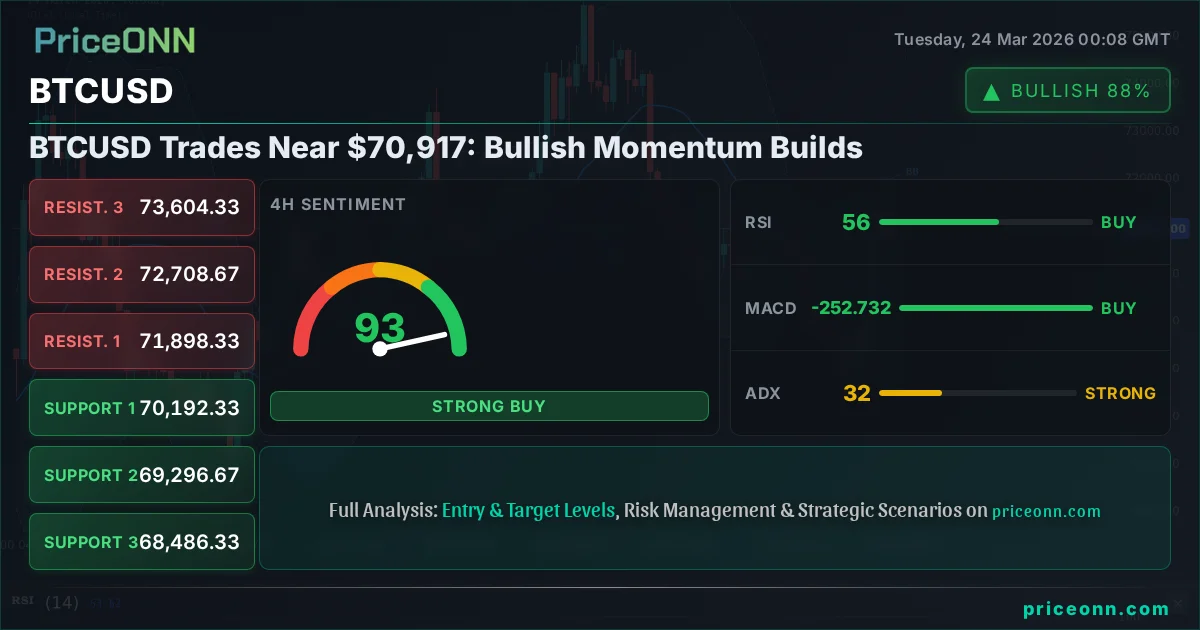
Bitcoin, the undisputed king of cryptocurrencies, is currently navigating the crucial price territory around $70,917. After a significant surge of 4.44% ($3,014) in the last 24 hours, pushing its range from $67,448 to $71,813, the digital asset is demonstrating robust bullish momentum. This price action is not just a fleeting spike; it's occurring within a broader context of increasing positive signals across multiple timeframes, suggesting that the upward trajectory could be sustained. As traders and investors eye this critical juncture, understanding the underlying technical and potential fundamental drivers becomes paramount to deciphering Bitcoin's next move. The question on everyone's mind is whether this current price level will act as a springboard for further gains or if it represents a temporary pause before a more significant correction.
- BTCUSD is trading near $70,917, showing strong bullish momentum with a 4.44% daily gain.
- Key support is identified at $70,570.67, while resistance looms around $70,947.67 on the 1-hour chart.
- The 1-hour RSI is at 60.5, indicating bullish sentiment, though Stochastic shows a potential dip.
- The 1-day chart shows positive momentum with MACD above its signal line, though ADX suggests a moderate trend.
- Institutional adoption trends and crypto-specific news, such as potential large Bitcoin treasury allocations, are key fundamental factors to monitor.
The 1-hour technical indicators for BTCUSD paint a picture of cautious optimism, reflecting the current price consolidation around $70,917. The Relative Strength Index (RSI) at 60.5 suggests that while the momentum is bullish, it's not yet in extreme overbought territory, leaving room for further upside. However, a conflicting signal emerges from the Stochastic oscillator, where the %K line (45.14) is below the %D line (61.16), hinting at a potential short-term pullback or a period of consolidation. The MACD indicator remains in positive territory, with its histogram above the signal line, reinforcing the bullish bias on this shorter timeframe. The Average Directional Index (ADX) at 27.96 signifies a strong uptrend, which aligns with the recent price action. This mixed signal on the shortest timeframe indicates that while the overall sentiment is positive, traders should be mindful of potential minor reversals or sideways movements as Bitcoin digests its recent gains near the $70,917 mark.
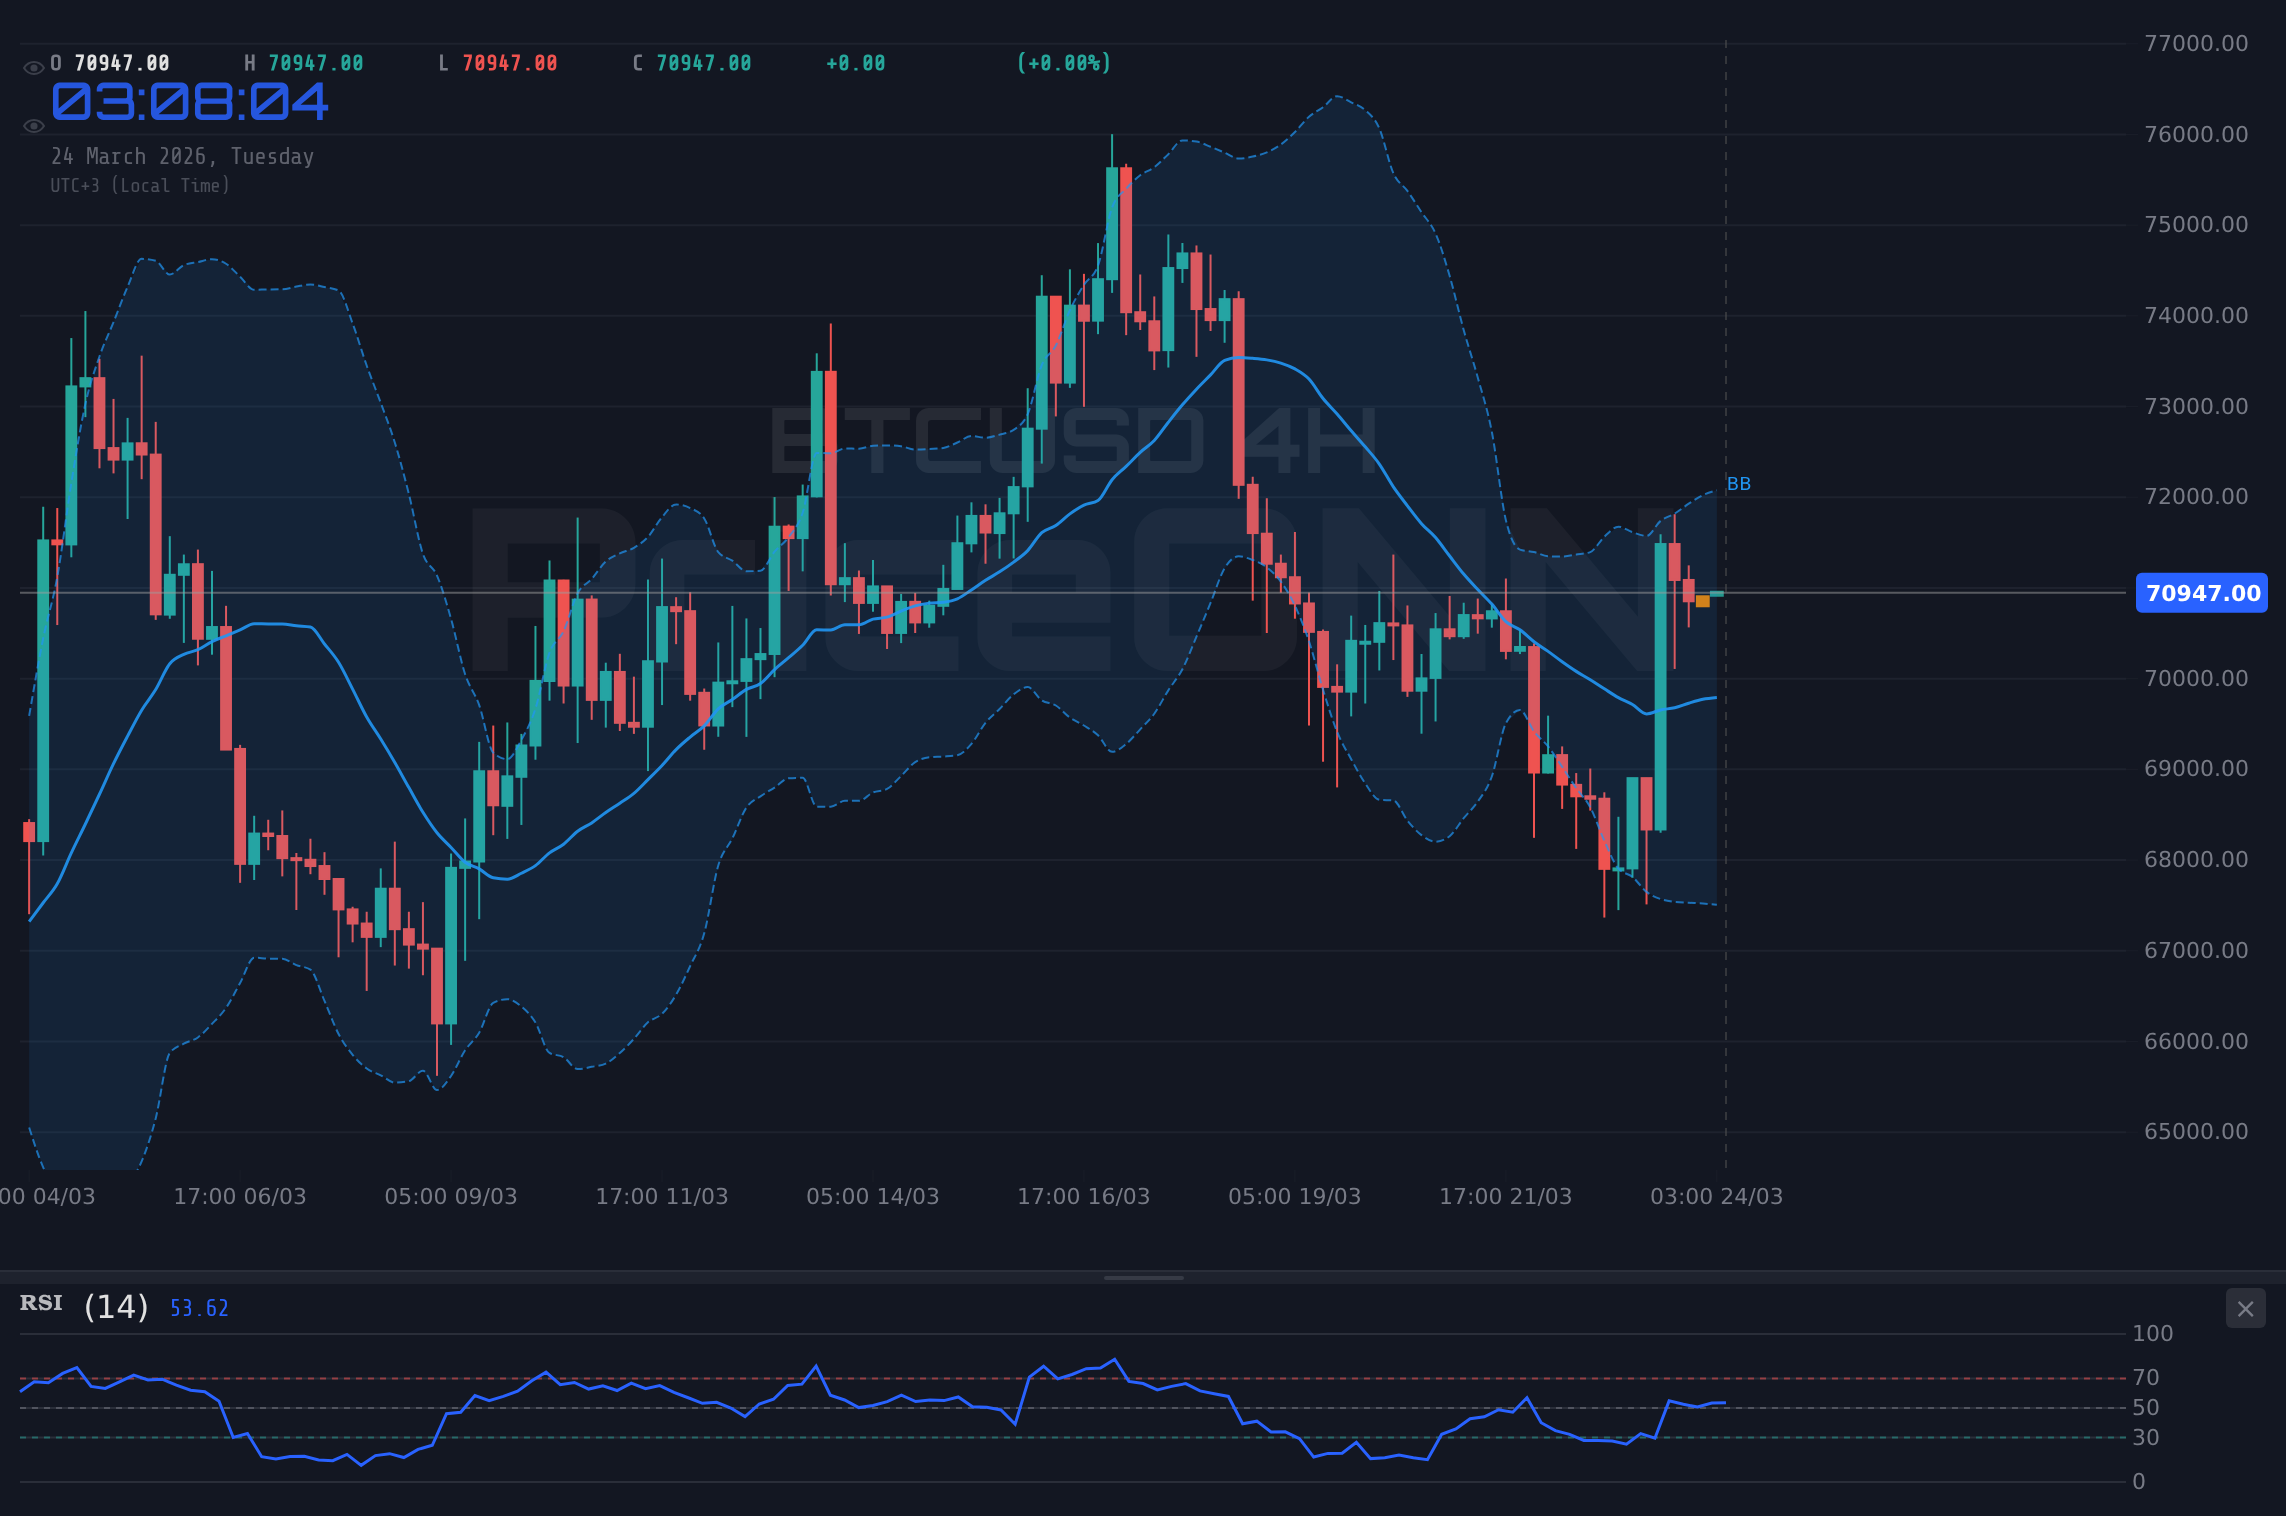
Moving to the 4-hour timeframe, the bullish narrative for BTCUSD gains further traction. The RSI at 55.62 remains comfortably in neutral territory, leaning towards bullish, and the MACD continues to display positive momentum with its histogram crossing above the signal line. This suggests that the upward pressure is being sustained over a slightly longer period. The Stochastic oscillator here presents a strong bullish signal, with %K at 87.01 significantly above %D at 48.45, indicating robust buying interest and potentially heading towards overbought conditions. The ADX at 32.33 reinforces the presence of a strong uptrend. This confluence of factors on the 4-hour chart suggests that the market is leaning towards further upside, with the $70,917 level potentially serving as a base for another leg higher. The strong bullish signals from the Stochastic oscillator, in particular, warrant attention, as they often precede significant price movements.
The daily chart provides the broader perspective, and here, the signals for BTCUSD are also predominantly positive, though with nuances. The RSI at 51.02 hovers around the midpoint, indicating a neutral-to-bullish stance, suggesting ample room for growth before hitting overbought conditions. The MACD, while showing positive momentum, is positioned above its signal line, which is a classic bullish signal, implying that the underlying trend is still upward. However, the ADX at 20.13 indicates a moderately strong uptrend, suggesting that while the trend is in place, it might not be as aggressive as seen on shorter timeframes. The Stochastic oscillator on the daily chart is showing a bearish signal with %K (22.94) below %D (35.65), suggesting that the recent upward push might face some headwinds or a period of consolidation before the next significant move. Despite this stochastic divergence, the overall daily picture remains constructive, especially considering the bullish signals from the MACD and the RSI hovering above 50.
Key Levels and Price Action Near $70,917
The immediate price action around the $70,917 level is critical. On the 1-hour chart, immediate support is seen at $70,570.67, followed by $70,358.33. A break below these levels could signal a short-term pullback. Conversely, resistance is present at $70,947.67, and a decisive move above this level, supported by strong volume, could propel BTCUSD towards higher targets. The 4-hour support sits at $70,192.33, and breaking below this would challenge the immediate bullish thesis. Resistance on this timeframe is at $71,898.33, a level that needs to be breached for further significant upside. On the daily chart, the key support level to watch is $66,716.67. Holding this level is crucial for maintaining the overall bullish structure. Resistance on the daily chart is more substantial, with the next significant hurdle appearing at $69,738.67, and further up at $71,574.33. A sustained move above these daily resistance levels would confirm the continuation of the bullish trend.
The Role of Institutional Adoption and Crypto-Specific Developments
Beyond the technical charts, the health of the broader cryptocurrency ecosystem plays a vital role in BTCUSD's price action. Recent news highlights continued institutional interest, such as Boyaa Interactive's potential $70 million Bitcoin treasury allocation. This move, if it materializes, signals a growing confidence among traditional companies in Bitcoin as a store of value and a potential hedge against inflation. Such allocations can significantly influence market sentiment and provide a fundamental underpinning for price appreciation. Furthermore, the development of AI agents managing crypto wallets, as seen with MoonPay's new standard, points towards innovation that could streamline user experience and potentially increase adoption. While not directly impacting price today, these advancements lay the groundwork for future growth.
Regulatory news also remains a constant factor in the crypto space. While specific regulatory developments impacting Bitcoin directly haven't dominated headlines in the last 48 hours, the general regulatory landscape is always under scrutiny. Any shifts in stance from major economies or clarifications on existing frameworks can introduce volatility. For instance, reports of potential scams originating from simple text messages highlight the ongoing need for robust security and regulatory oversight within the digital asset space. The H100 Group's potential acquisition, which could make it Europe's second-largest Bitcoin treasury holder, further underscores the trend of institutional accumulation, providing a fundamental demand driver for Bitcoin that complements the technical bullish signals currently observed around the $70,917 level.
The correlation between Bitcoin and traditional markets, particularly equities, remains a key consideration. While the S&P 500 and Nasdaq are showing mixed signals – with 1-hour and 4-hour charts suggesting some weakness despite a bullish 1-hour trend – BTCUSD's recent performance indicates a potential decoupling or a different underlying driver. The DXY (Dollar Index) is currently experiencing a slight dip, trading around 98.99. Historically, a weaker dollar tends to be supportive of risk assets like Bitcoin, as it can reduce the purchasing power of fiat currencies and make dollar-denominated assets relatively more attractive. This inverse correlation, if it holds, could provide an additional tailwind for BTCUSD as it consolidates near $70,917, especially if the dollar continues its downward trend.
On-chain metrics offer further insight into Bitcoin's underlying health. While specific data points like active addresses or whale movements weren't provided in the market context, generally, sustained high network activity and accumulation by large holders (whales) are bullish indicators. If exchange flows show a net outflow of Bitcoin, it suggests that investors are moving their holdings to private wallets for long-term holding, reducing selling pressure. Similarly, a strong hash rate indicates network security and miner confidence, which is fundamentally positive for Bitcoin. These on-chain fundamentals, when aligned with positive technical signals around $70,917, can strengthen the conviction behind a bullish outlook.
Trade Stance and Forward-Looking View
Given the current technical and fundamental landscape, the primary stance leans towards bullish, but with a strong emphasis on risk management. The confluence of positive signals across multiple timeframes, particularly the 4-hour and 1-hour charts, suggests that the upward momentum is likely to continue. The key level to watch is the immediate resistance around $70,947.67. A decisive breakout above this level, accompanied by increased volume and positive on-chain activity, would strengthen the case for a move towards higher targets. The support at $70,570.67 needs to hold firm; a break below this could signal a short-term reversal, invalidating the immediate bullish setup.
The trade recommendation is therefore in a 'WATCH_ZONE'. This means that while the setup is leaning bullish, confirmation is needed before initiating new positions. A daily close above the $70,947.67 resistance level would be a significant trigger, opening the door for a potential move towards the next resistance at $71,112.33 and subsequently $71,324.67. Traders should look for confirmation through increased trading volume and sustained price action above these levels. Alternatively, a failure to break above $70,947.67, coupled with a break below the $70,570.67 support, could signal a bearish turn, with potential downside targets towards $70,358.33 and even $70,193.67. Patience is key here; waiting for the market to provide a clear direction after consolidating around $70,917 is crucial for a favorable risk-reward ratio.
Bearish Scenario: Consolidation Below Resistance
30% ProbabilityNeutral Scenario: Sideways Consolidation
35% ProbabilityBullish Scenario: Breakout Above Resistance
35% ProbabilityFrequently Asked Questions: BTCUSD Analysis
What happens if BTCUSD breaks decisively above the $70,947.67 resistance level?
A sustained break above $70,947.67, especially with increasing volume, would validate the bullish scenario. This could trigger a move towards the next resistance levels at $71,112.33 and potentially $71,324.67, indicating continued upward momentum.
Should I buy BTCUSD at current levels around $70,917 given the mixed signals?
Given the mixed signals on shorter timeframes and the 'WATCH_ZONE' recommendation, caution is advised. Waiting for a clear breakout above $70,947.67 or a confirmation of support holding at $70,570.67 would offer a better risk-reward setup. A daily close above resistance would be a strong buy signal.
Is the RSI at 60.5 a strong buy signal for BTCUSD right now?
An RSI of 60.5 on the 1-hour chart indicates bullish sentiment but is not yet in extreme overbought territory. While positive, it's not a standalone buy signal. It should be considered alongside other indicators and price action, especially the stochastic's conflicting signal.
How might upcoming institutional Bitcoin treasury allocations affect BTCUSD price near $70,917?
Positive news regarding institutional adoption, such as Boyaa Interactive's potential $70 million allocation, can provide a fundamental tailwind for BTCUSD. Such developments can boost market sentiment and attract further investment, potentially helping to break through resistance levels like $70,947.67.
| Indicator | Value | Signal | Interpretation |
|---|---|---|---|
| RSI (14) | 60.5 | Bullish | Positive momentum, not yet overbought. |
| MACD | Positive | Bullish | Momentum above signal line. |
| Stochastic | K=45.14, D=61.16 | Bearish Divergence | %K below %D, potential short-term pullback. |
| ADX | 27.96 | Strong Trend | Indicates a strong uptrend on 1H. |
| Bollinger Bands | Above Mid Band | Bullish Bias | Price trading above the middle band. |
Märkte in Echtzeit verfolgen
KI-gestützte Analyse und Echtzeit-Preisdaten.
Treten Sie unserem Telegram-Kanal bei
Aktuelle Marktnachrichten und KI-Analysen sofort.
Kanal beitreten