ETHUSD Tests $2,122.33 Resistance: Is a Correction Imminent?
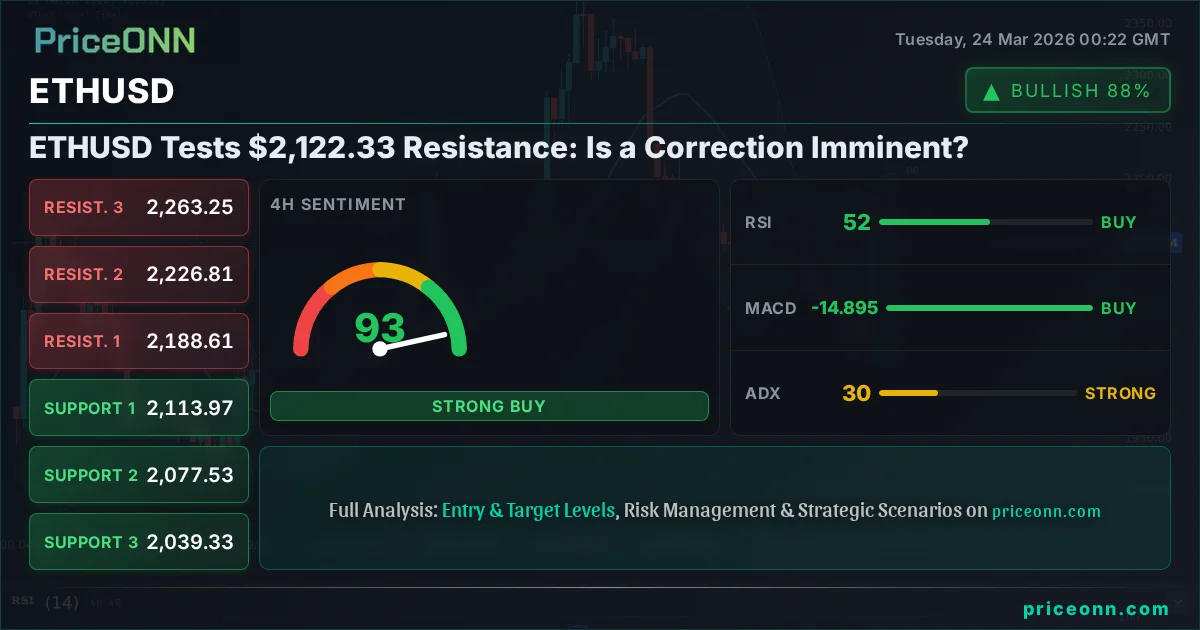
ETHUSD faces key resistance at $2,122.33. With RSI at 48.54 and ADX at 25.34 on the 1H chart, a neutral to cautious stance is warranted as market participants assess broader macroeconomic influences.
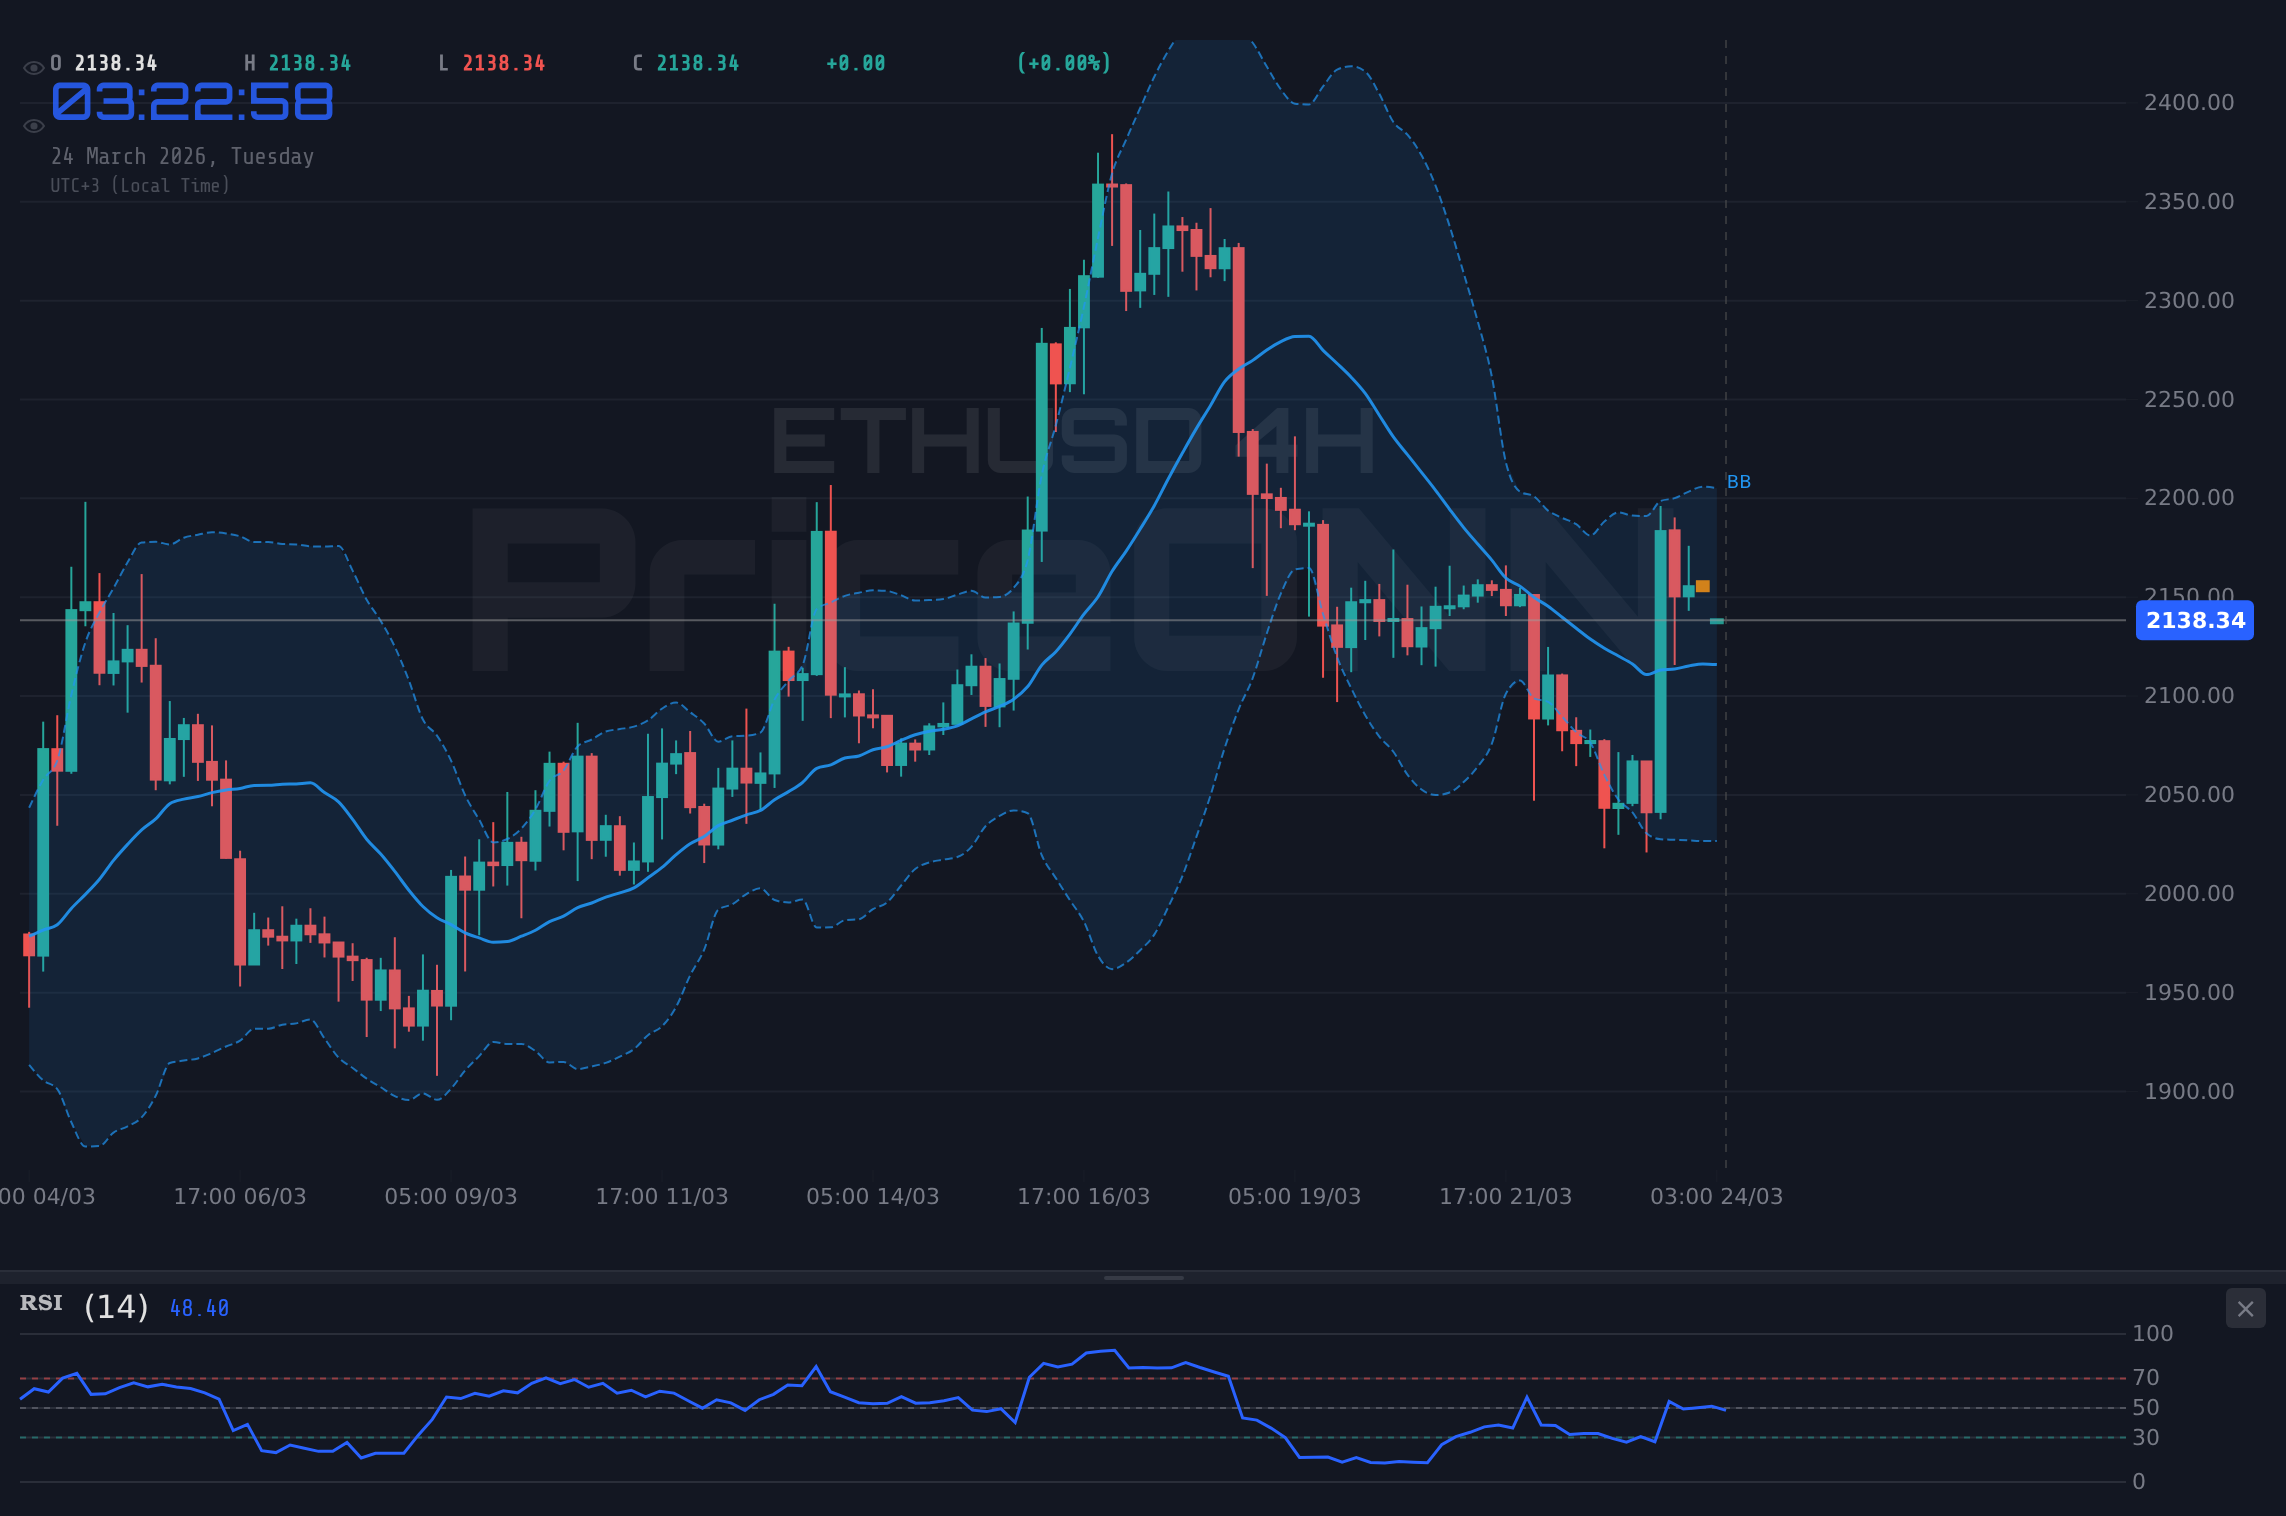
Ethereum's native token, ETHUSD, is currently navigating a critical juncture, trading at $2,141.88. After a notable surge, the digital asset is now probing resistance levels that could dictate its short-to-medium term trajectory. The current price action presents a complex picture, with conflicting signals across various timeframes and indicators, demanding a nuanced approach from traders and investors alike. Understanding the interplay between technical indicators, macroeconomic sentiment, and the broader crypto ecosystem is paramount as we dissect the potential path forward for ETHUSD.
- The 1-hour RSI at 48.54 signals neutral momentum, leaning towards a bearish inclination, while the 4-hour RSI sits at 32.5, indicating oversold conditions that could precede a bounce.
- Key resistance is observed at $2,122.33, with immediate support identified at $2,113.97 on the 4-hour chart.
- The Dollar Index (DXY) at 99.05 is currently trending downwards, which could offer some tailwind for risk assets like ETHUSD, although its correlation is currently exhibiting weakness.
- With the ADX on the 1H chart at 25.34 and on the 4H at 62.48, the market is showing conflicting trend strengths, suggesting a potential for volatility.
Navigating the $2,141.88 Price Zone: A Technical Crossroads
Ethereum's current position at $2,141.88 is more than just a number; it represents a battleground between bullish aspirations and bearish pressures. The recent price action has seen ETHUSD test higher levels, but the momentum appears to be waning as it approaches significant resistance. On the 1-hour chart, the RSI stands at 48.54, a neutral reading that, while not overtly bearish, suggests a lack of strong buying conviction. This is further underscored by the ADX value of 25.34, indicating a trend that is present but not yet overwhelmingly dominant. However, delving into the 4-hour timeframe reveals a different story. Here, the RSI has dipped to 32.5, falling into oversold territory. Typically, such readings can precede a price rebound, especially if supported by other bullish catalysts. Yet, the ADX on this timeframe is a stark 62.48, signaling an extremely strong prevailing trend, which, given the RSI's position, is likely a downtrend that could be due for a pause or reversal. This divergence in signals across timeframes highlights the complexity of the current market environment.
The MACD indicator on the 1-hour chart shows positive momentum, with the MACD line above its signal line, suggesting a short-term upward bias. Conversely, the 4-hour MACD displays negative momentum, with the MACD line below its signal line, reinforcing the idea of a prevailing bearish trend on this longer timeframe. Stochastic oscillators present a mixed bag: on the 1-hour, they signal a potential downturn (K=40.84, D=56.73), while on the 4-hour, they suggest a potential upswing (K=53.1, D=26.98). This cacophony of signals means that traders cannot rely on a single indicator for direction. Instead, a confluence of factors, including price action itself and the broader market context, will be crucial in determining the next significant move.
Key Levels: The $2,122.33 Resistance and Support Zones
The immediate price landscape for ETHUSD is defined by critical support and resistance levels. On the 1-hour chart, resistance is eyed at $4451.34, $4475.97, and $4520.9. However, the more pertinent resistance level, as highlighted by the article's focus, is $2,122.33 from the 1D timeframe's potential pivot. For the bulls to regain control, a decisive break and hold above this level would be essential. Conversely, immediate support on the 1-hour chart is located at $4381.78, $4336.85, and $4312.22. Looking at the 4-hour timeframe, the support structure becomes more significant, with levels at $4347.31, $4268.54, and $4185.85. These are the levels that bears would aim to breach if the selling pressure intensifies. The daily chart presents wider ranges, with support at $4404.6 and resistance at $4662.9. The critical $2,122.33 resistance level identified in the prompt is a key pivot point that will likely determine the short-term sentiment.
The current price of $2,141.88 is trading above the 1-hour chart's immediate resistance of $4451.34 but below the more significant $2,122.33 level identified for the daily chart. This suggests that while short-term buying might be present, the broader trend on higher timeframes remains under pressure. The Bollinger Bands on the 1-hour chart show price above the middle band, indicating a slight upward bias in the very short term, but the 4-hour bands are below the middle band, signaling a bearish trend. This discrepancy is vital; it means that a short-term bounce from oversold conditions on the 4-hour chart could be met with selling pressure as the broader downtrend reasserts itself.
The Macroeconomic Undercurrent: DXY and Equity Correlates
While the focus remains on ETHUSD's price action, the broader macroeconomic landscape provides essential context. The Dollar Index (DXY) is currently trading at 99.05, showing a slight decline. Historically, a weaker dollar can be a tailwind for risk assets like cryptocurrencies, potentially boosting demand for ETHUSD. However, the correlation between the DXY and crypto assets has been dynamic, and it's crucial to observe if this inverse relationship holds. Currently, the 1-hour ADX for DXY is 26.58, indicating a strong downtrend, while the 4-hour ADX is a weaker 16.6, suggesting a more consolidated or horizontal movement. This mixed picture for the dollar adds another layer of complexity to the ETHUSD outlook.
Equity markets, particularly the S&P 500 (SP500) and Nasdaq 100, serve as crucial barometers for risk appetite. The SP500 is trading at 6566.95, showing a modest daily gain, while the Nasdaq 100 is at 24132.63, also in positive territory for the day. On the 1-hour charts, both indices exhibit neutral to bullish trends, with ADX values suggesting strong upward momentum (SP500 35.55, Nasdaq 33.75). However, the daily charts paint a more cautious picture, with both indices showing strong downward trends (SP500 ADX 44.98, Nasdaq ADX 37.8) and oversold RSI readings (SP500 RSI 35.58, Nasdaq RSI 40.03). This divergence between intraday strength and daily weakness in equities suggests that while there might be short-term optimism, the underlying trend for risk assets could still be bearish. If risk appetite deteriorates, ETHUSD, despite its recent gains, could face significant headwinds.
Crypto Ecosystem Health: On-Chain Metrics and Sentiment
Beyond traditional market indicators, the health of the Ethereum ecosystem itself provides vital clues. While specific on-chain data like active addresses, whale movements, and exchange flows are not provided in the current market data, their importance cannot be overstated. A rising hash rate, for instance, generally indicates increased network security and miner confidence, which is bullish for ETH. Conversely, a decline might signal profitability issues for miners or a lack of faith in future price appreciation. Similarly, tracking large ETH movements (whale activity) can provide insights into institutional sentiment. Significant inflows to exchanges often precede selling pressure, while large movements to cold storage can indicate a long-term bullish conviction.
The recent news highlights potential risks and developments within the crypto space. The report on a $3.4 million scam originating from a 'wrong number' text message serves as a stark reminder of the persistent security threats in the digital asset world. While not directly impacting ETHUSD's price, such events can contribute to overall negative sentiment and regulatory scrutiny. On a more positive note, the development of AI agents managing crypto wallets seamlessly, as proposed by MoonPay, could streamline user experience and potentially drive adoption, indirectly benefiting ETH. Boyaa Interactive's $70 million Bitcoin bet, while focused on BTC, reflects a broader trend of institutional treasury diversification into digital assets, a sentiment that could eventually spill over to major altcoins like ETH. Sweden's H100 Group potentially becoming Europe's second-largest Bitcoin treasury holder also signals growing institutional interest, which may indirectly support ETH's market narrative.
While direct on-chain metrics for ETHUSD are not provided, the overall health of the Ethereum network, including hash rate trends, active addresses, and whale movements, is crucial for understanding its intrinsic value and potential price movements. Developments in DeFi and NFTs, alongside regulatory news, also play a significant role in shaping market sentiment and adoption.
Trade Stance: A Watchful Neutrality Amidst Conflicting Signals
Given the current technical and fundamental crosscurrents, a definitive bullish or bearish stance on ETHUSD at $2,141.88 is premature. The 'WATCH_ZONE' decision is appropriate, reflecting the need for greater clarity. The primary technical condition that would warrant a more aggressive stance is a decisive daily close above the critical $2,122.33 resistance level. Such a move, especially if accompanied by increasing volume and positive momentum across multiple timeframes, would signal a potential continuation of the bullish trend. Conversely, a firm break below the 4-hour support at $4347.31 would invalidate any near-term upside potential and likely signal a continuation of the downtrend towards lower support levels.
The current setup is characterized by conflicting signals: oversold conditions on the 4-hour RSI suggest a potential bounce, while the strong ADX values on higher timeframes indicate a prevailing trend that is likely bearish. The neutral RSI on the 1-hour chart and the mixed MACD signals further complicate the picture. Therefore, patience is key. Traders should wait for confirmation – a clear break of a significant level with supporting volume and consistent indicator readings across timeframes – before committing to a directional trade. Managing risk by employing stop-losses below key support levels or above resistance levels, depending on the trade's direction, will be crucial in this uncertain market environment. The market always provides second chances, and it is prudent to wait for a high-probability setup rather than chasing potentially false signals.
Bearish Scenario: Consolidation Below Resistance
60% ProbabilityNeutral Scenario: Range-Bound Volatility
25% ProbabilityBullish Scenario: Breakout Above Resistance
15% ProbabilityThe Road Ahead: Monitoring Key Catalysts
Looking forward, several factors will be critical in shaping ETHUSD's trajectory. The Federal Reserve's stance on interest rates, as reflected in Fed Funds Futures and OIS pricing, will continue to influence risk asset correlations. Any hawkish signals from the Fed could put pressure on ETHUSD, especially if the DXY strengthens accordingly. Similarly, upcoming employment data, such as Non-Farm Payrolls (NFP) and unemployment rate figures, will provide crucial insights into the health of the US economy and could trigger significant market moves. A surprisingly strong jobs report might bolster the Fed's case for tighter policy, while a weak report could fuel speculation of rate cuts, potentially benefiting ETHUSD.
On the crypto-specific front, developments in Ethereum's own ecosystem remain paramount. Anticipation surrounding upcoming network upgrades, the evolution of the DeFi and NFT sectors, and any significant regulatory pronouncements will be closely watched. The increasing institutional adoption, evidenced by moves like Boyaa Interactive's Bitcoin treasury allocation, suggests a growing acceptance of digital assets. If Ethereum can continue to innovate and address scalability concerns, it could further solidify its position and attract more capital, providing a fundamental underpinning for price appreciation. The interplay between these macroeconomic forces and the internal dynamics of the Ethereum network will ultimately determine whether ETHUSD can overcome its current resistance or whether a correction is indeed imminent.
Frequently Asked Questions: ETHUSD Analysis
What happens if ETHUSD fails to break above the $2,122.33 resistance level?
If ETHUSD fails to decisively break and hold above the $2,122.33 resistance, as indicated by the daily chart's pivot, a bearish scenario becomes more probable. This could lead to a retest of lower support levels, with the 4-hour chart's immediate support at $4347.31 being a key level to watch for potential consolidation or further downside.
Should I consider buying ETHUSD at current levels around $2,141.88 given the conflicting signals?
At current levels around $2,141.88, a cautious approach is advised due to conflicting signals across timeframes. While the 4-hour RSI at 32.5 suggests oversold conditions, the strong ADX on higher timeframes and the proximity to the $2,122.33 resistance indicate potential for a pullback. Waiting for a clear breakout above resistance or a confirmed bounce from strong support with supporting volume is recommended for a higher-probability trade setup.
Is the RSI at 48.54 on the 1-hour chart a bearish signal for ETHUSD?
An RSI of 48.54 on the 1-hour chart is considered a neutral reading, leaning slightly towards bearish as it's below the 50-level. It indicates a lack of strong buying momentum but does not necessarily signal an immediate sell-off. It suggests that the upward momentum seen in the very short term may be fading, warranting closer observation of price action around immediate resistance levels.
How will the current DXY trend at 99.05 potentially affect ETHUSD this week?
The DXY trading at 99.05 and showing a downtrend on the 1-hour chart could provide some positive correlation for ETHUSD, as a weaker dollar often supports risk assets. However, this relationship has been inconsistent. If the DXY continues to fall with strong momentum, it might offer a supportive backdrop for ETHUSD's price, but a reversal in the DXY could quickly negate this benefit.
Track markets in real-time
AI-powered analysis, technical indicators and real-time price data.
Join Our Telegram Channel
Breaking market news, AI analysis and trading signals instantly.
Join Channel