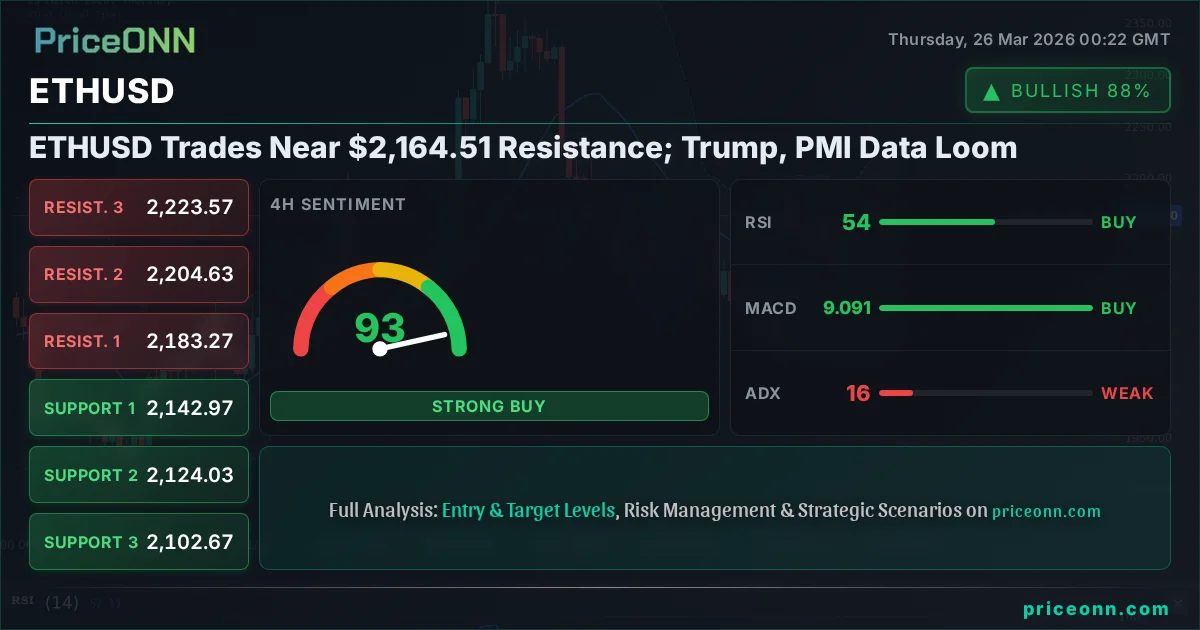
ETHUSD Trades Near $2,164.51 Resistance; Trump, PMI Data Loom
ETHUSD hovers near $2,164.51 resistance amid mixed signals. Key US PMI data and potential Trump-related news events are on the horizon.
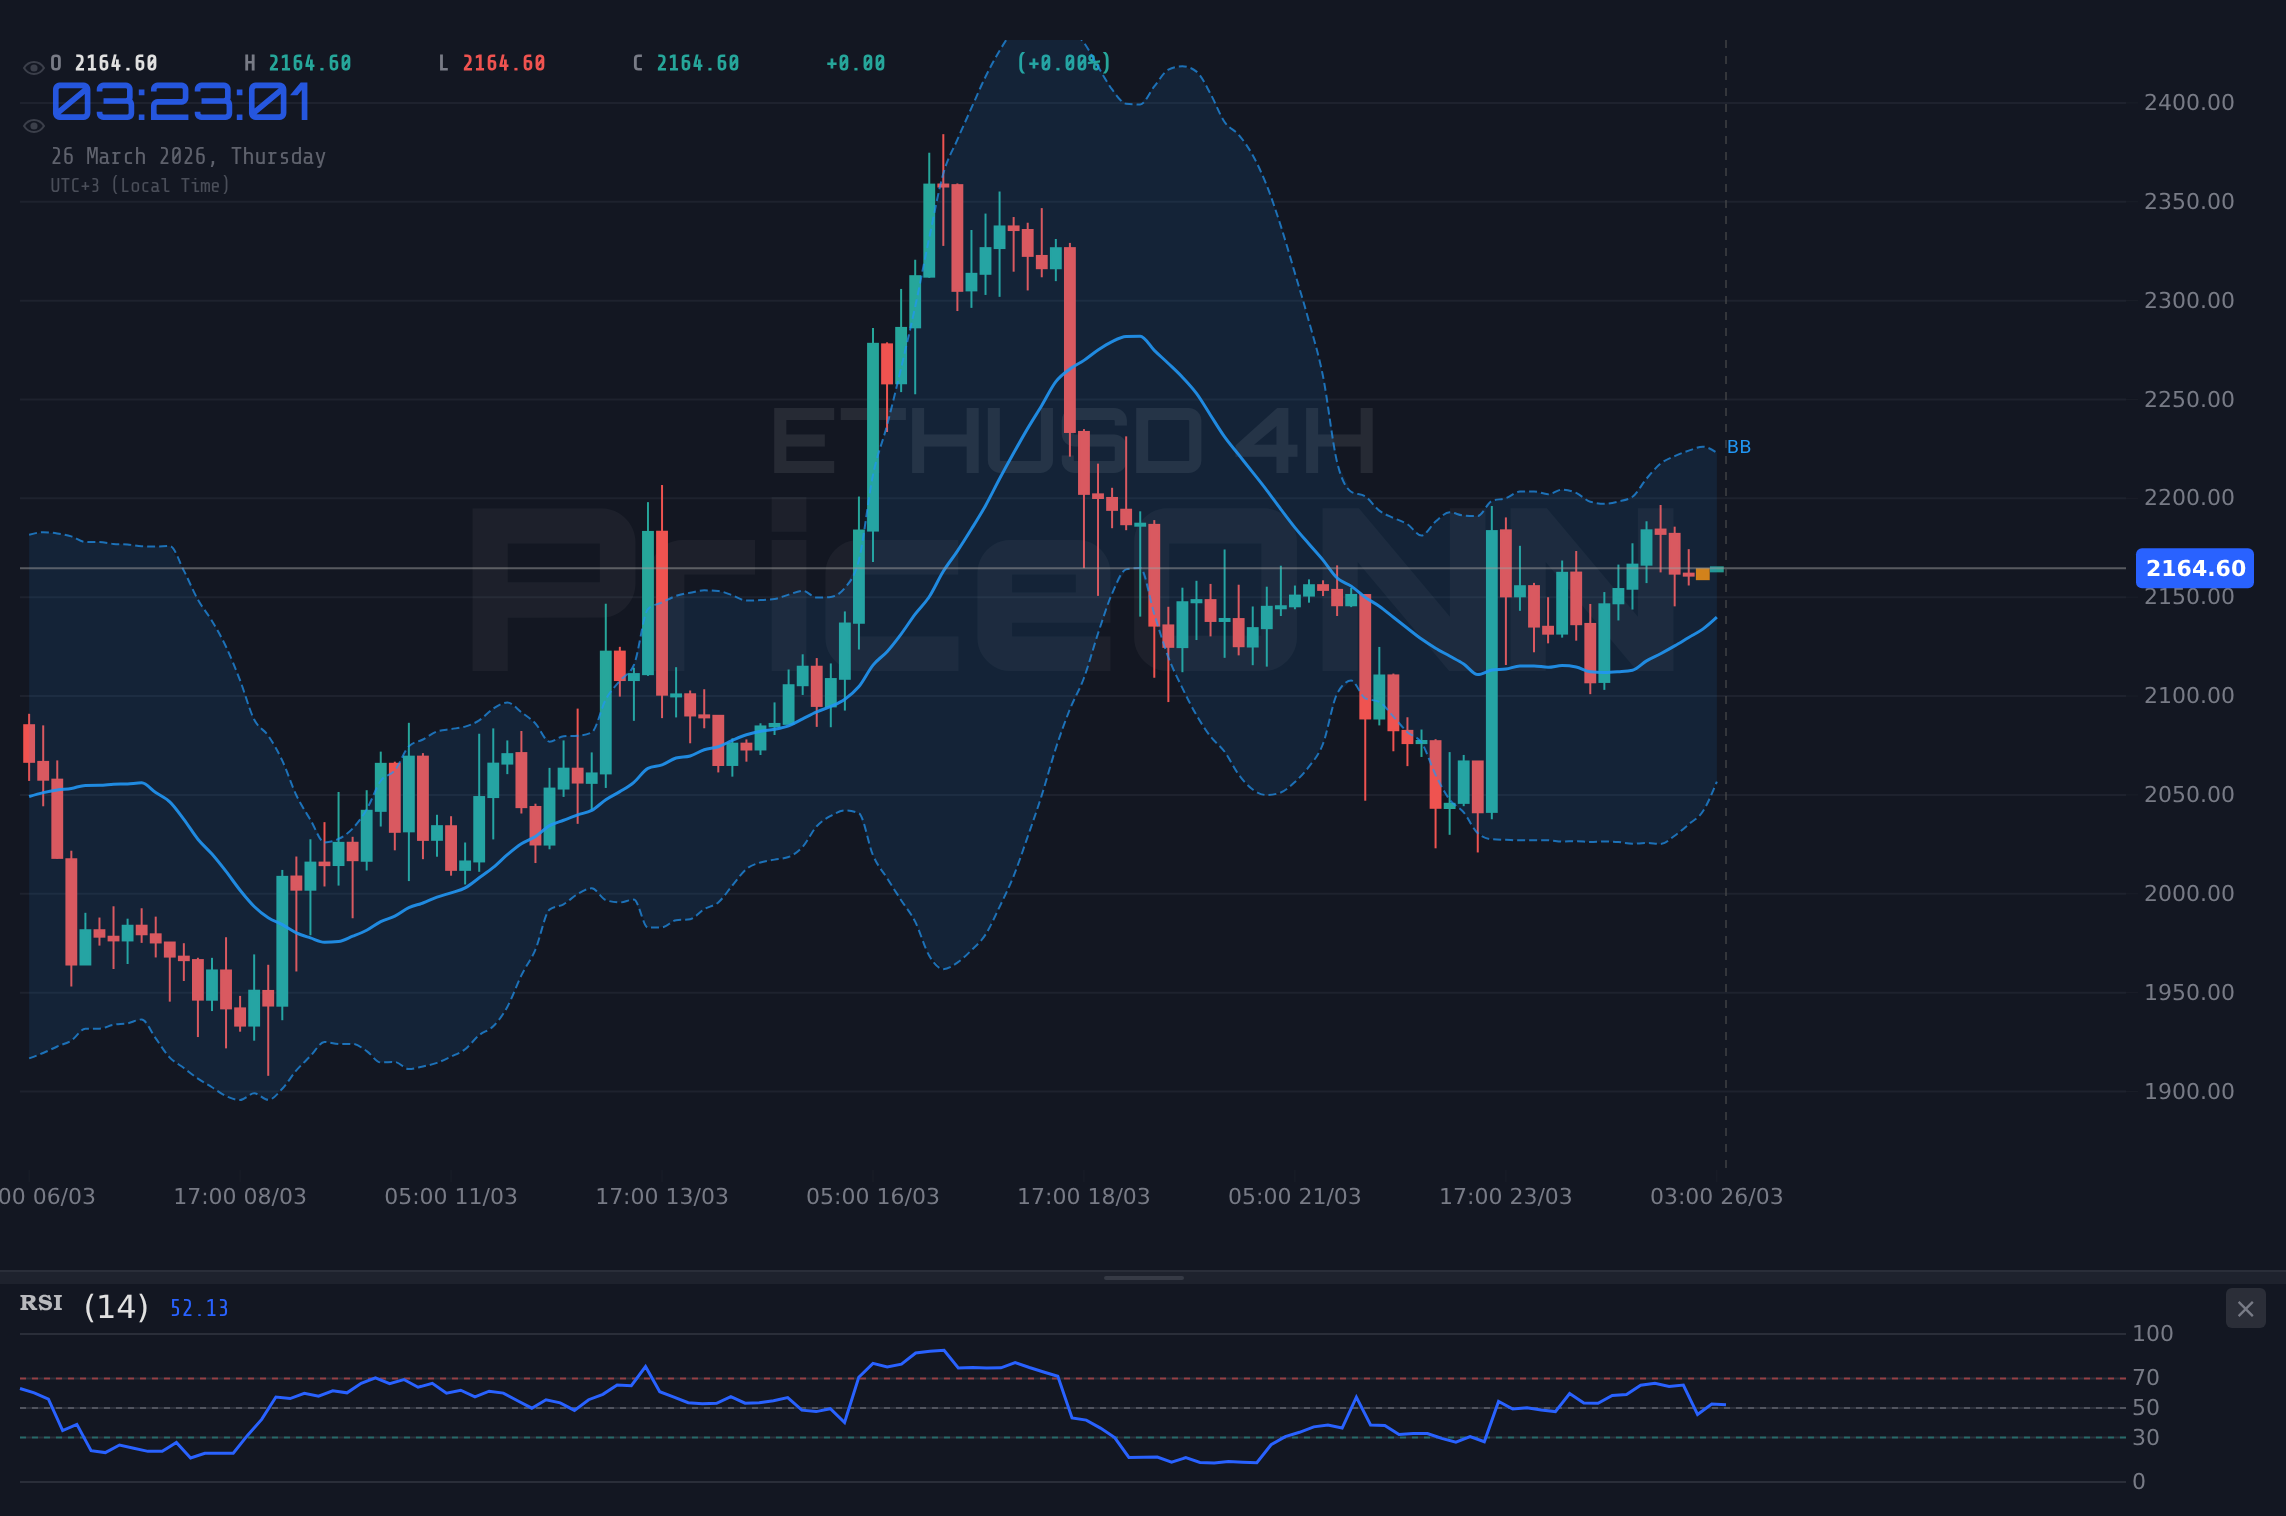
The tug-of-war for Ethereum's direction is intensifying as ETHUSD hovers precariously near the $2,164.51 mark. This critical juncture is where the bulls and bears are locked in a fierce battle, with conflicting technical indicators and looming macroeconomic data releases creating a volatile cocktail. The question on every trader's mind: will ETHUSD push higher towards new resistance levels, or is a pullback imminent as the market digests the latest economic signals and geopolitical undertones?
- ETHUSD is trading near $2,164.51, facing resistance from the 1H mid-band.
- RSI at 51 on 1H suggests a neutral stance, but with a slight upward lean, while 4H RSI at 53.82 indicates cautious optimism.
- The ADX at 13.52 on 1H and 15.69 on 4H points to weak trending conditions, suggesting potential for choppy price action.
- Key US PMI data releases are expected, alongside potential market reactions to geopolitical events involving former President Trump, which could impact risk sentiment and thus ETHUSD.
The Bullish Case: Navigating Towards Higher Ground
On the bullish side, the 1-hour chart for ETHUSD, currently trading at $2,164.51, shows a nascent upward momentum. Despite the MACD being below its signal line, indicating negative momentum, the RSI(14) at 50.99 suggests a neutral territory with a potential for a move higher. The Stochastic indicator, with %K at 49.86 and %D at 41.24, shows %K above %D, hinting at a potential bullish crossover and a move out of oversold territory, although it's not yet in the overbought zone. The ADX, a measure of trend strength, sits at a weak 13.52 on the 1-hour timeframe, indicating that the current trend is not strongly established, which could mean that any upward move, if it gains traction, might not face immediate, strong opposition from established downtrends.
Furthermore, the 4-hour chart presents a slightly more optimistic picture for the bulls. The RSI(14) at 53.82 is comfortably in the neutral zone, leaning towards bullish territory, suggesting that there's room for further price appreciation before hitting overbought conditions. The MACD is showing positive momentum, with the MACD line above the signal line, reinforcing the idea of upward pressure. The Stochastic oscillator here is also showing a potential bullish signal with %K at 71.62 and %D at 75.26, although it's nearing the overbought threshold, it hasn't crossed decisively downwards yet. The Bollinger Bands on this timeframe are above the middle band, indicating an upward bias. The ADX at 15.69 still signifies a weak trend, but the combination of these indicators suggests that if ETHUSD can maintain its position above key support levels, a move towards the upper Bollinger band and subsequent resistance levels is plausible.
The daily chart for ETHUSD, while showing overall neutral sentiment with a 50% trend strength, also offers some support for the bulls. The RSI(14) at 52.62 is in bullish territory, and the MACD is displaying positive momentum, with the MACD line above its signal line. The Stochastic indicator, with %K at 37.05 and %D at 31.09, shows a bullish crossover and is moving out of oversold conditions. The Bollinger Bands are above the middle band, suggesting an upward inclination. While the ADX at 18.91 indicates a weak trend, the confluence of a bullish RSI, positive MACD momentum, and a bullish Stochastic crossover on the daily chart provides a foundation for a potential longer-term upward move, provided immediate resistance levels at $2,182.17 and $2,191.95 can be decisively breached.
The Bearish Case: Facing Headwinds at Resistance
However, the bearish perspective cannot be ignored, especially with ETHUSD trading near $2,164.51, a level that coincides with resistance. On the 1-hour chart, while the RSI is neutral, the MACD shows negative momentum, and the Stochastic oscillator is giving a cautious signal as %K is above %D but not yet in overbought territory. The Bollinger Bands on the 1-hour chart are below the middle band, indicating a downward bias in the very short term, which could lead to a retest of immediate support levels like $2,160.93.
The 4-hour chart, despite some bullish signals from RSI and MACD, also presents bearish undertones. The Stochastic oscillator, with %K at 71.62 and %D at 75.26, shows %K below %D, which is a bearish signal, suggesting a potential move downwards from overbought conditions. This is corroborated by the ADX value of 15.69, which, while indicating a weak trend, doesn't negate the possibility of a pullback if sellers gain control. The fact that the price is hovering near resistance levels on this timeframe also adds to the bearish sentiment, as breaking through these levels ($2,183.27, $2,204.63) would require significant buying pressure that isn't clearly evident across all indicators.
Looking at the daily chart, the bearish case is bolstered by the overall trend strength indicated by the ADX at 18.91, which, while weak, is still a factor. More importantly, the MACD shows negative momentum on this longer timeframe. Although the Stochastic shows a bullish crossover, it's coming from oversold levels and needs confirmation. The Bollinger Bands are above the middle band, suggesting an upward bias, but the price is currently situated below the upper band, indicating potential for a reversal if it fails to break through. The presence of resistance levels at $2,179.53, $2,212.64, and $2,251.93 means that any upward move faces significant hurdles, and a failure to break these could lead to a sharp decline towards support levels like $2,107.13.
Correlation and Macroeconomic Undercurrents
The correlation between ETHUSD and broader market indicators, such as the US Dollar Index (DXY) and equity indices like the S&P 500, cannot be overlooked. Currently, the DXY is showing a strong upward trend on the 1-hour and 4-hour charts, trading around 99.42. Historically, a strengthening dollar tends to exert downward pressure on risk assets like cryptocurrencies, including ETHUSD. If the DXY continues its ascent, it could act as a significant headwind for ETHUSD, potentially driving it lower towards its support levels.
Conversely, the S&P 500 is experiencing a slight pullback, trading near 6591.15, with a bearish direction on the daily chart and neutral on the 1-hour and 4-hour. A decline in major equity indices often signals a decrease in risk appetite across financial markets. This 'risk-off' sentiment typically leads investors to move away from riskier assets, such as cryptocurrencies, and seek refuge in safer havens. If this trend continues, it would further dampen prospects for ETHUSD, potentially accelerating any downward price action.
The economic calendar also presents potential catalysts. While specific high-impact events for today (March 26th) are limited in the provided data, the general economic climate, with mentions of potential recession fears and geopolitical tensions, creates an environment of uncertainty. Upcoming US PMI data, for instance, could significantly influence market sentiment and, by extension, the price of ETHUSD. Positive data might boost risk appetite, while weak numbers could trigger a flight to safety, impacting ETHUSD negatively. The mention of potential market reactions to geopolitical events, particularly those involving former President Trump, adds another layer of unpredictability. Such events can cause sudden shifts in market sentiment, leading to sharp price movements in risk assets.
The Verdict: A Watchful Stance Near Resistance
Analyzing the confluence of technical indicators and macroeconomic factors, ETHUSD at $2,164.51 appears to be in a precarious position, caught between conflicting signals and significant external pressures. The technical picture is mixed: the 1-hour and 4-hour charts show some bullish momentum, supported by RSI and MACD readings, but are hampered by weak ADX trends and stochastic signals nearing overbought or showing bearish crossovers. The daily chart offers a more cautiously optimistic outlook, but the overall trend strength remains low, indicating a lack of conviction in any sustained move.
The strong upward trend in the DXY and the slight bearishness in the S&P 500 suggest that broader market sentiment might not be overly supportive of risk assets like ETHUSD right now. The upcoming PMI data and any geopolitical news related to figures like Trump could easily tip the scales. Given this environment, a definitive bullish or bearish call is premature. The most prudent approach is a 'Watch Zone' strategy, as indicated by the current market conditions and the provided trade recommendation. Traders should wait for a clearer signal, such as a decisive breakout above the $2,182.17 resistance on significant volume, or a confirmed breakdown below the $2,142.97 support level, before committing to a directional trade.
The current price action around $2,164.51 is characterized by indecision. While bulls might see an opportunity to push higher, the resistance levels and the prevailing macro environment present considerable challenges. Bears, on the other hand, are waiting for a confirmation of weakness, perhaps a close below the 4-hour middle Bollinger Band or a DXY surge. Until these conditions are met, navigating this market requires patience and strict risk management. The market is essentially signaling a 'wait and see' approach, allowing the price action to develop and provide more clarity before a substantial move is initiated. The key level to watch remains $2,164.51, with immediate resistance at $2,182.17 and support at $2,142.97.
Bearish Scenario: Retreat from Resistance
65% ProbabilityNeutral Scenario: Consolidation Near Key Levels
25% ProbabilityBullish Scenario: Breakout Above Resistance
10% ProbabilityFrequently Asked Questions: ETHUSD Analysis
What happens if ETHUSD breaks above the $2,182.17 resistance level?
A sustained break above $2,182.17, particularly on the 1-hour or 4-hour chart, would invalidate the immediate bearish pressure and could open the door for a move towards the next resistance at $2,191.95. This would require confirmation from broader market sentiment and potentially a weakening DXY.
Should I buy ETHUSD at current levels of $2,164.51 given the mixed technical signals?
Buying at current levels of $2,164.51 carries significant risk due to the proximity to resistance and mixed indicators. A more prudent approach would be to wait for a confirmed breakout above $2,182.17 or a clear test and hold of support around $2,142.97, offering a better risk-reward ratio.
Is the RSI at 50.99 on the 1H chart a buy signal for ETHUSD?
An RSI reading of 50.99 is considered neutral territory, indicating neither overbought nor oversold conditions. While it suggests a lack of immediate selling pressure, it does not independently act as a strong buy signal. Confirmation from other indicators like MACD and Stochastic, alongside price action above key resistance, would be needed.
How will the upcoming US PMI data affect ETHUSD this week?
Stronger-than-expected US PMI data could boost risk appetite, potentially benefiting ETHUSD by driving it higher. Conversely, weaker data might signal economic slowdown, leading to a risk-off sentiment and a potential decline in ETHUSD as investors seek safer assets. The market will be closely watching these figures for directional cues.
Track markets in real-time
AI-powered analysis, technical indicators and real-time price data.
Join Our Telegram Channel
Breaking market news, AI analysis and trading signals instantly.
Join Channel