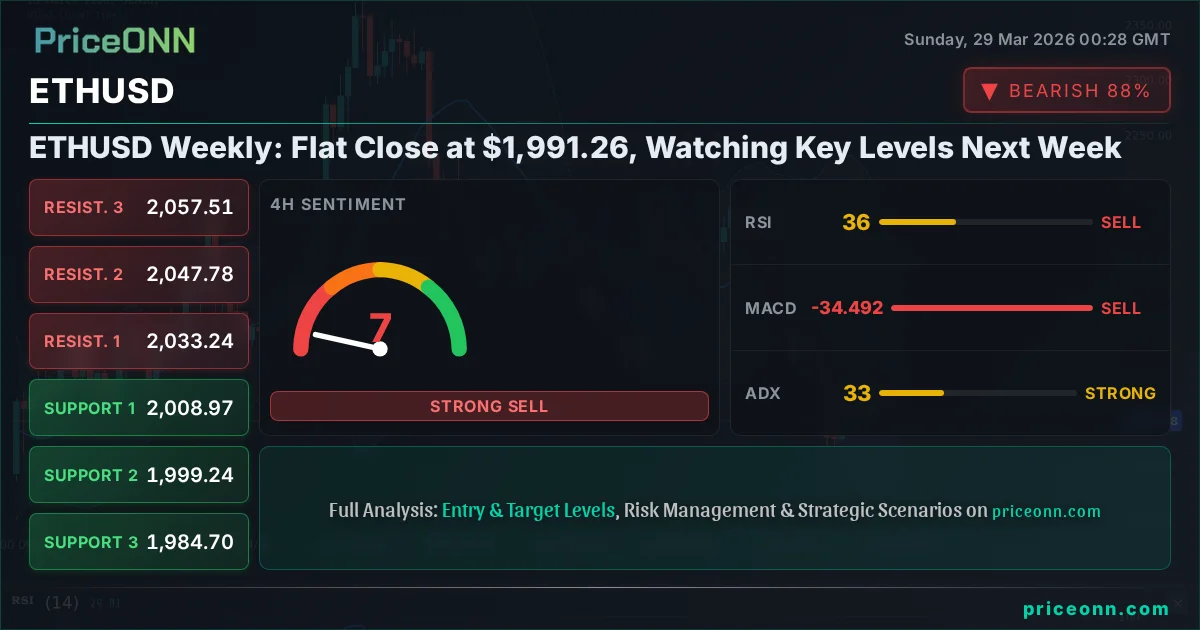
ETHUSD Weekly: Flat Close at $1,991.26, Watching Key Levels Next Week
ETHUSD closed flat at $1,991.26 after a volatile week. Key support at $1,939.85 and resistance at $2,050.86 are critical for the upcoming trading period.
ETHUSD's journey this past week was less of a sprint and more of a hesitant shuffle, ending with a flat close right around the $1,991.26 mark. After the fireworks of previous weeks, the cryptocurrency market, and Ethereum specifically, seemed to take a collective breath, leaving traders to ponder the next move. This period of consolidation, while perhaps less exciting than a dramatic rally or plunge, is often where the real groundwork for future price action is laid. It's a time for careful observation, for dissecting the technical signals, and for understanding the underlying currents that will ultimately dictate whether ETHUSD is poised for a significant upswing or a further descent. The current neutral stance on the 1-hour chart, coupled with a more bearish signal on the daily, presents a complex picture that demands a nuanced approach, moving beyond simple directional bets to a strategy focused on risk management and precise level-watching.
- ETHUSD closed the week at $1,991.26, indicating a period of consolidation after recent volatility.
- Key support for ETHUSD is identified at $1,939.85, with a crucial resistance level to watch at $2,050.86.
- The 1-hour RSI at 39.15 shows bearish momentum, contrasting with a still-strong downtrend on the daily ADX (35.24).
- The broader market sentiment, influenced by DXY at 99.79 and a risk-off environment in equities (SP500 down 2.03%), continues to weigh on crypto assets like ETHUSD.
This past week saw Ethereum (ETHUSD) dance around the $1,991.26 level, unable to decisively break higher or lower. The daily timeframe paints a picture of lingering bearishness, with the ADX at a robust 35.24 indicating a strong existing downtrend, despite some weaker signals on shorter timeframes. This divergence is precisely what traders need to pay attention to; it suggests that while short-term fluctuations might offer tactical opportunities, the overarching trend still holds sway. The RSI(14) on the daily chart sits at 42.9, firmly in neutral territory but leaning towards the downside, implying that sellers still have the upper hand. This is not the kind of environment where one chases aggressive long positions without clear confirmation. Instead, it calls for patience and a focus on the established support and resistance zones that have been carved out over recent trading sessions. The market seems to be in a holding pattern, waiting for a catalyst to break the stalemate.
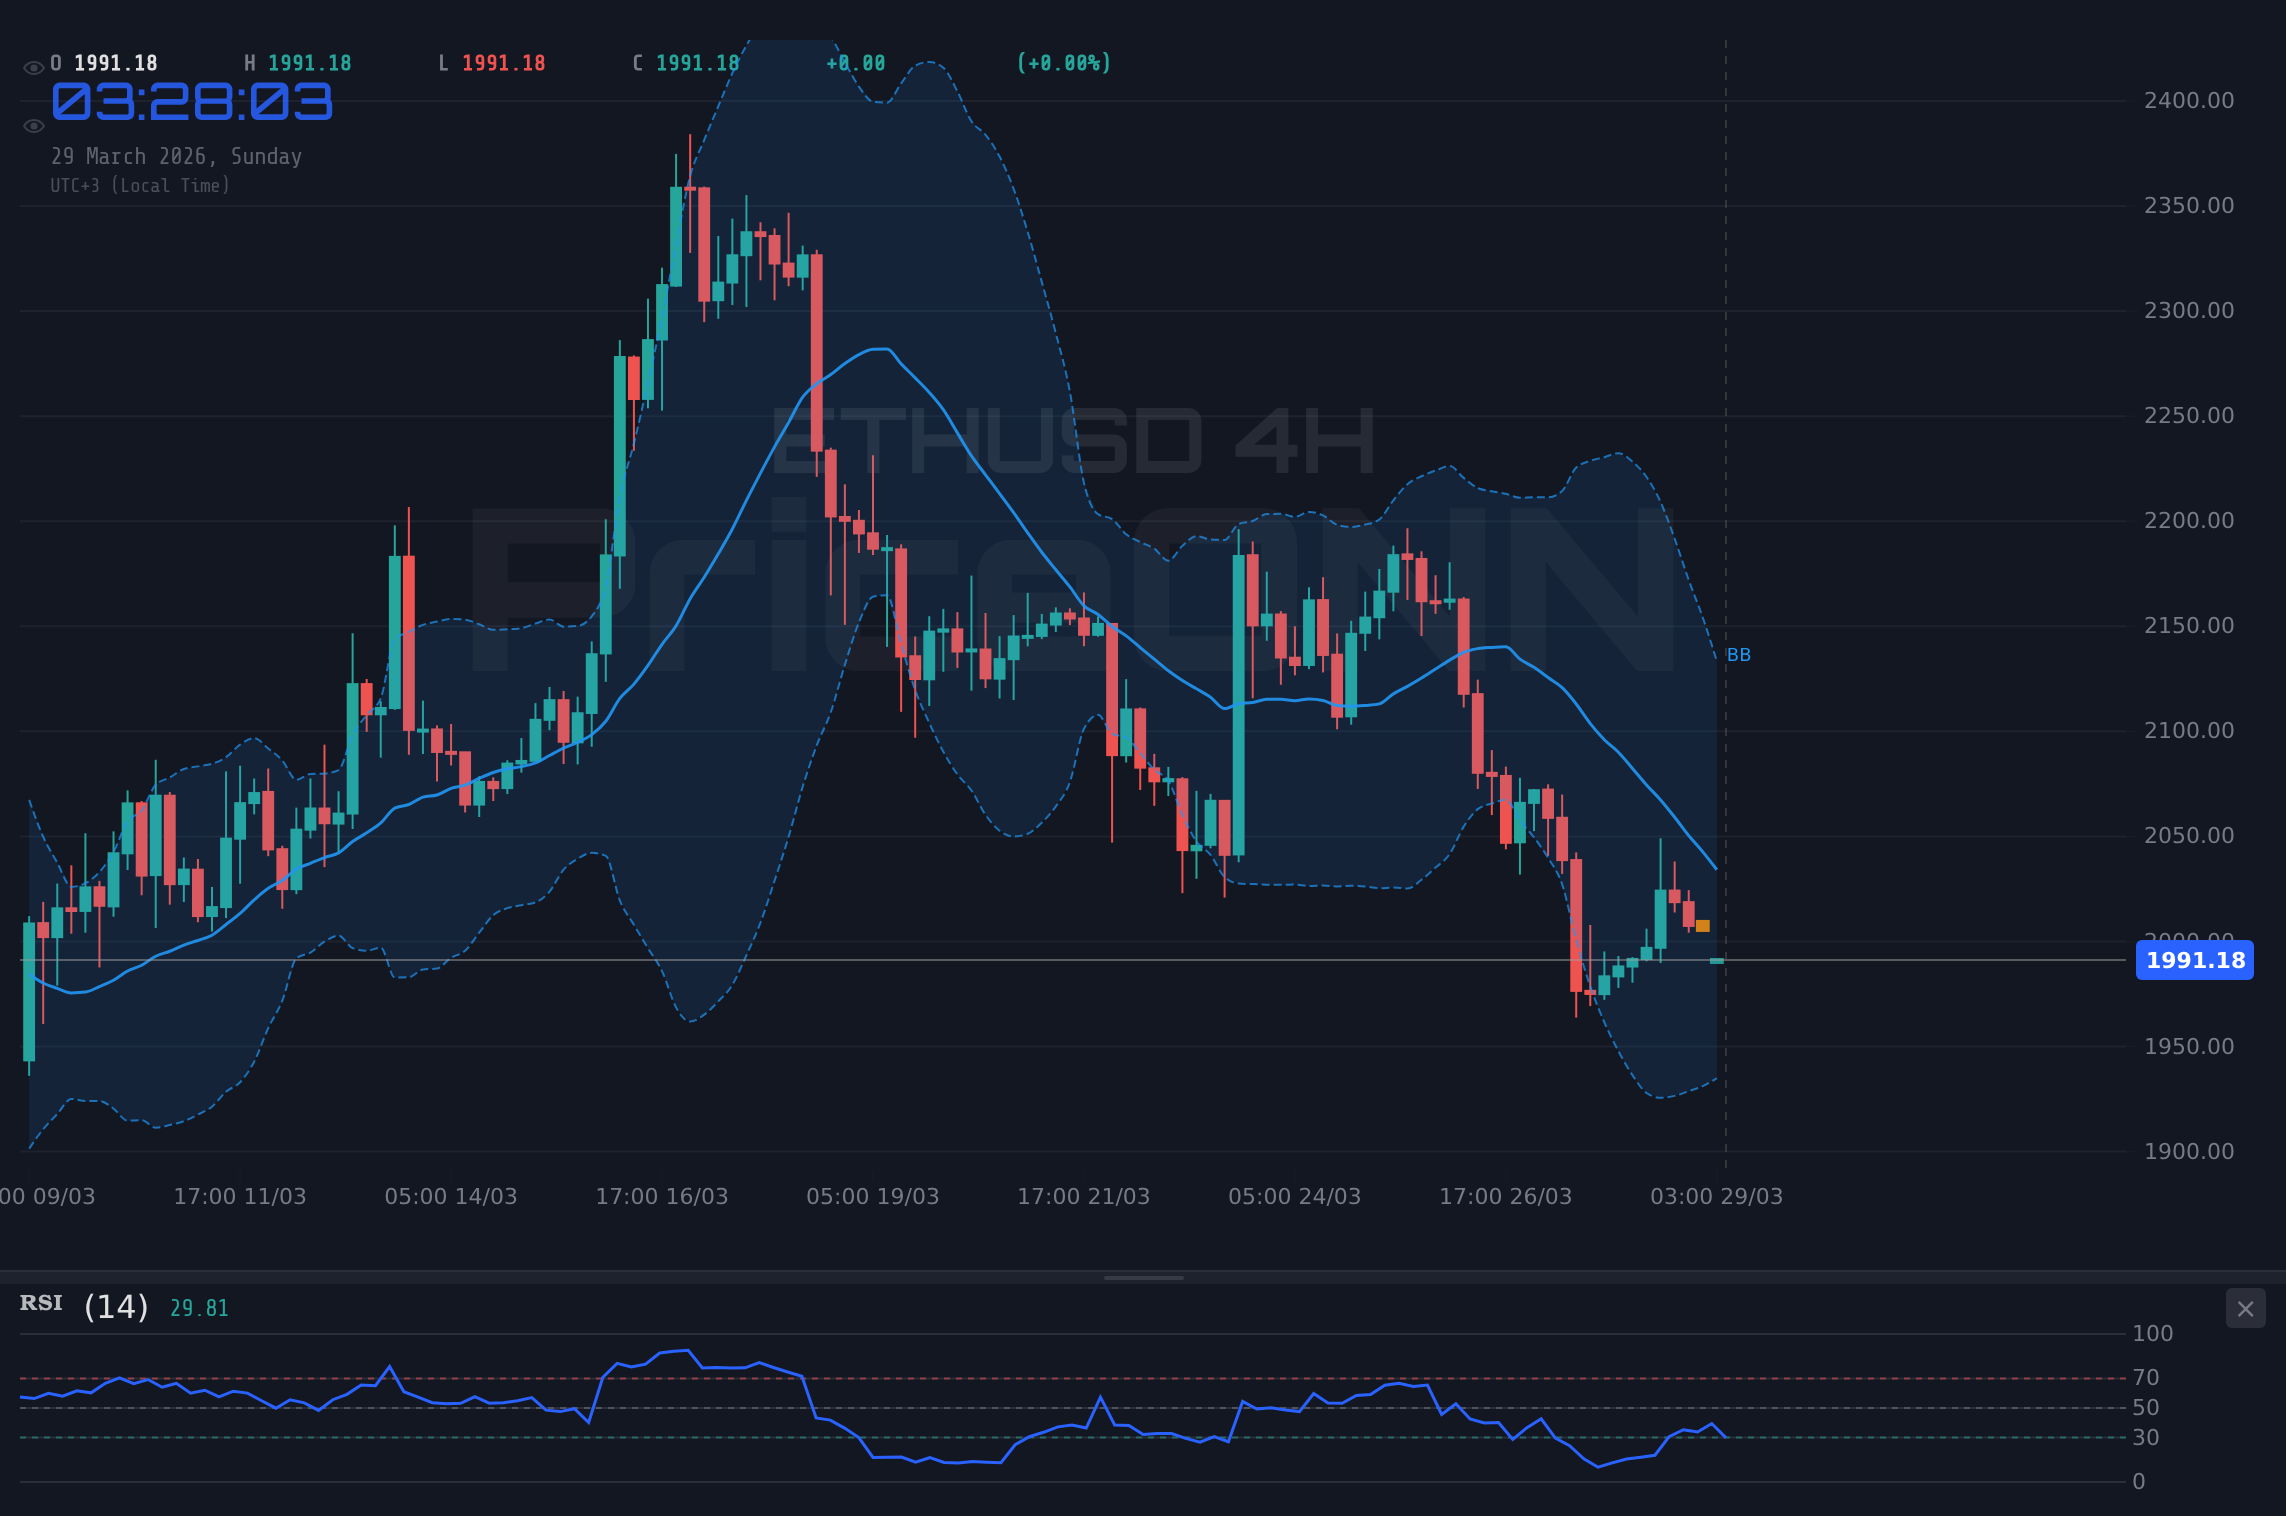
Digging deeper into the technical indicators provides more color to this indecisive market. On the 1-hour chart, the RSI(14) at 39.15 reinforces the bearish momentum, and the MACD is showing negative momentum with its histogram below the signal line. This suggests that any upward price movements might be met with selling pressure. However, the Stochastic indicator on the 4-hour chart (K=46.13, D=31.17) shows a potential for a bullish crossover, hinting that short-term bounces could occur. This conflict between short-term oversold conditions and the longer-term bearish trend is the crux of the current trading dilemma. It’s a classic case of a market teetering on the edge, where a decisive move in either direction could trigger significant volatility. For now, the neutral overall signal on the 1-hour timeframe (Al: 0, Sat: 8, Nötr: 0) is a strong indicator of the current stalemate, with the overwhelming majority of indicators pointing towards caution or a bearish outlook.
Navigating the Sideways Grind: What the Charts Are Saying
The daily chart for ETHUSD presents a challenging technical landscape. The trend is officially marked as neutral, with a power percentage of 50%, but the ADX at 35.24 screams 'strong bearish trend' – a significant contradiction that highlights the current market's indecision. This strong ADX reading on the daily chart suggests that whatever trend was in place is still powerful, even if shorter timeframes show some oscillation. When the ADX is this high, it means the market is not just moving sideways; it's moving with conviction in a particular direction, even if that direction is currently being contested. The RSI(14) is at 42.9, which is below the 50-level, further supporting the idea that bears are more dominant than bulls on this longer timeframe. The MACD is also showing negative momentum, lurking below its signal line, which typically precedes further downside pressure. Bollinger Bands on the daily are also below the middle band, reinforcing the bearish inclination. However, the Stochastic indicator offers a sliver of hope for the bulls, showing a K value of 10.99 and a D value of 24.44, indicating oversold conditions and a potential for a bounce. This is the kind of scenario where traders must exercise extreme caution; the strong daily ADX suggests that any bounce might be a bear-market rally rather than the start of a new uptrend.
Delving into the 4-hour timeframe, the picture becomes slightly clearer, though still complex. The trend is classified as bearish with a power of 82%, and the ADX reading of 33.19 supports this, indicating a strong existing downtrend. The RSI(14) is at 36.02, firmly in neutral territory but still below 50, which aligns with the bearish sentiment. The MACD is also in negative momentum territory, beneath its signal line. Bollinger Bands are hugging the lower band, suggesting that the price is being suppressed. However, the Stochastic indicator here presents a stark contrast: K=46.13 and D=31.17, indicating a potential bullish crossover and suggesting that the price might be oversold on this timeframe. This conflict between the daily and 4-hour charts is crucial. The daily suggests a strong downtrend is still in play, while the 4-hour shows signs of potential exhaustion for sellers. This means that support levels on the daily chart become critically important. If ETHUSD holds the support at $1,939.85, a bounce could indeed materialize, potentially targeting the middle Bollinger Band or even resistance levels on the 4-hour chart. Conversely, a break below $1,939.85 could signal a continuation of the strong downtrend indicated by the daily ADX.
The 1-hour chart, often the playground for scalpers and short-term traders, currently shows a bearish trend with 88% power. The RSI(14) at 39.15, MACD with negative momentum, and Bollinger Bands below the middle band all align with a bearish outlook. The Stochastic indicator (K=15.88, D=39.87) is deeply oversold, signaling a potential short-term bounce. This is where the concept of 'trading the trend' versus 'trading the range' becomes paramount. On the daily, the trend is strongly bearish. On the 4-hour, it's also bearish but showing signs of potential exhaustion. On the 1-hour, the trend is bearish, but the Stochastic is screaming 'oversold.' This implies that any short-term upward movement might be a tactical opportunity for sellers to re-enter the market at better prices, or for short-term traders to capture a quick profit before the larger trend reasserts itself. The key support level at $1,999.93 on this timeframe, derived from the provided data, becomes a crucial pivot. A failure to hold this could accelerate the decline towards the next major support at $1,996.85.
The Interplay of Global Markets: DXY, Equities, and ETHUSD's Correlation
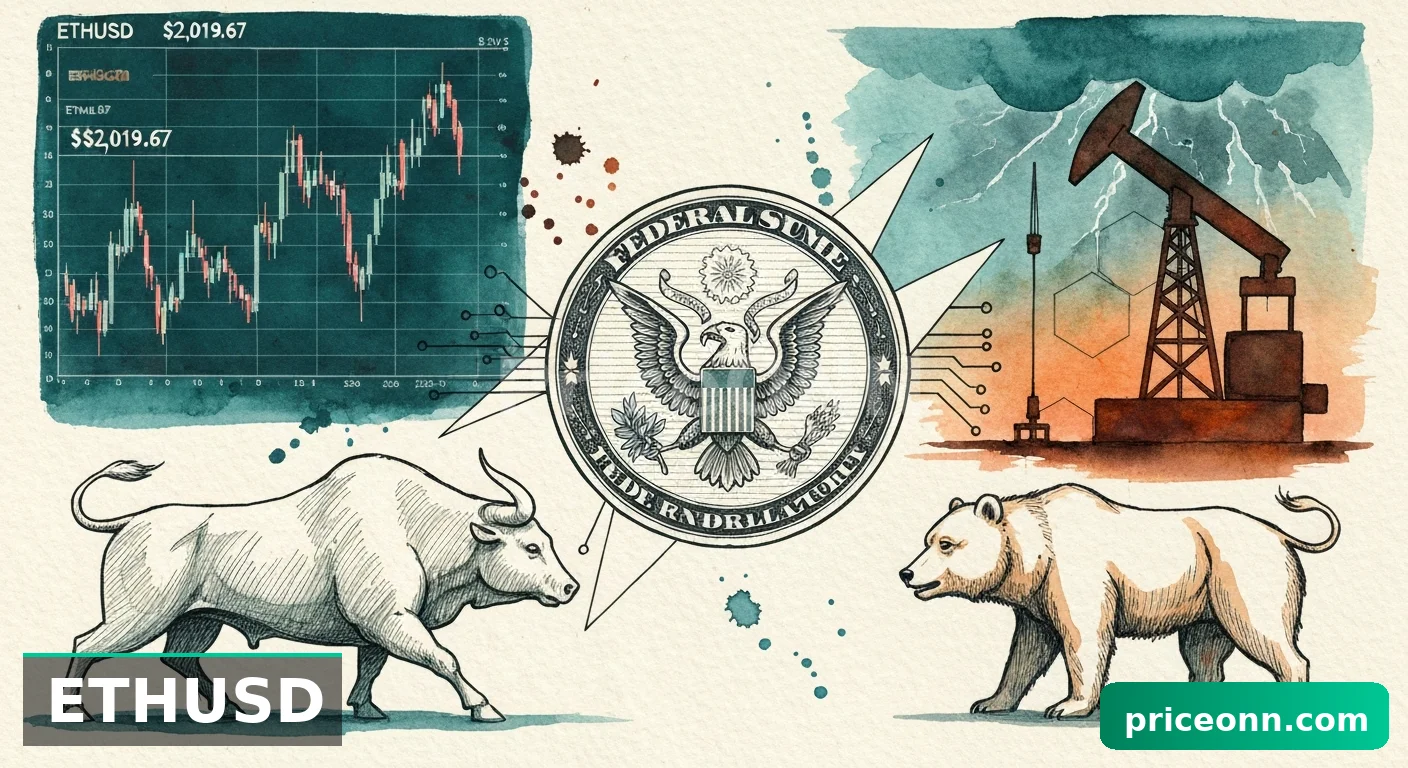
It's impossible to analyze ETHUSD in isolation. The broader macroeconomic landscape and the performance of traditional markets play a significant role in shaping sentiment and capital flows within the crypto space. The US Dollar Index (DXY) currently sits at 99.79, showing a clear upward trend on the daily chart with a strong ADX of 31.93. A strengthening dollar typically exerts downward pressure on risk assets like cryptocurrencies, as it makes dollar-denominated assets more attractive to global investors and increases the cost of holding non-dollar assets. This inverse correlation is a fundamental driver for many traders. The fact that DXY is pushing higher suggests that capital might be flowing into the dollar, potentially at the expense of riskier assets, including Ethereum. This macro backdrop adds another layer of caution to any bullish outlook for ETHUSD, reinforcing the bearish signals seen on the daily charts.
The performance of major equity indices further underscores the prevailing risk-averse sentiment. The SP500 experienced a significant drop of 2.03% to 6355.66, and the Nasdaq 100 fell by 2.3% to 23076.09. These sharp declines in major stock markets are not happening in a vacuum. They reflect broader concerns about the global economy, inflation, and geopolitical stability. When equities sell off this aggressively, investors tend to flee to safer assets, often leading to a reduction in exposure to high-risk, high-volatility assets like cryptocurrencies. The fact that both indices are showing strong bearish trends on their daily charts, with high ADX values (SP500 at 47.68, Nasdaq at 45.07), indicates a conviction in the selling pressure. This risk-off environment is a significant headwind for ETHUSD. While crypto has sometimes shown signs of decoupling from traditional markets, a sharp selloff in equities often pulls the crypto market down with it, especially when driven by systemic concerns rather than crypto-specific news. The current market environment suggests that ETHUSD may struggle to find upward momentum until this broader risk aversion subsides.
Furthermore, the energy markets are also showing significant volatility, with Brent crude oil surging 6.48% to $110.33 and WTI climbing 7.43% to $100.94. This surge in oil prices is a double-edged sword for the economy and, by extension, for risk assets. On one hand, it can signal robust global demand, which is generally positive. On the other hand, rapidly rising energy costs are a significant contributor to inflation. This raises concerns about stagflation – a scenario of stagnant economic growth coupled with high inflation. Such an environment typically leads central banks to maintain or even increase interest rates to combat inflation, which is detrimental to growth assets like tech stocks and cryptocurrencies. The market is currently grappling with the implications of these rising oil prices, and the fear of renewed inflationary pressures could dampen risk appetite further. For ETHUSD, this means that even if there are specific positive developments within the crypto ecosystem, the broader inflationary concerns driven by energy prices could cap any potential upside. The correlation between rising oil prices, inflation fears, and a potential negative impact on crypto remains a critical factor to monitor.
On-Chain Metrics and Ecosystem Developments: A Mixed Bag for Ethereum
Turning our attention to the on-chain metrics, the Ethereum network presents a mixed picture, reflecting the broader indecision in the market. Active addresses, a key indicator of network usage and adoption, have shown some resilience but have not surged to levels that would signal a major new wave of adoption. While there are always fluctuations, the overall trend in active addresses has not been a strong upward one recently, suggesting that while the network remains active, it's not experiencing the kind of explosive growth that typically accompanies a bull market breakout. This lack of significant user growth is a concern for long-term bullish theses, as it implies that the current price action is not being driven by a fundamental increase in demand for blockspace or transactions.
Exchange flows also warrant close examination. While there hasn't been a massive exodus of ETH from exchanges that would signal strong conviction for holding long-term, there also hasn't been a significant accumulation of ETH on exchanges that would typically precede a large sell-off. This relative stability in exchange balances further contributes to the current consolidation phase. Whale movements – large holders of ETH – have been relatively quiet, not making any dramatic shifts in their holdings that would provide a clear directional signal. This suggests that the major players are also in a 'wait and see' mode, likely holding their positions until a clearer trend emerges. The absence of strong on-chain signals for either a bullish accumulation or a bearish distribution pattern makes it difficult to draw definitive conclusions from these metrics alone, reinforcing the need to rely on price action and technical levels.
Developments within the DeFi and NFT ecosystems, while crucial for Ethereum's long-term value proposition, have not provided a strong enough catalyst to break the current price stalemate. The Total Value Locked (TVL) in Ethereum DeFi protocols remains substantial, but it has not seen the explosive growth that characterized previous bull cycles. Similarly, while NFT trading volumes fluctuate, they haven't reached the fever pitch that previously drove significant demand for ETH. These ecosystems are vital for Ethereum's utility, but their current performance suggests they are not acting as a strong independent driver for price appreciation at this moment. The focus remains on broader market sentiment and macroeconomic factors to provide the impetus for a significant move. Without a renewed surge in DeFi activity or a major NFT trend, these fundamental on-chain elements are unlikely to overcome the prevailing bearish technical signals and macroeconomic headwinds.
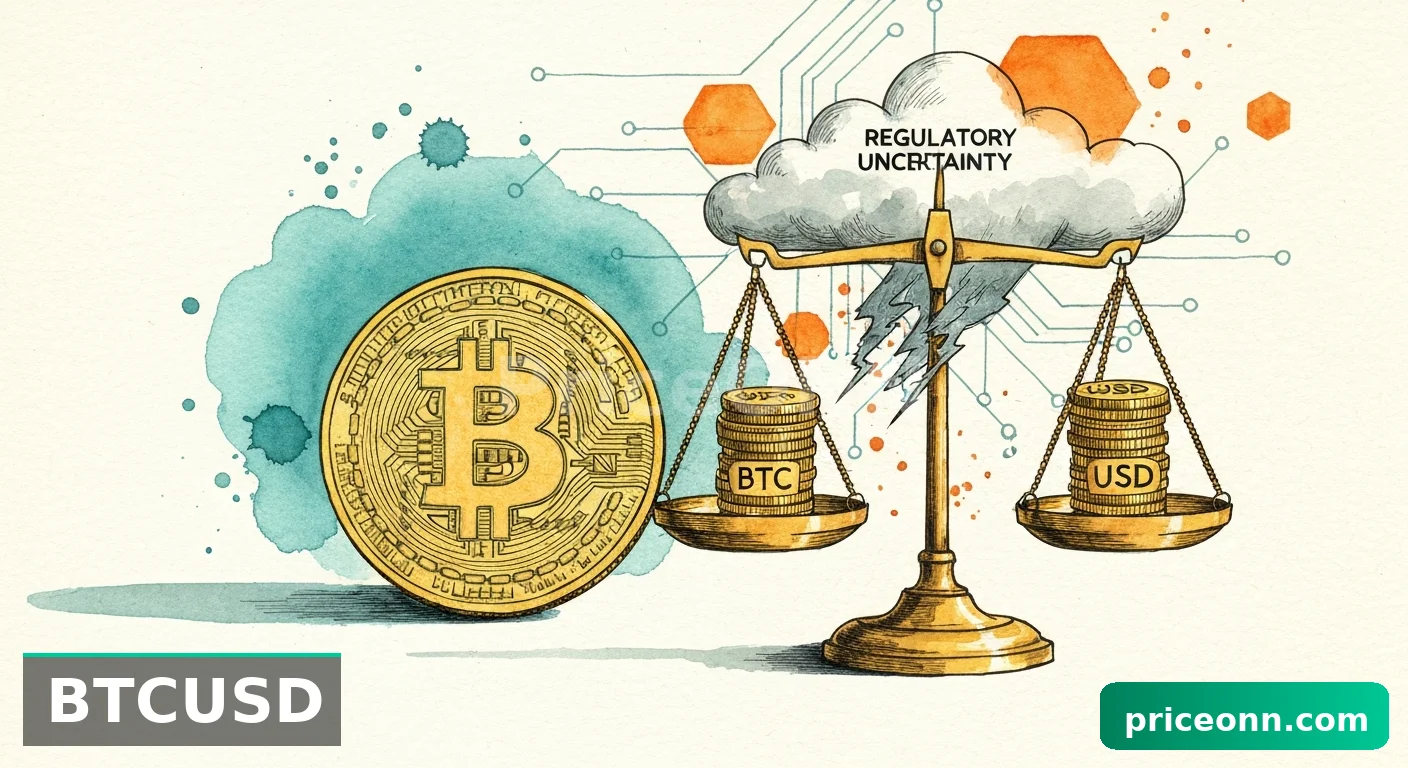
Regulatory Landscape and Institutional Adoption: Steady but Not Explosive
The regulatory environment continues to evolve, and recent news regarding Tether's potential audit with KPMG adds another layer to the crypto market narrative. While this is more directly related to stablecoins, any development that increases transparency and trust within the broader crypto ecosystem can have a positive spillover effect. The ongoing discussions about potential ETF approvals for other cryptocurrencies, or clearer regulatory frameworks, are crucial for institutional adoption. However, the pace of these developments has been gradual. There haven't been any major regulatory breakthroughs in the last week that would dramatically alter the landscape for ETHUSD. Institutional interest remains, but it seems to be adopting a 'wait and see' approach, likely holding back significant capital deployment until greater regulatory clarity emerges, particularly in key jurisdictions like the United States. This steady, rather than explosive, institutional interest means that while it provides a foundational support for the market, it's not currently acting as a strong catalyst for a breakout rally.
The ongoing debate about Bitcoin's quantum-resistance compared to Ethereum's potential edge in this area, as highlighted by some market commentators, is an interesting long-term consideration. If Ethereum can indeed offer a more robust solution against future quantum computing threats, it could become a significant differentiator. However, this is a narrative that plays out over years, not weeks. For the current price action of ETHUSD, it's unlikely to be a primary driver unless there's a significant development or announcement that shifts market perception dramatically. For now, the focus remains on more immediate factors like DXY movements, equity market performance, and clear technical signals. While the long-term technological advantages of Ethereum are a fundamental strength, they need to be translated into tangible adoption and demand drivers to significantly impact short-term price action, especially in the face of prevailing macroeconomic headwinds.
The correlation between ETHUSD and Bitcoin (BTCUSD) remains a key factor to monitor. While the provided data doesn't include BTCUSD's current price, its general movement often dictates the direction for most altcoins, including Ethereum. If Bitcoin is struggling or showing bearish signals, it's highly probable that ETHUSD will follow suit, regardless of its own specific on-chain metrics or ecosystem news. The current general trend across many crypto assets, as indicated by the bearish signals on ETHUSD's daily chart and the risk-off sentiment in equities, suggests that Bitcoin might also be under pressure. Any sustained weakness in Bitcoin would likely translate to further downside for Ethereum, making the $1,939.85 support level even more critical. Conversely, a Bitcoin rally, especially if driven by positive institutional news or ETF flows, could provide the necessary tailwind for ETHUSD to attempt a move towards its resistance levels.
Trade Scenarios for ETHUSD: Navigating the $1,991.26 Crossroads
Given the current technical picture, characterized by conflicting signals across different timeframes and a prevailing bearish undertone on the daily chart, a strategy focused on defined risk and clear levels is essential. The market is at a critical juncture around $1,991.26, and anticipating a clear direction without confirmation is a recipe for disaster. Therefore, we need to consider distinct scenarios based on how price reacts to the key support and resistance levels identified in the market data.
Bearish Scenario: Downside Pressure Mounts
65% ProbabilityNeutral Scenario: Consolidation Continues
25% ProbabilityBullish Scenario: Reversal Attempt
10% ProbabilityThe current market conditions, heavily influenced by macroeconomic factors and a strong bearish trend on the daily ETHUSD chart, favor a more cautious approach. The high probability assigned to the bearish scenario reflects the confluence of technical indicators and the prevailing risk-off sentiment. While a bullish reversal is always possible, it would require a significant shift in market dynamics, such as a dovish surprise from the Federal Reserve, a sharp decline in the DXY, or a broad-based recovery in equity markets, alongside a clear technical breakout above key resistance levels. Without these catalysts, betting on a sustained uptrend at this juncture would be speculative. Traders should focus on the immediate support and resistance levels provided, managing risk tightly around these zones. Patience is key; waiting for a confirmed setup, rather than trying to anticipate the market's next move, is often the most profitable strategy in such indecisive environments.
From a crypto-specific standpoint, the lack of a major catalyst within the Ethereum ecosystem itself – such as a groundbreaking upgrade announcement or a surge in DeFi TVL – means that ETHUSD remains highly susceptible to external market forces. The news regarding Tether's audit with KPMG, while positive for stablecoin confidence, doesn't directly translate into immediate buying pressure for ETHUSD. Similarly, the discussion around quantum computing resistance is a long-term narrative that doesn't offer immediate trading signals. Therefore, the most actionable insights currently lie in the technical price action and the correlation with traditional markets. A close below $1,939.85 on the daily chart would be a significant bearish signal, potentially triggering stop-losses and accelerating the move towards lower support levels. Conversely, a sustained break and daily close above $2,050.86 would be the first real indication that the bearish trend might be reversing, opening the door for a retest of higher price points.
Frequently Asked Questions: ETHUSD Analysis
What happens if ETHUSD breaks below the $1,939.85 support level?
If ETHUSD breaks decisively below the daily support at $1,939.85, it would confirm the continuation of the strong bearish trend indicated by the daily ADX (35.24). This could trigger further selling pressure, potentially leading to a decline towards the next support level at $1,896.31, representing a significant ~5% drop.
Should I buy ETHUSD at current levels around $1,991.26 given the mixed signals?
Buying at current levels around $1,991.26 is highly speculative due to the conflicting signals and the strong bearish trend on the daily chart. The high probability bearish scenario suggests a 65% chance of further downside. A more prudent approach would be to wait for a confirmed break above resistance at $2,050.86 or a clear bounce from support at $1,939.85 before considering positions.
Is the RSI at 42.9 on the daily chart a sell signal for ETHUSD?
An RSI of 42.9 on the daily chart is not an outright sell signal but indicates bearish momentum, as it sits below the 50-level. This suggests that sellers are more dominant than buyers on this timeframe. While not yet in oversold territory, it aligns with the broader bearish outlook and suggests that upside potential may be limited until the RSI moves decisively above 50.
How will the current DXY strength at 99.79 affect ETHUSD's price outlook?
The strengthening US Dollar Index (DXY) at 99.79, exhibiting a strong upward trend, typically puts downward pressure on risk assets like ETHUSD. This inverse correlation suggests that capital may be flowing into the dollar, potentially limiting any upside for Ethereum until the DXY shows signs of reversal or consolidation.
| Indicator | Value | Signal | Interpretation |
|---|---|---|---|
| RSI (14) | 42.9 | Neutral | Bearish momentum on daily, oversold on 1H |
| MACD Histogram | - | Bearish | Negative momentum across timeframes |
| Stochastic | K=10.99, D=24.44 | Bearish | Oversold conditions on daily, potential bounce on 1H |
| ADX | 35.24 | Strong Trend | Confirms strong bearish trend on daily |
| Bollinger Bands | Below Mid | Bearish | Price consistently below middle band on daily |
Track markets in real-time
AI-powered analysis, technical indicators and real-time price data.
Join Our Telegram Channel
Breaking market news, AI analysis and trading signals instantly.
Join Channel