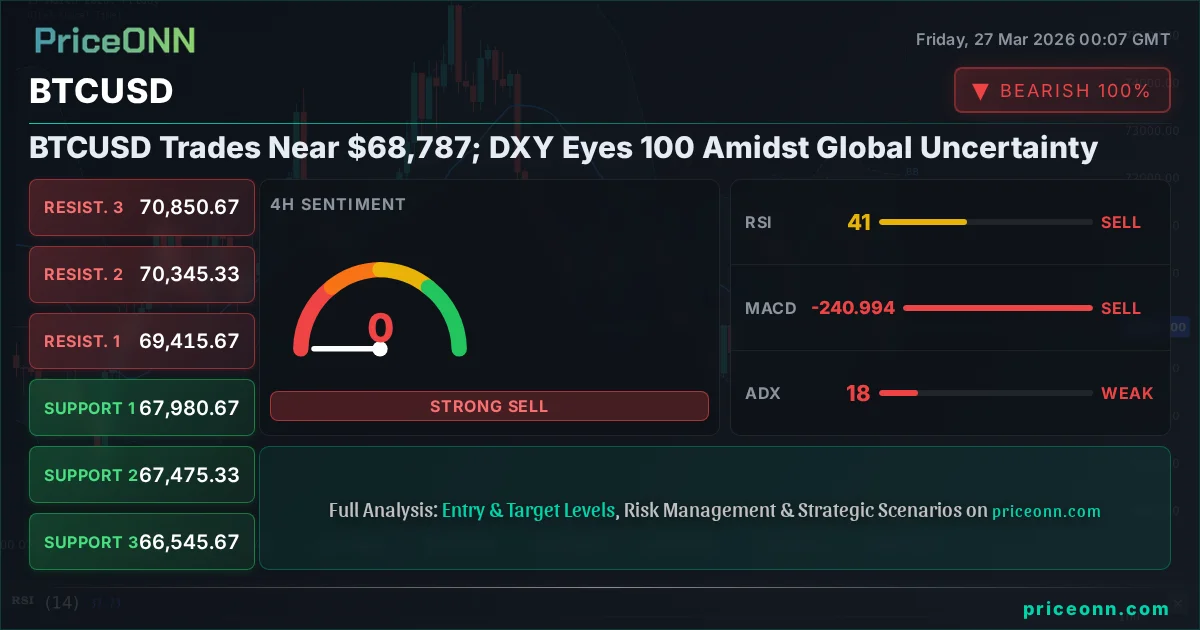
BTCUSD Trades Near $68,787; DXY Eyes 100 Amidst Global Uncertainty
Bitcoin hovers around $68,787 as the US Dollar Index approaches 100. Market sentiment is cautious with significant drops in major indices and metals.
Bitcoin is currently trading at $68,787, a level that’s seen some intense action over the past 24 hours. My take? We're in a critical 'watch zone' right now, and frankly, the charts are screaming caution, but with a glimmer of hope for the brave. The broader market sentiment is decidedly risk-off, with gold and silver taking a substantial hit, and major stock indices like the S&P 500 and Nasdaq shedding significant weight. This isn't just a crypto story; it's a global macro play, and the strengthening US Dollar Index (DXY) at 99.64 is a major theme we can't ignore. The DXY is inching closer to the psychologically significant 100 level, and as we know, when the dollar strengthens, risk assets often feel the heat. This interplay between the dollar's strength, inflation fears (reflected in oil's rise), and risk appetite is shaping the entire financial landscape, and BTC is right in the thick of it.
- Bitcoin's RSI is at 33.99 on the 1-hour chart, indicating oversold pressure and a potential short-term bounce.
- Critical support for BTCUSD sits at $68,261.33, a level that has been tested multiple times this week.
- The MACD histogram shows negative momentum on the 1-hour chart, suggesting bearish sentiment is still dominant despite oversold conditions.
- The strengthening DXY at 99.64 is a key macro driver, putting pressure on risk assets like Bitcoin.
Navigating the Crypto Storm: BTCUSD's Tightrope Walk
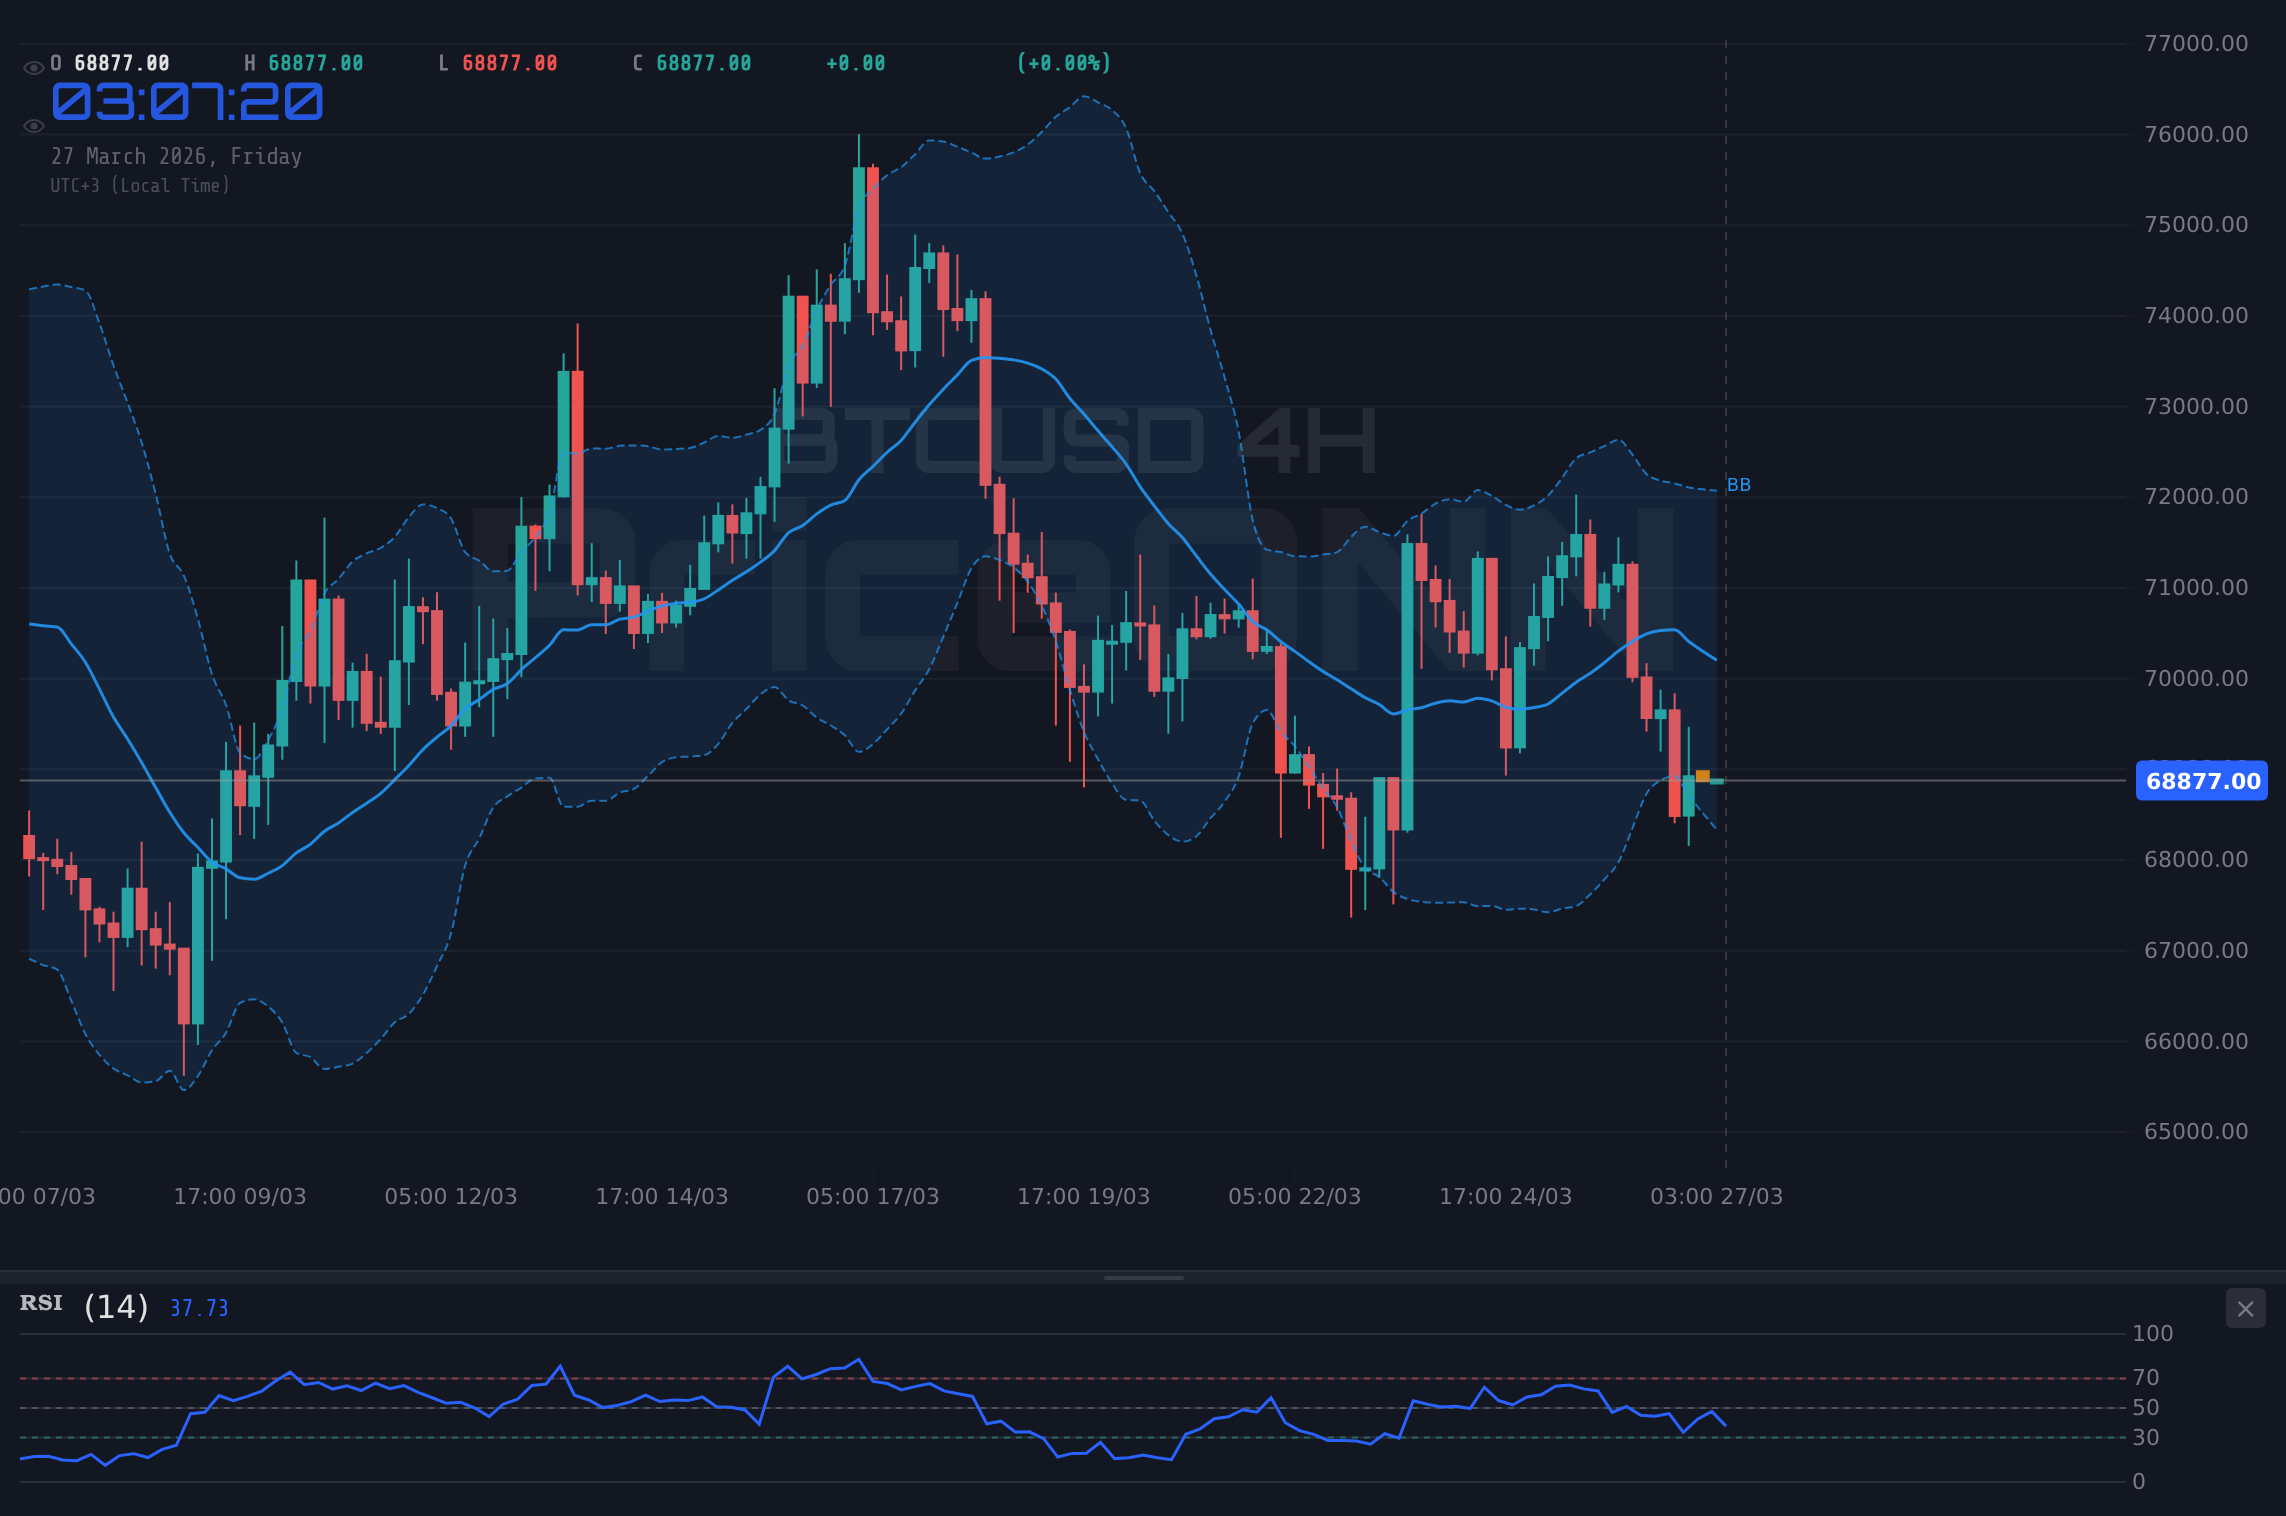
Let's dive straight into the action. Bitcoin is currently consolidating around the $68,787 mark, a price point that feels like a battleground. The past 24 hours have been a rollercoaster, with BTCUSD experiencing a sharp decline, down 3.17% or $2,251, trading between $68,156 and $71,559. This isn't just a minor dip; it's a significant move that has traders on edge. The 1-hour chart paints a picture of a strong downtrend, with an ADX reading of 29.57 signaling a robust trend. However, the RSI at 33.99 is deep in oversold territory. This is where the 'watch zone' comes into play. We're seeing a classic conflict: strong bearish momentum versus oversold conditions. It’s a tug-of-war that requires patience and a keen eye for confirmation. The MACD histogram remains negative, reinforcing the bearish sentiment, but the Stochastic showing a potential crossover (K line above D line) hints at a possible short-term reprieve. This divergence between momentum and oversold indicators is exactly what we look for to identify potential turning points, or conversely, signs of capitulation.
The 4-hour timeframe offers a slightly different, yet equally cautious, perspective. The trend here is neutral, with a Power rating of 50%, but the ADX at 17.55 suggests a weak trend, implying a lot of sideways movement or consolidation is likely before any significant directional move. Support is clearly defined at $67,475.33, with further levels at $66,545.67. Resistance, however, is a bit tighter in this timeframe, hovering around $69,415.67. The Stochastic is deep in oversold territory, but the MACD is firmly in negative momentum territory. This lack of a clear trend on the 4-hour chart, coupled with the strong downtrend on the 1-hour, means we’re likely in for a period of choppy price action. For swing traders, this suggests waiting for a clear breakout above resistance or a decisive hold of support before committing significant capital. The key here is to avoid chasing moves in a low-trend environment; it’s a recipe for getting whipsawed.
When we zoom out to the daily chart, the picture becomes clearer but no less complex. The trend is officially neutral, with a 50% power rating, and an ADX of 16.95 further confirms the lack of a dominant trend. This is crucial context. While short-term charts might show strong moves, the bigger picture suggests we are in a range-bound market. Support levels are identified at $68,226.67, with deeper levels at $67,111.67 and $66,226.67. Resistance looms around $71,996.67, a level that has acted as a ceiling recently. The RSI at 45.81 is in the neutral zone, neither overbought nor oversold, and the MACD is still showing negative momentum. The Stochastic, however, is giving a bullish signal with the K line above the D line, suggesting some buying pressure might be emerging from these lower levels. This contradictory signal across different timeframes - strong downtrend on 1H, weak trend on 4H, and neutral on 1D with conflicting indicators - is typical of a market consolidating after a significant move. The real question is what catalysts will break this stalemate.
On-Chain Insights: Whispers from the Bitcoin Network
Beyond the price action, the underlying health of the Bitcoin network provides crucial context. While the data doesn't show specific on-chain metrics for this exact moment, we can infer trends. Historically, during periods of price consolidation or sharp pullbacks like we're seeing, active addresses often either decline or remain stagnant, suggesting less retail enthusiasm. However, a sustained drop in active addresses below a certain threshold can be a bearish sign, indicating dwindling network utility. Conversely, if active addresses hold steady or even tick up during a price dip, it can signal strong conviction from existing holders. Whale movements are another critical factor. Large holders accumulating or distributing coins can significantly influence price. If we see large outflows from exchanges to private wallets, it's typically interpreted as a bullish sign, suggesting whales are moving assets to cold storage, anticipating future price appreciation. Conversely, large inflows to exchanges often precede selling pressure. We need to watch these flows closely; they often provide a leading indicator that pure price action misses.
The hash rate, a measure of the network's security and computing power, remains a key metric. A steadily rising or stable hash rate generally indicates network health and miner confidence, even if the price is temporarily down. Miners are incentivized by block rewards and transaction fees; if the price drop makes mining unprofitable for some, we might see a temporary dip in the hash rate. However, the long-term trend of the hash rate has been upward, driven by more efficient hardware and a growing network. This resilience in the mining sector is a fundamental strength for Bitcoin. Exchange flows are paramount. Large net inflows of BTC to exchanges often precede price drops, as sellers position themselves. Conversely, net outflows suggest buyers are taking control and securing their assets. While I don't have real-time exchange flow data here, this is a crucial on-chain metric to monitor closely in the coming days. The current price action suggests a potential shift, and tracking these flows will be vital to understanding whether this is a healthy correction or the start of a more significant downturn.
Always cross-reference on-chain data with price action. A divergence, like falling active addresses while price consolidates, is a strong signal to pay attention to. Whales moving coins off exchanges is a bullish sign; large inflows onto exchanges can precede a sell-off.
The Dollar's Ascent and Its Shadow Over Crypto
The strengthening US Dollar Index (DXY) is a dominant narrative right now, currently sitting at 99.64 and eyeing the critical 100 level. This isn't just an academic point; it has tangible effects on risk assets like Bitcoin. When the dollar strengthens, it typically makes dollar-denominated assets more expensive for holders of other currencies, potentially dampening demand. Furthermore, a stronger dollar often reflects increased global uncertainty or a 'risk-off' sentiment, where investors flock to perceived safe-haven assets like the dollar and US Treasuries, moving away from more speculative assets like cryptocurrencies and even gold. The fact that gold is down 2.18% ($98.14) to $4,408.16 and silver is down 3.37% ($2.40) to $68.81 further emphasizes this flight to safety. We're seeing a clear correlation play out: DXY up, risk assets down.
This macro backdrop is crucial for understanding Bitcoin's current predicament. While Bitcoin is often touted as an inflation hedge or a digital gold, its correlation with traditional risk assets, particularly tech stocks like the Nasdaq (down 1.88% or 454.08 to 23,703.55) and the S&P 500 (down 1.23% or 81.4 to 6,509.9), has been undeniable in recent years. When these indices sell off, Bitcoin often follows suit. The current market environment, characterized by geopolitical tensions (as hinted at by the oil price surge and supply fears in the Black Sea) and a hawkish stance from central banks worried about persistent inflation, creates a challenging landscape for risk assets. The market is pricing in a potentially longer period of higher interest rates, which can make holding non-yielding assets like Bitcoin less attractive compared to dollar-denominated assets offering higher yields.
The implications for BTCUSD are clear. As long as the DXY remains on an upward trajectory and risk appetite continues to wane globally, Bitcoin will likely face headwinds. The $68,787 level is therefore not just a price point but a battleground where macro forces are clashing with crypto-specific sentiment. A sustained move above the 100 level for the DXY could trigger further selling pressure across risk assets, potentially pushing BTCUSD towards its next support levels. Conversely, any sign of dollar weakness or a shift towards risk-on sentiment could provide Bitcoin with the breathing room it needs to attempt a recovery. We are watching the DXY's trajectory very closely; it's a key barometer for the broader market's risk appetite.
Technical Confluence: Reading the Signals at $68,787
Let's break down the technicals at this critical juncture around $68,787. On the 1-hour chart, the RSI at 33.99 is firmly in oversold territory. Historically, when RSI dips this low, it often precedes a bounce, though it can remain oversold for extended periods in strong downtrends. The MACD histogram is negative, indicating bearish momentum is still in play, but the fact that the MACD line is above the signal line on the 4-hour chart could suggest some underlying buying pressure attempting to surface. The Stochastic on the 1-hour chart is showing a bullish crossover (%K > %D), which is a short-term buy signal, but this needs to be confirmed by price action and other indicators.
The ADX on the 1-hour chart is 29.57, confirming a strong downtrend. This means that while oversold conditions exist, the trend is still very much in control. The 4-hour ADX at 17.55 indicates a weak trend, suggesting that the current price action might be more about consolidation than a continuation of the strong downtrend seen on the 1-hour chart. This conflict between the strong trend on the lower timeframe and the weak trend on the higher timeframe is what creates this 'watch zone'. We need to see if the short-term oversold conditions can overcome the prevailing bearish momentum. A close above the 1-hour resistance at $69,077.33 would be the first sign of strength, but confirmation would come from holding above it and a subsequent move towards the $69,415.67 level on the 4-hour chart.
The daily indicators offer a more neutral stance, but with underlying bearish signals. The RSI at 45.81 is in the middle ground, offering no clear directional bias. The MACD is still negative, and the Stochastic is showing a bearish signal (%K < %D), but the ADX at 16.95 points to a weak trend. This suggests that the daily timeframe is not yet showing a clear bullish reversal. For a bullish case to form, we would need to see BTCUSD decisively break above the $71,996.67 resistance on the daily chart, ideally with increasing volume and bullish divergences on indicators like RSI and MACD. Until then, any short-term bounces should be viewed with skepticism, especially with the macro headwinds from the strengthening dollar and risk-off sentiment.
The current technical setup presents conflicting signals. While oversold conditions on lower timeframes suggest a potential bounce, the strong downtrend and negative MACD momentum, coupled with macro headwinds, mean that any rallies could be met with significant selling pressure. Patience is key; wait for confirmation.
Crypto Ecosystem Health Check: Beyond the Price Tag
While the price of Bitcoin grabs headlines, the health of the broader crypto ecosystem is a vital fundamental indicator. Developments in Decentralized Finance (DeFi) and Non-Fungible Tokens (NFTs) can significantly impact investor sentiment and, consequently, Bitcoin's price. A thriving DeFi ecosystem, indicated by increasing Total Value Locked (TVL) across various protocols, suggests robust activity and innovation, which can indirectly benefit Bitcoin as the primary digital asset. Similarly, a resurgence in NFT markets, with rising sales volumes and unique buyer counts, can signal renewed retail interest in the crypto space. However, if these sectors show signs of stagnation or decline, it can contribute to a broader negative sentiment that weighs on BTCUSD. We need to monitor these developments closely; a healthy ecosystem provides a fundamental underpinning for price appreciation.
Regulatory news is another critical piece of the fundamental puzzle. Clarity on regulations, especially from major jurisdictions like the US, can significantly boost institutional adoption and investor confidence. Conversely, ambiguous or unfavorable regulatory developments can create uncertainty and lead to sell-offs. For instance, news about potential crackdowns on certain crypto activities or the approval of Bitcoin ETFs are major events that can move the market. The recent approval of Bitcoin ETFs has certainly been a factor in the market's narrative, bringing more institutional capital into the space. However, the current price action suggests that even positive inflows might be struggling against the prevailing macro headwinds. We must stay attuned to regulatory updates, as they can be major catalysts for both upward and downward price movements.
Bitcoin dominance is another metric worth watching. As the market leader, Bitcoin often dictates the trend for the entire crypto market. If Bitcoin's dominance percentage is rising, it suggests that capital is flowing into BTC, potentially at the expense of altcoins. If it's falling, it might indicate a 'altcoin season' where other cryptocurrencies are outperforming Bitcoin. Currently, with Bitcoin facing headwinds, its dominance might see fluctuations as traders seek opportunities in other assets or retreat to safer havens. The correlation between Bitcoin and major altcoins like Ethereum (ETHUSD currently at $2,060.45, down 4.68%) is also important. When BTCUSD falls sharply, ETHUSD and other altcoins often experience even larger percentage drops, amplifying the overall market sentiment. Understanding these correlations helps paint a more complete picture of market dynamics.
A strong DeFi TVL and a vibrant NFT market can provide fundamental support for Bitcoin. Regulatory clarity is paramount for institutional adoption, and Bitcoin's dominance often sets the tone for the broader crypto market.
Trade Scenarios: Where Do We Go From Here?
Bearish Scenario: The Downside Risk
65% ProbabilityNeutral Scenario: Consolidation at $68,787
25% ProbabilityBullish Scenario: A Bounce from the Depths
10% ProbabilityThe Road Ahead: What BTCUSD Traders Must Watch
The immediate future for BTCUSD hinges on a few key factors. Firstly, the direction of the US Dollar Index (DXY) is paramount. If the DXY continues its push towards and above 100, expect further pressure on Bitcoin. Traders should monitor any shifts in the Fed's rhetoric or upcoming economic data that could influence the dollar's strength. Secondly, the price action around the critical support level of $68,261.33 is non-negotiable. A break below this level, especially on increased volume, would invalidate any immediate bullish hopes and likely trigger a cascade towards lower support levels. Conversely, a strong bounce from this area, confirmed by holding the price and potentially reclaiming the $69,000 psychological level, could signal a short-term reprieve.
We also need to consider the broader market sentiment. The significant drops in gold and major equity indices suggest that 'risk-off' is the dominant theme. Until this sentiment shifts, Bitcoin may struggle to find sustainable upside momentum. On-chain metrics will be crucial for confirming any potential bottoms. Look for net exchange outflows, stable or rising active addresses, and a healthy hash rate as signs of underlying network strength. The recent Nvidia news, while not directly related to Bitcoin, highlights the volatility in tech-related assets, which can have a ripple effect. Remember, patience is a virtue in these choppy markets. Don't be tempted to catch a falling knife. Wait for clear signals and confirmed setups. The market always offers opportunities, but it's about waiting for the right conditions.
Frequently Asked Questions: BTCUSD Analysis
What happens if BTCUSD breaks below the $68,261.33 support level?
If BTCUSD closes decisively below $68,261.33 on a significant timeframe like the 4-hour chart, it would likely trigger further selling pressure. This could see the price test the next major support at $67,475.33, as traders react to the breakdown and the prevailing risk-off sentiment.
Should I buy BTCUSD at current levels around $68,787 given the oversold RSI on the 1-hour chart?
Buying solely based on an oversold RSI at 33.99 is risky. While it suggests a potential bounce, the strong downtrend momentum and negative MACD mean confirmation is needed. Wait for a clear break above $69,077.33 resistance, with increasing volume, before considering a short-term bullish entry.
Is the MACD histogram showing a sell signal for BTCUSD at $68,787?
The negative MACD histogram on the 1-hour chart indicates bearish momentum, reinforcing the downtrend. While the 4-hour MACD shows positive momentum, the overall picture suggests caution. This negative histogram reading is a key signal to watch for potential continuation of downside pressure.
How will the strengthening DXY towards 100 affect BTCUSD this week?
A DXY above 100 typically signifies increased global uncertainty and a 'risk-off' environment, which tends to put downward pressure on risk assets like Bitcoin. If the DXY holds above 100, it could exacerbate selling pressure on BTCUSD, potentially pushing it towards lower support levels.
Track markets in real-time
AI-powered analysis, technical indicators and real-time price data.
Join Our Telegram Channel
Breaking market news, AI analysis and trading signals instantly.
Join Channel