ETHUSD Weekly Outlook: Navigating the $1,990.34 Level Amidst Shifting Market Sentiment
ETHUSD hovers around $1,990.34, caught between a neutral trend and conflicting signals. Key levels and macro factors are crucial for the next move.
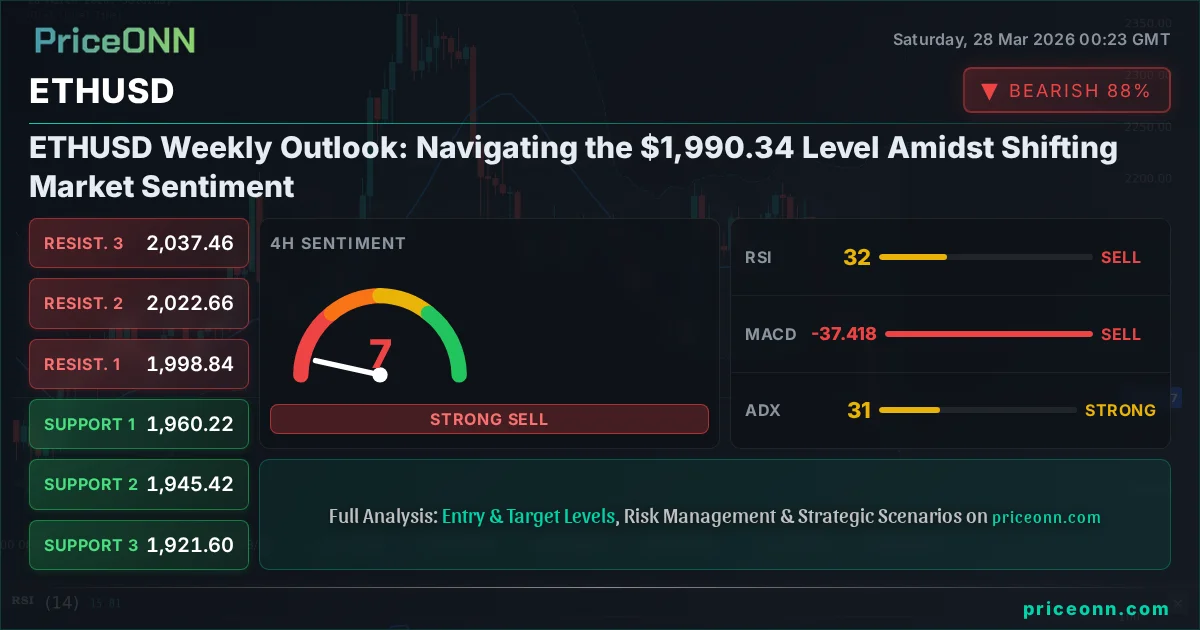
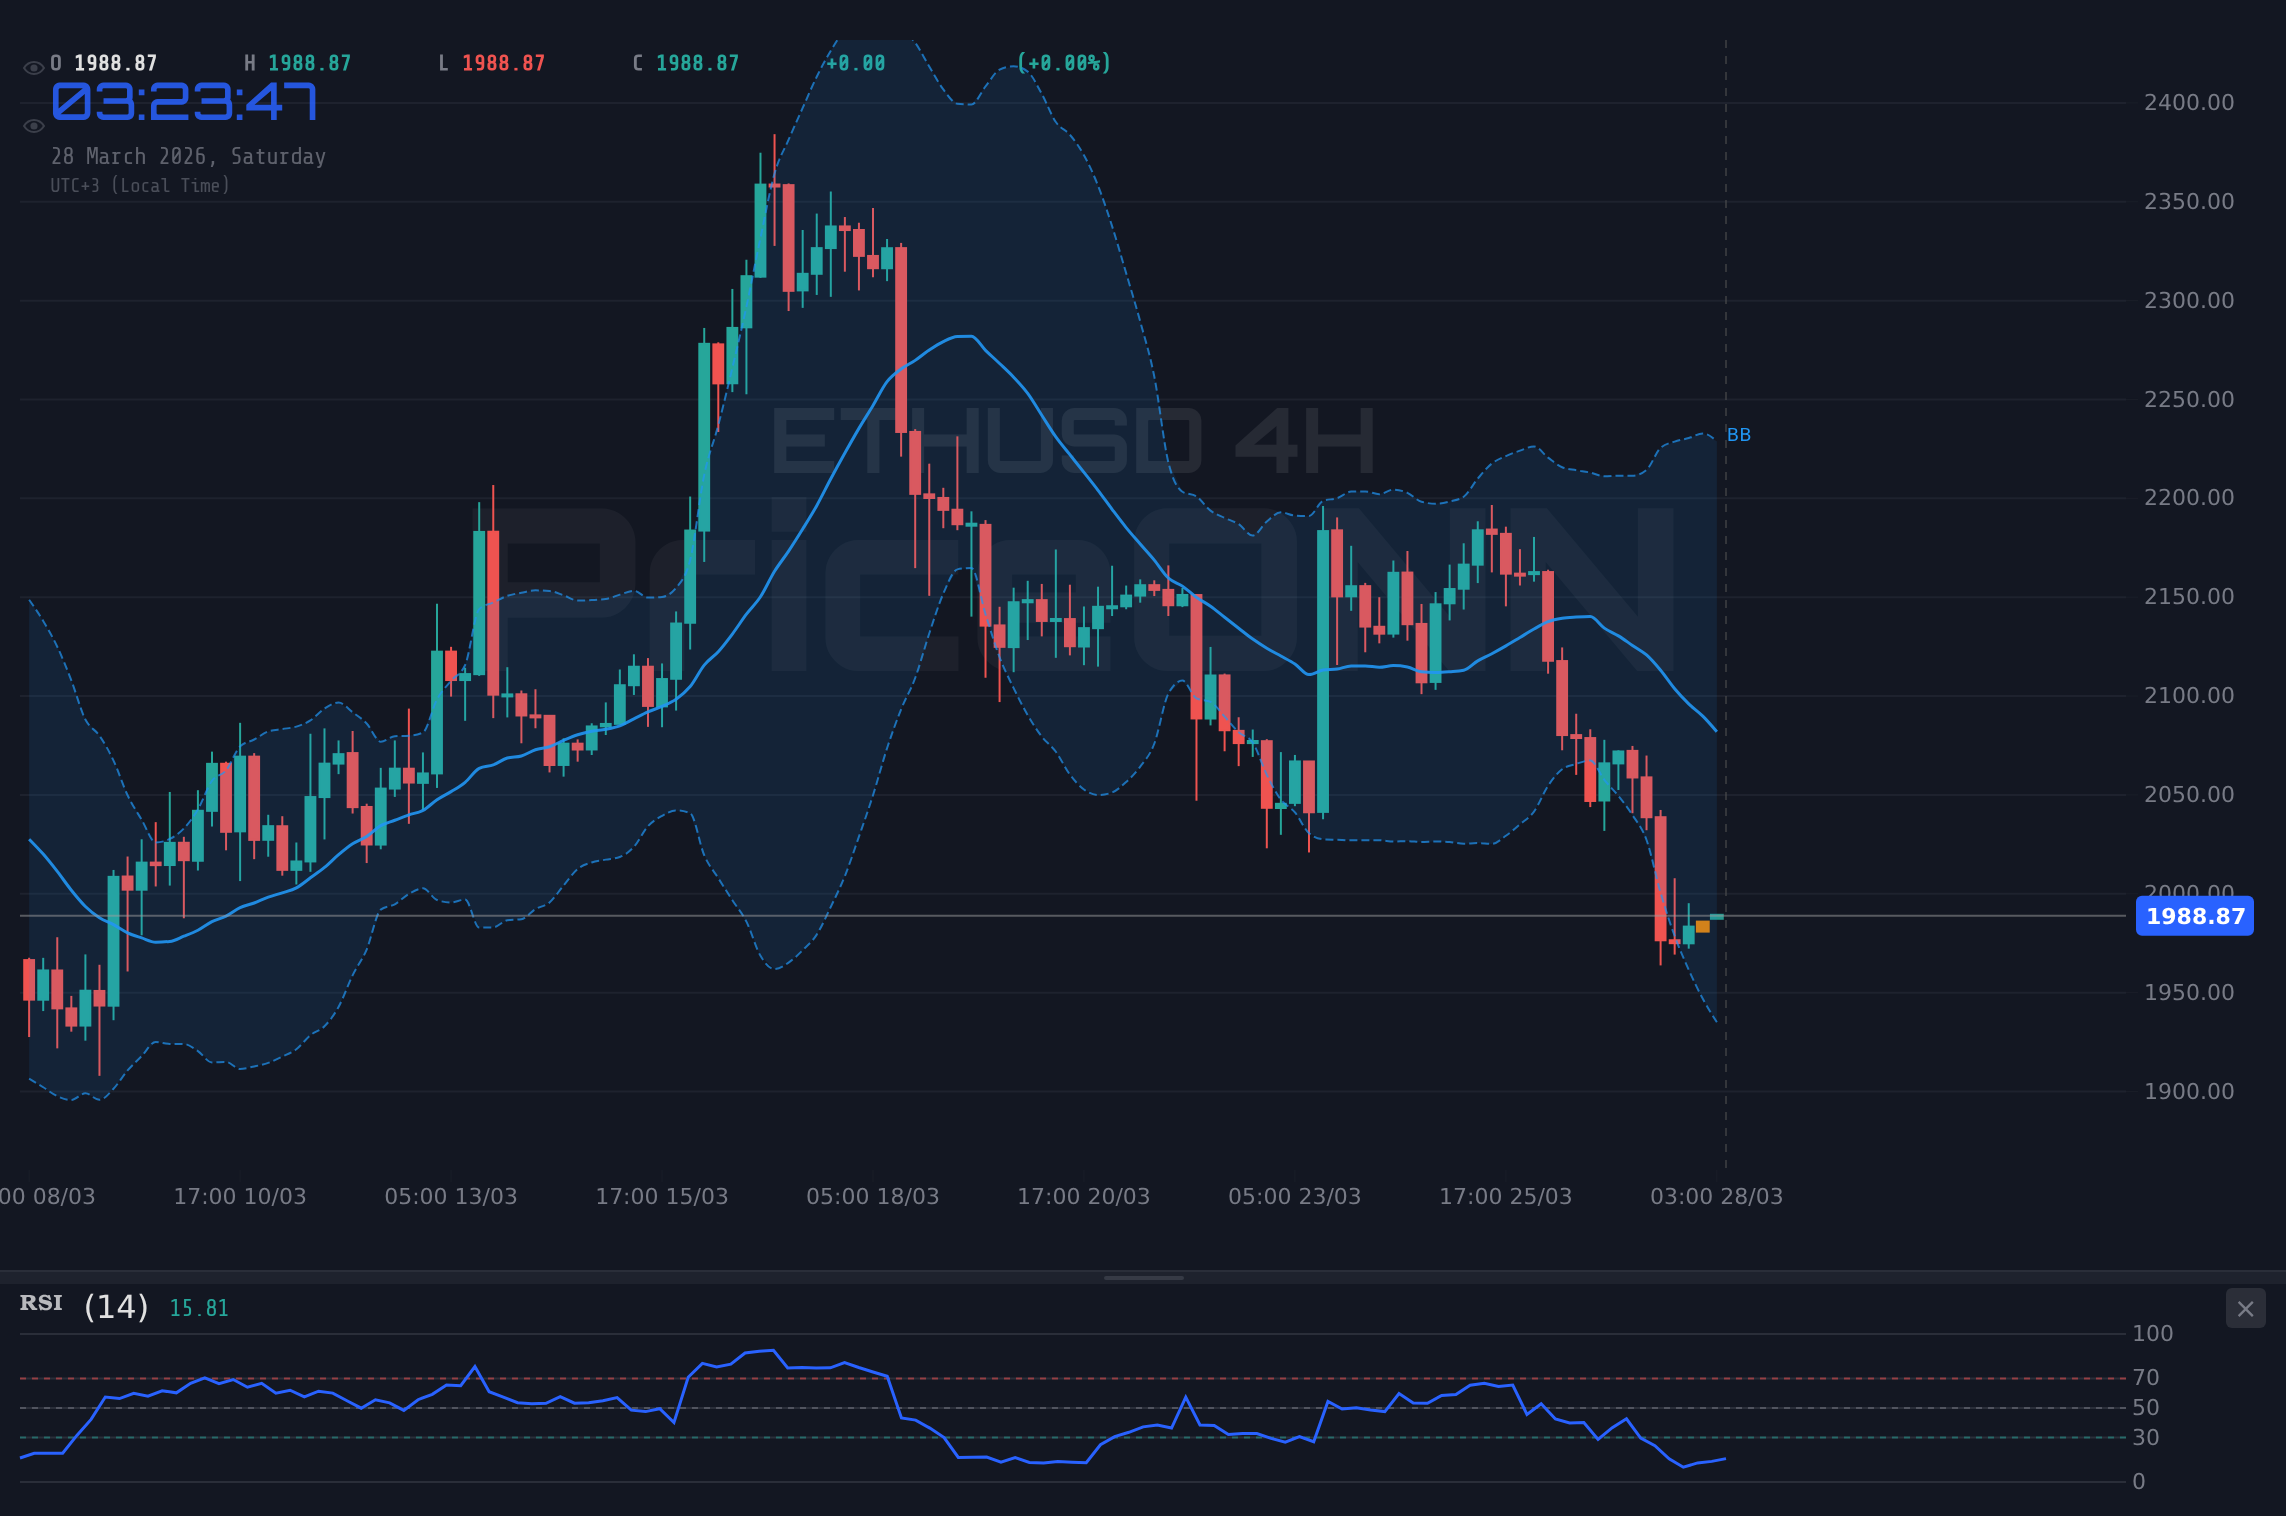
The cryptocurrency market, and particularly Ethereum (ETHUSD), is at a fascinating juncture. As of the last close on Friday, March 28th, 2026, ETHUSD was trading around the $1,990.34 mark. This price point isn't just a number; it represents a critical psychological and technical level that has held significance throughout the past week's trading sessions. While the 1-hour and 4-hour charts might hint at a cautious optimism or a neutral stance, the daily chart paints a more cautionary picture, suggesting that the prevailing trend might still be downwards, albeit with weakening conviction. This dichotomy is precisely where the real trading opportunities lie – in understanding the conflicting signals and identifying the catalysts that could break the current equilibrium. The past week has been a testament to this, with ETHUSD oscillating, testing key support and resistance zones without establishing a clear directional bias. The question on many traders' minds is whether the current consolidation is a prelude to a significant breakout or simply a pause before further downside. To answer this, we need to dissect the technical indicators, understand the broader market context, and consider the macroeconomic undercurrents that are undoubtedly influencing digital asset flows.
- ETHUSD is currently trading at $1,990.34, a critical neutral level.
- The daily chart shows a downtrend (ADX 30.99), while shorter timeframes suggest neutrality or a potential bounce.
- RSI at 36.08 on the 1H chart indicates a downward lean, but Stochastic's crossover hints at a possible short-term reversal.
- Key support is located at $1,979.97, with resistance eyed at $1,990.89 on the 1H chart.
- Broader market sentiment, influenced by DXY at 99.91 and a risk-off equity environment (SP500 at 6357.55), presents headwinds.
The past week for ETHUSD has been characterized by a persistent tug-of-war between buyers and sellers, failing to establish a definitive trend. On the daily timeframe, the technical picture, while showing a strong downtrend with an ADX of 30.99, is beginning to show signs of exhaustion. The RSI(14) hovers at 36.09, firmly in neutral territory but leaning towards oversold, suggesting that the selling pressure that defined previous weeks might be waning. However, the MACD remains below its signal line, and the histogram is negative, indicating that bearish momentum, though potentially weakening, is still dominant on the longest timeframe. This is a classic scenario where shorter-term signals might offer temporary relief or even a short-lived rally, but the overarching daily trend remains a significant hurdle for any sustained upside. The Stochastic indicator on the daily chart, with %K at 20.83 and %D at 26.66, is in oversold territory, flashing a potential buy signal. Yet, this signal needs to be viewed with extreme caution given the broader bearish context. It's like seeing a single green shoot after a harsh winter – it offers hope, but the ground is still frozen solid.
Zooming into the 4-hour timeframe, the picture becomes slightly more nuanced. The trend here is also classified as bearish with a power of 96%, and the ADX at 31.08 reinforces the presence of a strong trend. However, the RSI(14) is at 32.24, nearing the oversold threshold, and the Stochastic (%K 11.41, %D 13.56) is deeply oversold, presenting a more compelling, albeit still short-term, buy signal. The MACD is negative, but the histogram is narrowing, suggesting that bearish momentum is indeed decelerating. This timeframe often acts as a bridge between the longer-term daily view and the intraday fluctuations. A bounce from these oversold conditions on the 4-hour chart is certainly plausible, but its sustainability will hinge on breaking through immediate resistance levels and, crucially, on the daily chart's reaction. Without a daily trend reversal confirmation, any upward move could be viewed as a bear market rally – a temporary reprieve before the larger trend reasserts itself. It’s akin to a small boat trying to fight a strong current; it might make some headway upstream for a while, but the river’s overall direction is overwhelmingly powerful.
The 1-hour chart offers the most immediate tactical view, currently showing a neutral trend with a power of 50%. Here, the RSI is at 36.08, still indicating a bearish lean, but the Stochastic (%K 43.67, %D 37.75) has just crossed bullishly, presenting a short-term buy signal. This is where the immediate price action is most volatile and sensitive to news flow. The ADX at 38.95, however, is surprisingly strong for a neutral trend classification, suggesting that while the price might be consolidating, the underlying forces driving it are quite active and could lead to a sharp move. The immediate resistance on this timeframe is at $1,990.89, with support at $1,979.97. A decisive break above $1,990.89, especially on increasing volume, could trigger a short-term rally towards the next resistance at $2,005.03 (not explicitly listed on 1H but implied by daily levels). Conversely, a failure to hold $1,979.97 could see a quick drop towards the daily support levels. This intraday view is like observing the waves on the surface; they can be choppy and misleading, but they are ultimately dictated by the deeper ocean currents.
The Macroeconomic Crosscurrents: DXY and Risk Sentiment
To truly understand ETHUSD's predicament, we must look beyond its own charts and into the broader financial ecosystem. The US Dollar Index (DXY) is a critical barometer here. Currently trading at 99.91, the DXY is showing a strong upward trend on the daily chart (ADX 31.98) and is firmly above its daily mid-Bollinger band. A strengthening dollar typically acts as a headwind for risk assets like Ethereum, as it increases the cost of holding non-dollar denominated assets and signals a potential flight to safety. This is precisely what we are seeing with the major US equity indices. The S&P 500 is down significantly at 6357.55, and the Nasdaq 100 is at 23092.5, both showing strong daily downtrends. This risk-off sentiment in equities often spills over into the cryptocurrency market, as investors tend to reduce their exposure to higher-risk assets when global uncertainty rises. The correlation is clear: as DXY ascends and equities tumble, digital assets like ETHUSD often face selling pressure. This macroeconomic backdrop is not just noise; it’s a fundamental driver that can override short-term technical signals. It’s the tide pulling the boats, regardless of how individually they are sailing.
The energy markets, particularly Brent crude oil at $110.64 and WTI at $101.19, are also flashing warning signs. Their sharp rise, driven by geopolitical tensions, fuels inflation concerns. Higher inflation typically puts pressure on central banks to maintain tighter monetary policies, which can dampen risk appetite and indirectly pressure cryptocurrencies. While some might argue that Bitcoin and Ethereum could act as an inflation hedge, their correlation with risk assets like tech stocks has often overshadowed this narrative in recent times. The surge in oil prices, therefore, adds another layer of complexity, suggesting that the environment for risk assets remains challenging. This is not just about interest rates; it's about the overall cost of living and the potential for economic slowdown, which directly impacts disposable income available for speculative investments.
Crypto-Specific Developments: Tether's Audit and Layer-2 Solutions
Beyond the macro picture, the cryptocurrency space itself has seen significant developments. The news that Tether (USDT) has engaged KPMG for its first full audit is a notable event. While not directly impacting ETHUSD's price in the short term, increased transparency and regulatory compliance from stablecoin issuers like Tether can bolster overall confidence in the crypto ecosystem. Greater trust in stablecoins can lead to increased institutional inflows and a more stable foundation for trading, which is indirectly beneficial for all major cryptocurrencies. This move towards greater transparency is crucial for bridging the gap between traditional finance and the digital asset world. It signals maturity and a response to regulatory pressures, which could pave the way for broader adoption. Think of it as a company tidying up its balance sheet before seeking a major investment – it builds credibility.
Furthermore, the ongoing development and adoption of Ethereum's Layer-2 scaling solutions continue to be a critical narrative. Solutions like Optimism, Arbitrum, and zk-rollups are designed to address Ethereum's scalability and transaction fee issues. As these networks mature and attract more users and Total Value Locked (TVL), they enhance the utility and attractiveness of the Ethereum ecosystem as a whole. Increased activity on Layer-2s can lead to higher demand for ETH as a staking asset and a medium for gas fees, even if those fees are paid on the L2. The ongoing innovation in this space is vital for Ethereum's long-term competitive advantage against other blockchain platforms. It’s about making the network more efficient and user-friendly, which is fundamental for growth. This progress is less about immediate price action and more about building the infrastructure for future value accrual.
On-chain metrics for Ethereum itself present a mixed, though generally cautious, picture. While active addresses and transaction counts might not be showing explosive growth, the underlying network activity remains substantial. Whale movements, particularly large accumulations or distributions, are always worth monitoring. If large holders begin to accumulate ETH at these levels, it could signal confidence in a potential bottom. Conversely, significant outflows from exchanges could suggest holders are moving assets to cold storage, anticipating a price increase, or preparing for staking. However, without concrete data on these movements readily available in the provided context, it's prudent to focus on the readily observable price action and broader market indicators. The 'smart money' often leaves subtle clues, but deciphering them requires deep dives into specialized on-chain analytics platforms.
Analyzing the Technicals: Key Levels and Indicator Conflicts
Let's revisit the technicals with a clear understanding of the macro and crypto-specific context. On the daily chart, the critical support level to watch is $1,944.08, followed by $1,856.36. These are the levels where significant buying interest has historically emerged, or where a breakdown could accelerate. Resistance, on the other hand, is formidable. The immediate daily resistance is at $2,005.03, a level that has acted as a ceiling in recent trading sessions. Above that, we have $2,153.7 and then a more significant psychological barrier around $2,241.42. The fact that the daily ADX is still strong (30.99) suggests that any rallies might face stiff headwinds at these resistance points. The conflict between the daily oversold Stochastic signal and the bearish MACD is a classic dilemma. It suggests that while a short-term bounce is possible from current levels, the larger trend remains bearish until confirmed otherwise by price action and a shift in daily indicators.
The 4-hour chart's oversold Stochastic ($K=11.41, D=13.56$) and RSI nearing 30 (32.24) at $1,960.22 support the idea of a potential short-term bounce. If ETHUSD can hold above the $1,979.97 support on the 1-hour chart and push through the $1,990.89 resistance, we could see a move towards the $2,005.03 daily resistance. This would be a test of the downtrend's conviction. However, the strength of the downtrend on the daily chart (ADX 30.99) means that this resistance zone is likely to be a significant battleground. A failure to break $2,005.03 could lead to a resumption of the downtrend, targeting the 4-hour support at $1,960.22, and potentially lower. The ADX at 31.08 on the 4H chart indicates strong trending conditions, which means that once a direction is established, it tends to persist. The current consolidation might be a temporary pause before that next directional move.
It is crucial to acknowledge the indicator conflicts. For instance, on the 1-hour chart, we see a bullish Stochastic crossover while the RSI remains bearish. On the daily, the Stochastic hints at a potential bottoming, but the MACD remains firmly negative. This divergence and conflict are precisely why a 'Watch Zone' recommendation is appropriate. We are in a period where short-term tactical trades might be possible, but a clear, higher-probability setup for a sustained move requires more confirmation. The market is essentially telling us to wait. It’s like standing at a crossroads with multiple paths; you can take a quick step down one, but you need to be sure it’s the right direction before committing your resources. Patience is key here, allowing the price action to provide clearer signals.
Trade Scenarios and Risk Management
Given the conflicting signals and the neutral-to-bearish overall technical picture, caution is the prevailing theme. A 'Watch Zone' approach is most prudent, waiting for a clearer directional bias to emerge. The key is not to force trades but to identify setups that align with a higher probability of success, informed by both technicals and the macro environment. Managing risk is paramount, especially in a market environment where geopolitical tensions are high and central bank policies remain a significant wildcard.
Bearish Scenario: Downside Continuation
65% ProbabilityNeutral Scenario: Consolidation Around $1,990
25% ProbabilityBullish Scenario: Short-Term Rebound
10% ProbabilityThe 'Watch Zone' strategy emphasizes patience. A daily close below $1,944.08 would invalidate any immediate hopes for a significant rally and likely usher in a period of further downside, targeting the $1,921.60 level on the 4-hour chart and subsequently the daily support at $1,856.36. On the flip side, for the bulls to gain traction, a decisive daily close above the $2,005.03 resistance is needed. This would signal a potential shift in momentum, opening the door for a move towards $2,153.70. However, given the current macro headwinds and the daily bearish trend, this bullish scenario appears less probable in the short term. The neutral scenario, characterized by range-bound trading between $1,979.97 and $2,005.03, remains a distinct possibility, especially if no major catalysts emerge from upcoming economic data or geopolitical news. This would be a period of waiting, where smaller, tactical trades might be possible within the range, but larger directional bets would be ill-advised.
Economic Calendar Watchlist for the Coming Week
The economic calendar for the upcoming week holds several key events that could significantly impact ETHUSD. While the provided data is limited, we can infer the importance of upcoming US Dollar releases. Any significant deviation in US inflation data (actual vs. forecast) or employment figures, such as Non-Farm Payrolls (NFP), will be closely scrutinized. If these figures come in stronger than expected, it could reinforce the US Dollar's strength (as seen with the DXY at 99.91) and potentially pressure ETHUSD lower, especially if it leads to hawkish expectations from the Federal Reserve. Conversely, weaker-than-expected data could weaken the dollar, potentially providing some relief to risk assets like Ethereum. Investors will be looking for any hints about the Fed's monetary policy stance – will they maintain a hawkish tone, signal a pause, or even consider rate cuts? The market's reaction to these data points will be crucial in determining whether ETHUSD can break its current neutral-to-bearish trend.
Furthermore, any significant geopolitical developments, especially those impacting energy prices or global stability, will bear watching. The current surge in oil prices, driven by Middle East tensions, is a clear indicator of elevated geopolitical risk. Such events often trigger flight-to-safety flows, benefiting the US Dollar and potentially hurting riskier assets like ETHUSD. Traders will need to stay attuned to news headlines and assess their potential impact on market sentiment and risk appetite. The narrative around inflation, central bank responses, and geopolitical stability will likely dominate market discussions and influence ETHUSD's price action in the coming days. It’s a complex web, and the next week’s data releases will be key to untangling it.
The strong daily downtrend (ADX 30.99) and the prevailing risk-off sentiment in equities, coupled with a strengthening DXY (99.91), present significant headwinds for ETHUSD. Any rallies should be viewed with caution until a clear daily trend reversal is confirmed.
Frequently Asked Questions: ETHUSD Analysis
What happens if ETHUSD breaks below the $1,979.97 support level on the 1-hour chart?
A break below $1,979.97 on the 1-hour chart would likely trigger further downside, potentially accelerating towards the 4-hour support at $1,960.22. This would confirm the bearish bias suggested by the daily trend, as the market would be testing lower price levels with increased conviction.
Should I consider buying ETHUSD at current levels around $1,990.34 given the oversold Stochastic on the 4-hour chart?
Buying at current levels carries significant risk due to the dominant daily downtrend. While the 4-hour Stochastic at 11.41 suggests a potential short-term bounce, confirmation is needed. A safer approach would be to wait for a confirmed break above $2,005.03 resistance or a clear bullish reversal pattern on the daily chart.
Is the RSI at 36.09 on the 1-hour chart a sell signal for ETHUSD?
An RSI of 36.09 on the 1-hour chart indicates a bearish lean, suggesting that selling pressure is present. However, it's not in extreme oversold territory (below 30), and given the conflicting Stochastic signal, it's more of a cautionary note than a definitive sell signal on its own. Confirmation from price action is essential.
How will the upcoming US economic data releases affect ETHUSD trading this week, given the DXY is at 99.91?
Stronger-than-expected US data could push the DXY higher, increasing pressure on ETHUSD around its $1,990.34 level. Conversely, weaker data might lead to dollar weakness, offering potential relief and a chance for ETHUSD to test higher resistance levels, particularly if it aligns with improved risk sentiment.
The path forward for ETHUSD hinges on several factors. The interplay between macroeconomics, particularly the strength of the US Dollar and risk appetite, alongside crypto-specific developments and the resolution of conflicting technical signals, will dictate its trajectory. While short-term bounces are possible from the current oversold conditions on shorter timeframes, the overarching daily downtrend remains a significant challenge. Traders should remain vigilant, manage risk meticulously, and wait for clearer signals before committing to significant positions. The market is a dynamic entity, and only through careful observation and disciplined execution can one navigate these choppy waters successfully.
Technical Outlook Summary
| Indicator | Value | Signal | Interpretation |
|---|---|---|---|
| RSI (14) | 36.09 | Bearish | Downward lean, nearing oversold on 1H/4H. |
| MACD Histogram | -1.75 | Bearish | Negative momentum, narrowing on daily, suggesting deceleration. |
| Stochastic | K:43.67, D:37.75 | Bullish Crossover | Bullish crossover on 1H, deep oversold on 4H/1D, potential bounce. |
| ADX | 38.95 | Strong Trend | Strong trend indicated on 1H, supporting current directional bias. |
| Bollinger Bands | Mid Band Break | Bearish | Price below mid-band on 1H/4H, indicating bearish pressure. |
Key Levels
Track markets in real-time
AI-powered analysis, technical indicators and real-time price data.
Join Our Telegram Channel
Breaking market news, AI analysis and trading signals instantly.
Join Channel