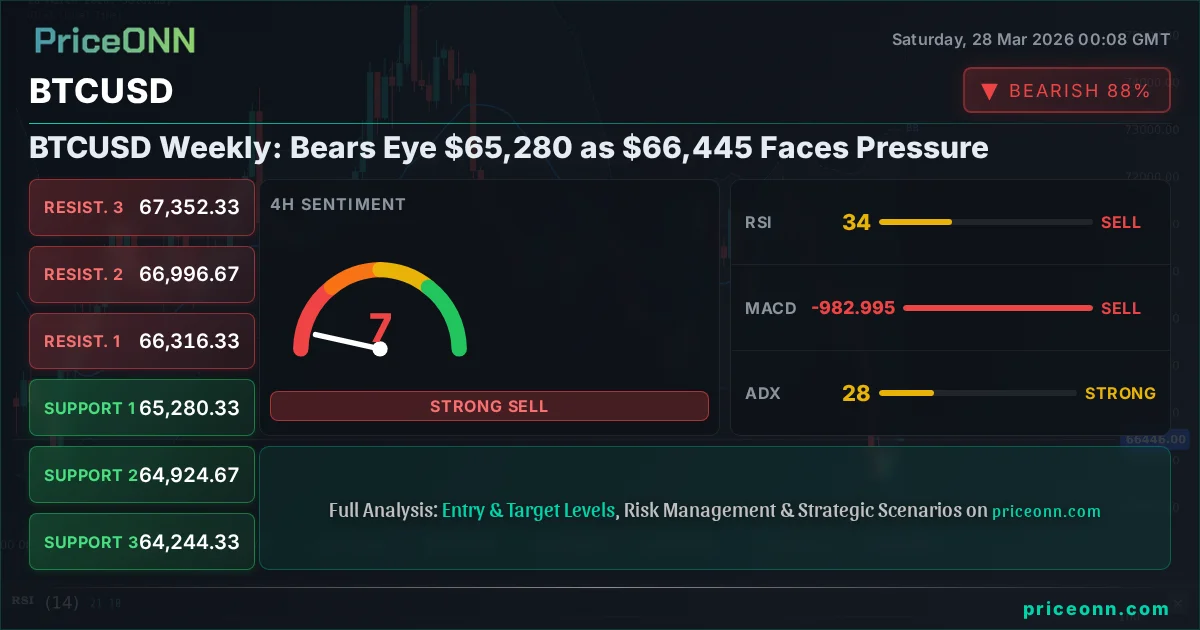
BTCUSD Weekly: Bears Eye $65,280 as $66,445 Faces Pressure
BTCUSD hovers near $66,445, with bears targeting $65,280. A breakdown below key support could trigger further downside amid broader market risk aversion.
The cryptocurrency market is at a critical juncture, with Bitcoin (BTCUSD) consolidating around the $66,445 mark. This week has been defined by a fierce tug-of-war between bulls attempting to defend key support levels and bears pushing for a deeper correction. The prevailing risk-off sentiment across global markets, coupled with specific crypto-native headwinds, paints a complex picture for the week ahead. Today's BTCUSD analysis delves into the technical indicators, on-chain metrics, and market sentiment to decipher the most probable scenarios.
- Bitcoin's price is currently $66,445, with the 1H chart showing a neutral trend (50% strength) while 1D trend is neutral (50% strength) suggesting consolidation.
- Critical support for BTCUSD is identified at $65,280, with further levels at $64,924 and $64,244. The 1D chart shows support at $67,533.
- The RSI(14) on the 1H chart sits at 37.08, indicating a bearish trend, while the 1D RSI is at 40.83, also pointing to a bearish outlook.
- The current market sentiment, influenced by global risk aversion and specific crypto news, suggests a cautious approach is warranted for traders monitoring BTCUSD.
The $66,445 price point for BTCUSD is more than just a number; it's a battleground. Last week saw Bitcoin flirt with the $70,000 mark, only to reverse sharply as global equity markets experienced significant pullbacks. This volatility underscores the increasing correlation between digital assets and traditional risk sentiment. As traders digest the week's events, the question on everyone's mind is whether the current consolidation represents a healthy pause before further upside or a prelude to a more substantial decline. Our comprehensive BTCUSD today analysis will dissect the technical signals and fundamental undercurrents shaping this narrative.
The broader market context cannot be overstated. A sharp decline in major indices like the S&P 500 (currently at 6357.55) and Nasdaq 100 (at 23092.5) signals a clear risk-off environment. This typically translates to reduced appetite for speculative assets, including cryptocurrencies. The Dollar Index (DXY), currently testing 99.91, has also seen strength, further pressuring assets priced in USD. This correlation analysis is crucial for understanding the external forces impacting BTCUSD. When the DXY strengthens, it often acts as a headwind for Bitcoin, as seen in historical price action. The current setup suggests that any sustained weakness in risk assets could lead to further outflows from Bitcoin, testing its key support levels.
From a technical standpoint, the BTCUSD chart presents a mixed but predominantly cautious signal. On the 1-hour timeframe, the trend is neutral with a strength of 50%, indicating a lack of decisive direction. The RSI(14) at 37.08 suggests bearish momentum is building, a signal that contradicts the MACD, which is showing positive momentum on the same timeframe. This divergence is precisely why traders must exercise patience. The Stochastic Oscillator, with %K at 56.99 and %D at 32.5, indicates a potential for upward movement, but this is tempered by the ADX at 46.88, signaling a strong downward trend. This complexity highlights the need for a multi-timeframe analysis to avoid premature conclusions.
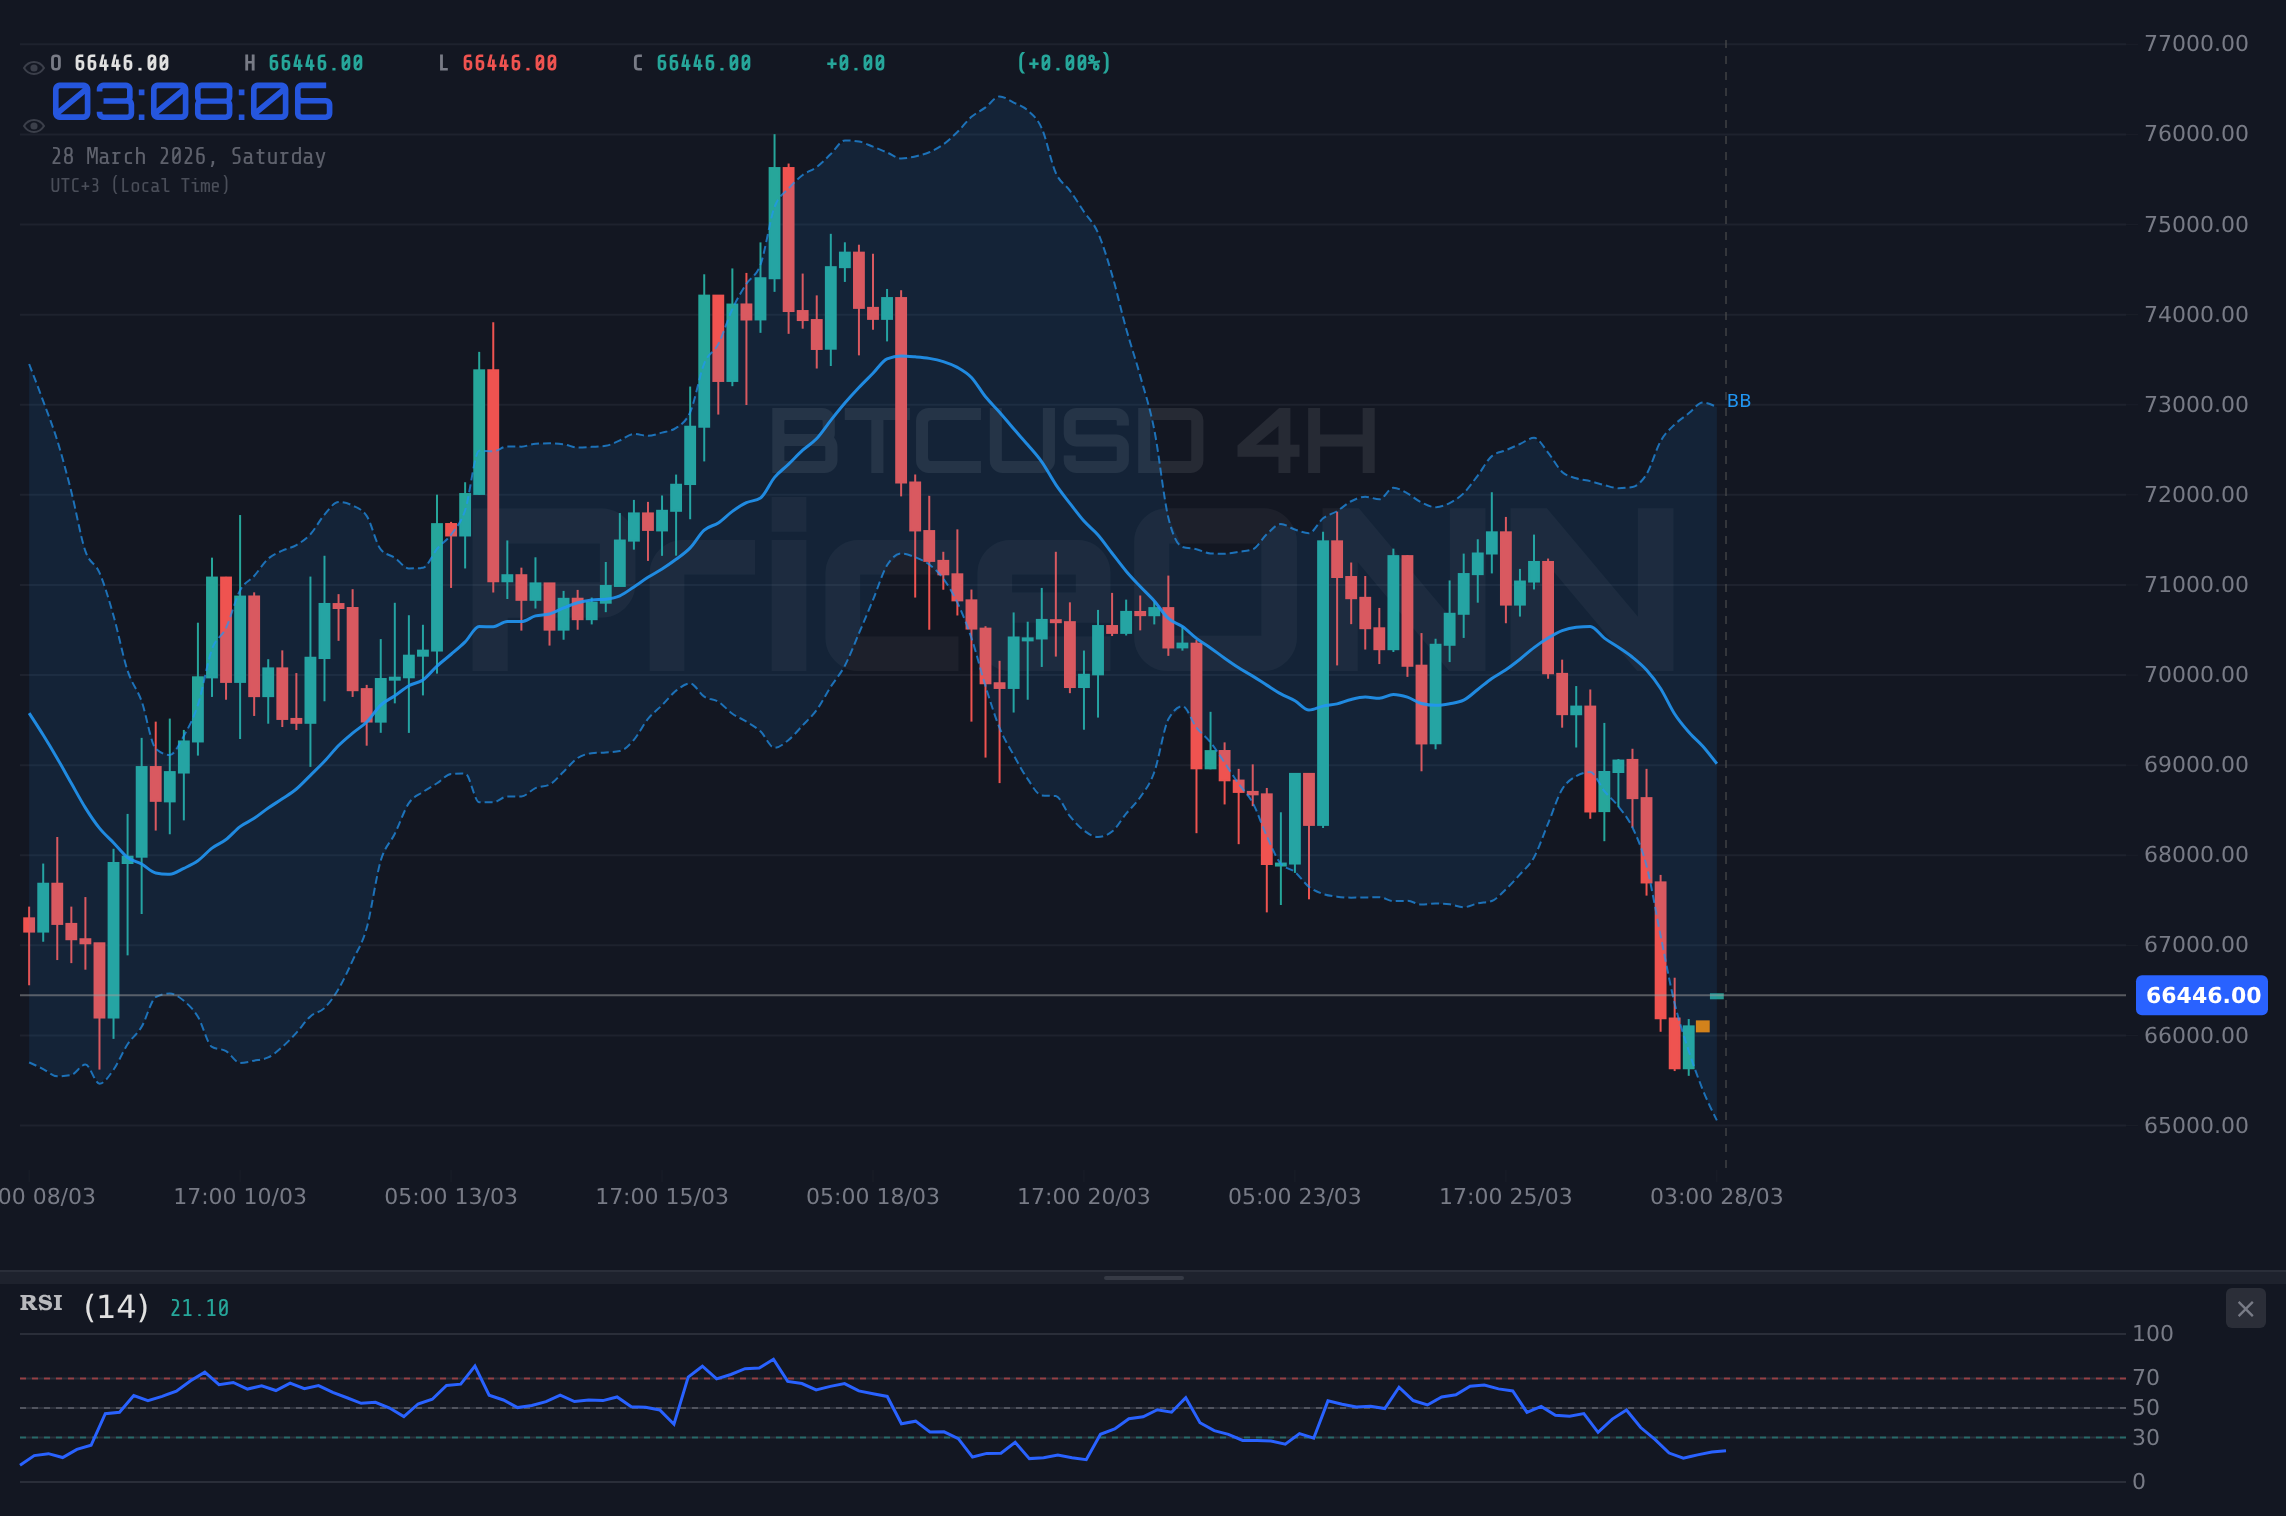
Digging deeper into the 4-hour chart for BTCUSD, the picture becomes clearer, leaning towards bearish sentiment. The trend is firmly established as downward, with a strength of 100%. The RSI(14) at 34.18 reinforces this bearish outlook, hovering in neutral territory but trending lower. The MACD is firmly in negative territory, below its signal line, confirming selling pressure. The Stochastic Oscillator is deep in oversold territory (%K: 8.06, %D: 11.12), suggesting a potential short-term bounce is possible, but the ADX at 28.11 indicates a strong downward trend is in play. This timeframe's data suggests that any rallies are likely to be met with selling pressure.
The daily BTCUSD chart offers the longest-term perspective, and it currently sits in neutral territory with a trend strength of 50%. However, the indicators here are also leaning bearish. The RSI(14) is at 40.83, suggesting room for further downside before hitting oversold conditions. The MACD is negative, and the Bollinger Bands are showing the price below the middle band, indicating a bearish bias. The Stochastic Oscillator (%K: 25.78, %D: 27.42) is trending lower, suggesting a continuation of the downtrend. While the ADX at 17.13 indicates a weak trend, the overall confluence of bearish signals across multiple timeframes warrants caution. The key levels to watch on this daily chart are support at $67,533 and resistance at $70,936.
The Bull Case: Defending the Foundation
Despite the bearish signals on shorter timeframes and the prevailing risk-off mood, the bulls are not entirely without hope. One of the primary arguments for a bullish continuation hinges on Bitcoin's resilience and its ability to hold critical support levels. The $65,280 level, derived from the 4-hour chart's support data, is seen as a crucial psychological and technical barrier. Historically, Bitcoin has demonstrated a remarkable capacity to bounce back from oversold conditions, especially after significant price drops. The current RSI readings, while not deeply oversold on the daily chart (40.83), are approaching levels that have previously marked significant turning points.
Furthermore, the recent influx of institutional interest, particularly in Bitcoin ETFs, cannot be entirely dismissed. While net outflows have been observed in recent days amidst market turmoil, the underlying structural demand from these products remains a potential tailwind. If global risk sentiment stabilizes or even shows signs of a rebound, capital could flow back into perceived safe-haven assets like Bitcoin. The argument here is that the current price action is a temporary correction within a larger bull market, driven by macro factors rather than a fundamental flaw in Bitcoin's long-term investment thesis. The strength of on-chain metrics, such as active addresses and whale movements, will be critical to watch for signs of accumulation during this dip.
On the technical front, the bulls will be looking for a decisive close above the $66,445 immediate resistance on the 1-hour chart. Confirmation would ideally come with increasing trading volume and a break above the neutral trend indicators. A successful reclaim of this level could signal a short-term reversal, potentially targeting the $67,533 support level (now acting as resistance) and then pushing towards the higher resistance levels identified on the daily chart around $70,936. The Stochastic Oscillator on the 1-hour chart, showing %K above %D, offers a glimmer of hope for short-term upside, but this signal needs confirmation from other indicators and sustained buying pressure.
The Bear Case: Cracks in the Foundation
Conversely, the bears have a compelling narrative supported by a confluence of bearish technical signals and a deteriorating macro environment. The sharp drop in major stock indices and the strengthening US Dollar (DXY at 99.91) create a challenging backdrop for risk assets like BTCUSD. The correlation between Bitcoin and equities has become increasingly pronounced, meaning a sustained selloff in stocks is likely to drag Bitcoin down with it. The 4-hour and 1-day charts both show strong downward trends, with RSI values suggesting significant room for further decline before reaching oversold territory. The current BTCUSD price of $66,445 is precariously close to critical support zones.
The key levels to watch for the bears are the immediate support at $65,280, followed by $64,924 and $64,244 on the 4-hour chart. A decisive break below $65,280, especially on increased volume, could trigger a cascade of stop-loss orders, accelerating the downward move. On-chain data also provides some cautionary signals. While not overtly alarming, any increase in selling pressure from long-term holders or significant outflows from exchanges could exacerbate downward price action. The recent news about institutional sentiment shifting, as reported by PriceONN, also plays into the bears' hands, suggesting that the flow of new capital might slow or even reverse.
Technically, the bears are looking for a failure to hold the $66,445 level and a subsequent break below the $65,280 support. The ADX values on the 4-hour (28.11) and 1-day (17.13) charts, while showing varying trend strengths, do not invalidate the potential for a significant move lower if key support gives way. The fact that the daily RSI is still above 40, and the daily MACD is negative, provides ample room for BTCUSD to decline further without hitting extreme oversold conditions. The prevailing market sentiment, characterized by fear and uncertainty, further bolsters the bear case, suggesting that risk-aversion will dominate trading decisions in the short term.
Navigating the Neutral Zone: What the Data Tells Us
The current BTCUSD market condition, sitting at $66,445, is best described as a neutral trend on the daily timeframe, albeit with strong bearish signals on shorter timeframes and a significant overall downward trend strength on the 4-hour chart. This dichotomy is where discerning traders find opportunity, but it also requires a high degree of risk management. The conflicting signals from indicators like the Stochastic Oscillator (suggesting potential upside) versus the RSI and ADX (indicating bearish momentum and trend) create a 'watch zone' rather than a clear trading signal.
The critical support at $65,280 and the immediate resistance around $66,445 are the levels that will dictate the near-term direction. A break and hold above $66,445, confirmed by rising volume and a shift in shorter-term indicators towards bullishness, could signal a move towards the $67,533 area. Conversely, a decisive break below $65,280, accompanied by increasing bearish momentum across timeframes, would likely lead to a test of the $64,924 support. The market sentiment, heavily influenced by global macroeconomic factors and crypto-specific news, will play a pivotal role in determining which scenario unfolds.
The PriceONN market news highlights a prevailing risk-off sentiment, which is a significant factor for BTCUSD. Reports of Bitcoin and Ethereum facing renewed selling pressure as global risk aversion mounts reinforce the need for caution. While some might see the current levels as an opportunity to accumulate, the technical picture and the macroeconomic backdrop suggest that further downside is a distinct possibility. The key for any trader right now is to define their risk parameters clearly and wait for a confirmed break of either the key support or resistance levels before committing to a directional trade.
The absence of a clear, strong trend on the daily chart, despite bearish signals on intraday and 4-hour frames, creates a period of indecision. This is often characterized by choppy price action and false breakouts. Traders should be wary of volatile swings around the $66,445 level. The strength of the ADX on the 1-hour chart (46.88) suggests that if a move does occur, it could be sharp. Therefore, managing risk and waiting for confirmation are paramount. The $65,280 support level remains the most critical point to monitor; a failure here opens the door to significant downside targets.
Looking at on-chain metrics, while not explicitly provided, general trends are important. If exchange inflows increase significantly or whale addresses show heavy selling, it would lend more weight to the bearish case. Conversely, a sustained drop in exchange balances and stable or increasing active addresses would support the bull case, even amidst technical weakness. The upcoming week's economic calendar, particularly any data releases that might influence central bank policy or risk appetite, will also be closely watched. Any surprising inflation or employment figures could trigger significant market movements across all asset classes, including BTCUSD.
The narrative around Bitcoin ETFs continues to be a background factor. While recent outflows have dampened enthusiasm, the long-term structural demand from these products remains a bullish underpinning. However, in the short term, macroeconomic concerns and technical weakness tend to dominate price action. The $66,445 level represents a crucial psychological barrier. Its hold or failure will likely set the tone for the next phase of price discovery. Traders are advised to watch for volume confirmation on any break of the immediate range.
The current situation for BTCUSD is a classic example of market indecision amplified by external factors. The neutral daily trend, combined with bearish shorter-term signals and a risk-off global environment, creates a volatile trading landscape. The $65,280 support level is the line in the sand for the bulls. A break below it would invalidate the argument for a near-term bounce and likely lead to a test of lower support levels. Until then, expect range-bound trading with potential for sharp, unpredictable moves as both sides battle for control around the $66,445 price point.
On-chain analysis typically provides crucial context. For instance, a high hash rate indicates network security and miner confidence, which is generally bullish. Conversely, a sharp drop in active addresses or an increase in whale outflows could signal waning interest or distribution. Without specific on-chain data in this report, we rely on technicals and macro correlation, which currently lean towards caution. The interplay between these factors will be key in determining the next significant move for BTCUSD.
The institutional adoption narrative remains a long-term positive for Bitcoin. However, short-term price action is often dictated by liquidity and sentiment. If major players begin to reduce their exposure due to macro fears, even strong fundamentals can be overshadowed. The current technical setup at $66,445 suggests that the market is in a 'wait-and-see' mode, with traders looking for clearer signals from either the macroeconomic environment or a decisive technical breakout/breakdown.
The volatility observed in BTCUSD is not unique; it mirrors the broader market's reaction to uncertainty. The fact that Bitcoin is trading around $66,445 while major indices are in sharp decline highlights its increasing integration into the global financial ecosystem. This means that events impacting traditional markets will likely continue to have a pronounced effect on cryptocurrency prices. Therefore, monitoring DXY, S&P 500, and Nasdaq movements is as crucial as analyzing BTCUSD's own chart.
The prevailing ADX values across different timeframes suggest that while there might be short-term fluctuations, the underlying trend is either weak (daily) or strong bearish (4-hour). This means that any potential upward moves might be short-lived unless broader market conditions improve significantly or strong buying conviction emerges. The $65,280 support level remains the most critical point to watch. A failure to hold this level could trigger a rapid decline, testing lower psychological and technical barriers.
The BTCUSD price action around $66,445 is currently balanced precariously. While some indicators hint at potential short-term bounces, the dominant bearish technicals on shorter timeframes, coupled with a global risk-off sentiment and strengthening dollar, suggest that the path of least resistance may be downwards. The key support at $65,280 is the level to monitor. A break below it would likely confirm a bearish outlook, targeting lower levels. Bulls need to see a decisive reclaim of $66,445 and subsequent strength to invalidate the current downside pressure.
The upcoming week holds several key economic events that could influence market sentiment. Traders will be closely watching any US economic data releases that could impact Federal Reserve policy expectations. Any indication of persistent inflation or a weakening labor market could further dampen risk appetite, while signs of economic resilience might offer a reprieve. The interplay between these macroeconomic drivers and Bitcoin's own technical landscape will determine its trajectory from current levels.
The Verdict: A Cautious Approach is Warranted
Given the conflicting signals and the prevailing risk-off environment, the most prudent approach for BTCUSD traders at the $66,445 level is one of extreme caution. The daily chart shows a neutral trend, but the 4-hour chart exhibits a strong bearish trend, and the 1-hour chart displays bearish momentum. The critical support at $65,280 is the linchpin for the bulls. A break below this level would likely confirm the bearish bias, potentially triggering significant downside.
Bulls need to see a convincing hold of the $65,280 support, followed by a reclaim and hold above the $66,445 resistance, ideally with increasing volume and bullish confirmation across timeframes. Until then, any rallies are likely to be met with selling pressure, especially as global markets remain skittish. The correlation with equities and the strengthening DXY are significant headwinds.
The bears, on the other hand, are looking for a decisive break below $65,280. If this occurs, targets would extend towards $64,924 and potentially $64,244. The strong bearish trend on the 4-hour chart and the bearish momentum on the 1-hour chart lend credence to this scenario, especially if the broader market continues its descent.
The current technical picture, with RSI values suggesting room for further decline and ADX indicating a strong trend on the 4-hour chart, favors a cautious outlook. The Stochastic Oscillator's oversold readings on shorter timeframes hint at potential short-term bounces, but these are unlikely to sustain without a broader shift in market sentiment or a clear technical breakout above key resistance. Therefore, waiting for clearer confirmation - either a strong hold of support or a decisive break of resistance - is the most sensible strategy.
The market sentiment analysis suggests that fear is currently outweighing greed. This typically leads to lower prices for risk assets. The recent news flow, emphasizing global risk aversion and pressure on crypto, supports this view. Consequently, while opportunities may arise from short-term bounces, the overall trend bias appears to be leaning bearish until key support levels are firmly defended or a significant shift in macro conditions occurs.
Ultimately, trading BTCUSD at these levels requires a disciplined approach. Risk management must be the top priority. Define your stop-losses, wait for clear setups, and do not chase the market. The $65,280 support level is the key level to watch. A break below it could signal the start of a more significant correction, while holding it could pave the way for a potential retest of higher prices, but this scenario appears less probable in the immediate short term given the current data.
Bearish Scenario: The Downside Path
65% ProbabilityNeutral Scenario: Sideways Consolidation
25% ProbabilityBullish Scenario: Reclaiming the Highs
10% ProbabilityFrequently Asked Questions: BTCUSD Analysis
What happens if BTCUSD breaks below the $65,280 support level?
A break below $65,280 on BTCUSD would likely trigger further downside, invalidating the bullish case. Bears would then target $64,924 and potentially $64,244 as the next support levels, fueled by increased selling pressure and stop-loss activations.
Should I buy BTCUSD at current levels of $66,445 given the RSI at 37.08?
Buying at $66,445 with the 1H RSI at 37.08 is a high-risk proposition. While it's not deeply oversold, the bearish trend on the 4-hour chart suggests caution. A more prudent approach would be to wait for a confirmed bounce off the $65,280 support or a decisive breakout above $66,445, with probabilities favoring downside risk currently.
Is the MACD signal on the 1H chart a buy signal for BTCUSD at $66,445?
The MACD showing positive momentum on the 1H chart is a conflicting signal against the bearish RSI and ADX readings. While it might suggest a short-term bounce possibility, it lacks confirmation from other indicators and the stronger bearish trend on the 4-hour chart. Traders should look for confluence before acting on this signal.
How will the global risk-off sentiment affect BTCUSD this week, with DXY at 99.91?
The strengthening DXY at 99.91 exacerbates the global risk-off sentiment, creating headwinds for BTCUSD. This correlation suggests that continued weakness in equities and a stronger dollar could pressure Bitcoin lower, potentially testing key support levels like $65,280 as investors flock to safer assets.
Track markets in real-time
AI-powered analysis, technical indicators and real-time price data.
Join Our Telegram Channel
Breaking market news, AI analysis and trading signals instantly.
Join Channel