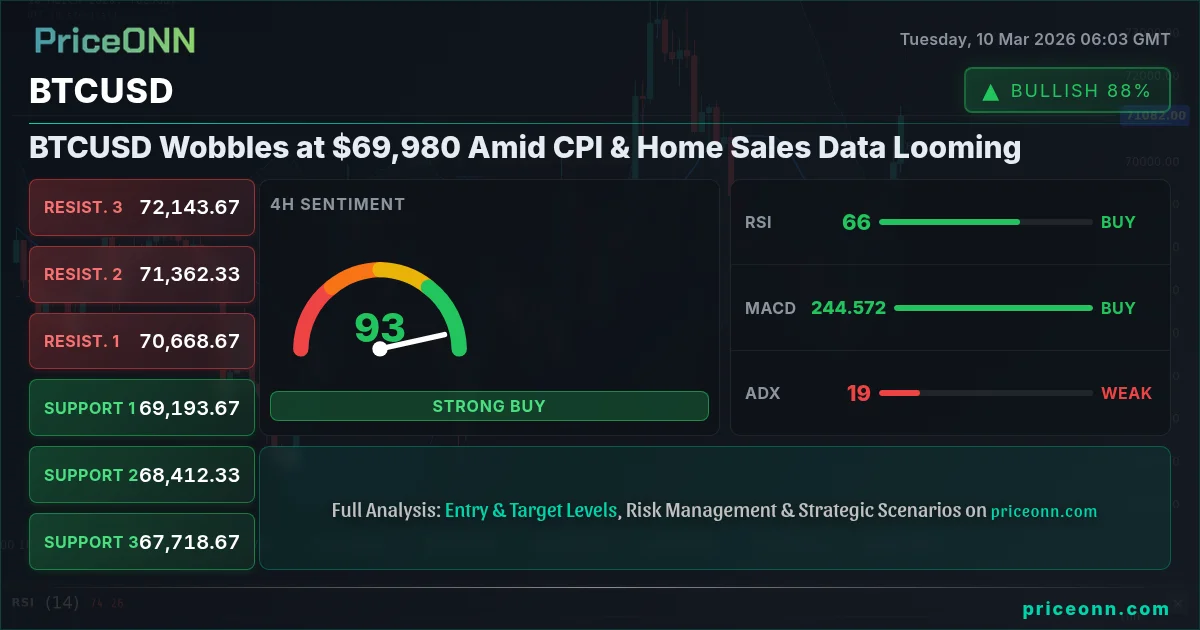
Bitcoin is currently trading around $69,980, finding itself at a critical juncture. The battle between bullish optimism and bearish caution is intensifying as traders brace for key economic data releases, specifically the upcoming CPI and home sales figures. The direction of BTCUSD hinges on how these releases will reshape market expectations for Federal Reserve policy.
- RSI at 62.56 suggests moderate bullish momentum but not yet overbought conditions
- Critical support lies at $69,625, tested multiple times in the last few hours
- MACD histogram shows positive momentum, yet a potential bearish divergence is forming
- Anticipated USD strength following CPI data could pressure BTCUSD
The Bull Case for Bitcoin at $69,980
The bullish narrative for Bitcoin centers around the idea that it is establishing itself as a legitimate asset class, attracting both institutional and retail investors. The recent approval of spot Bitcoin ETFs has opened the floodgates for new capital, providing sustained buying pressure. Moreover, with global inflation rates remaining elevated, Bitcoin is seen by some as a hedge against currency debasement, offering a store of value that is independent of traditional financial systems.
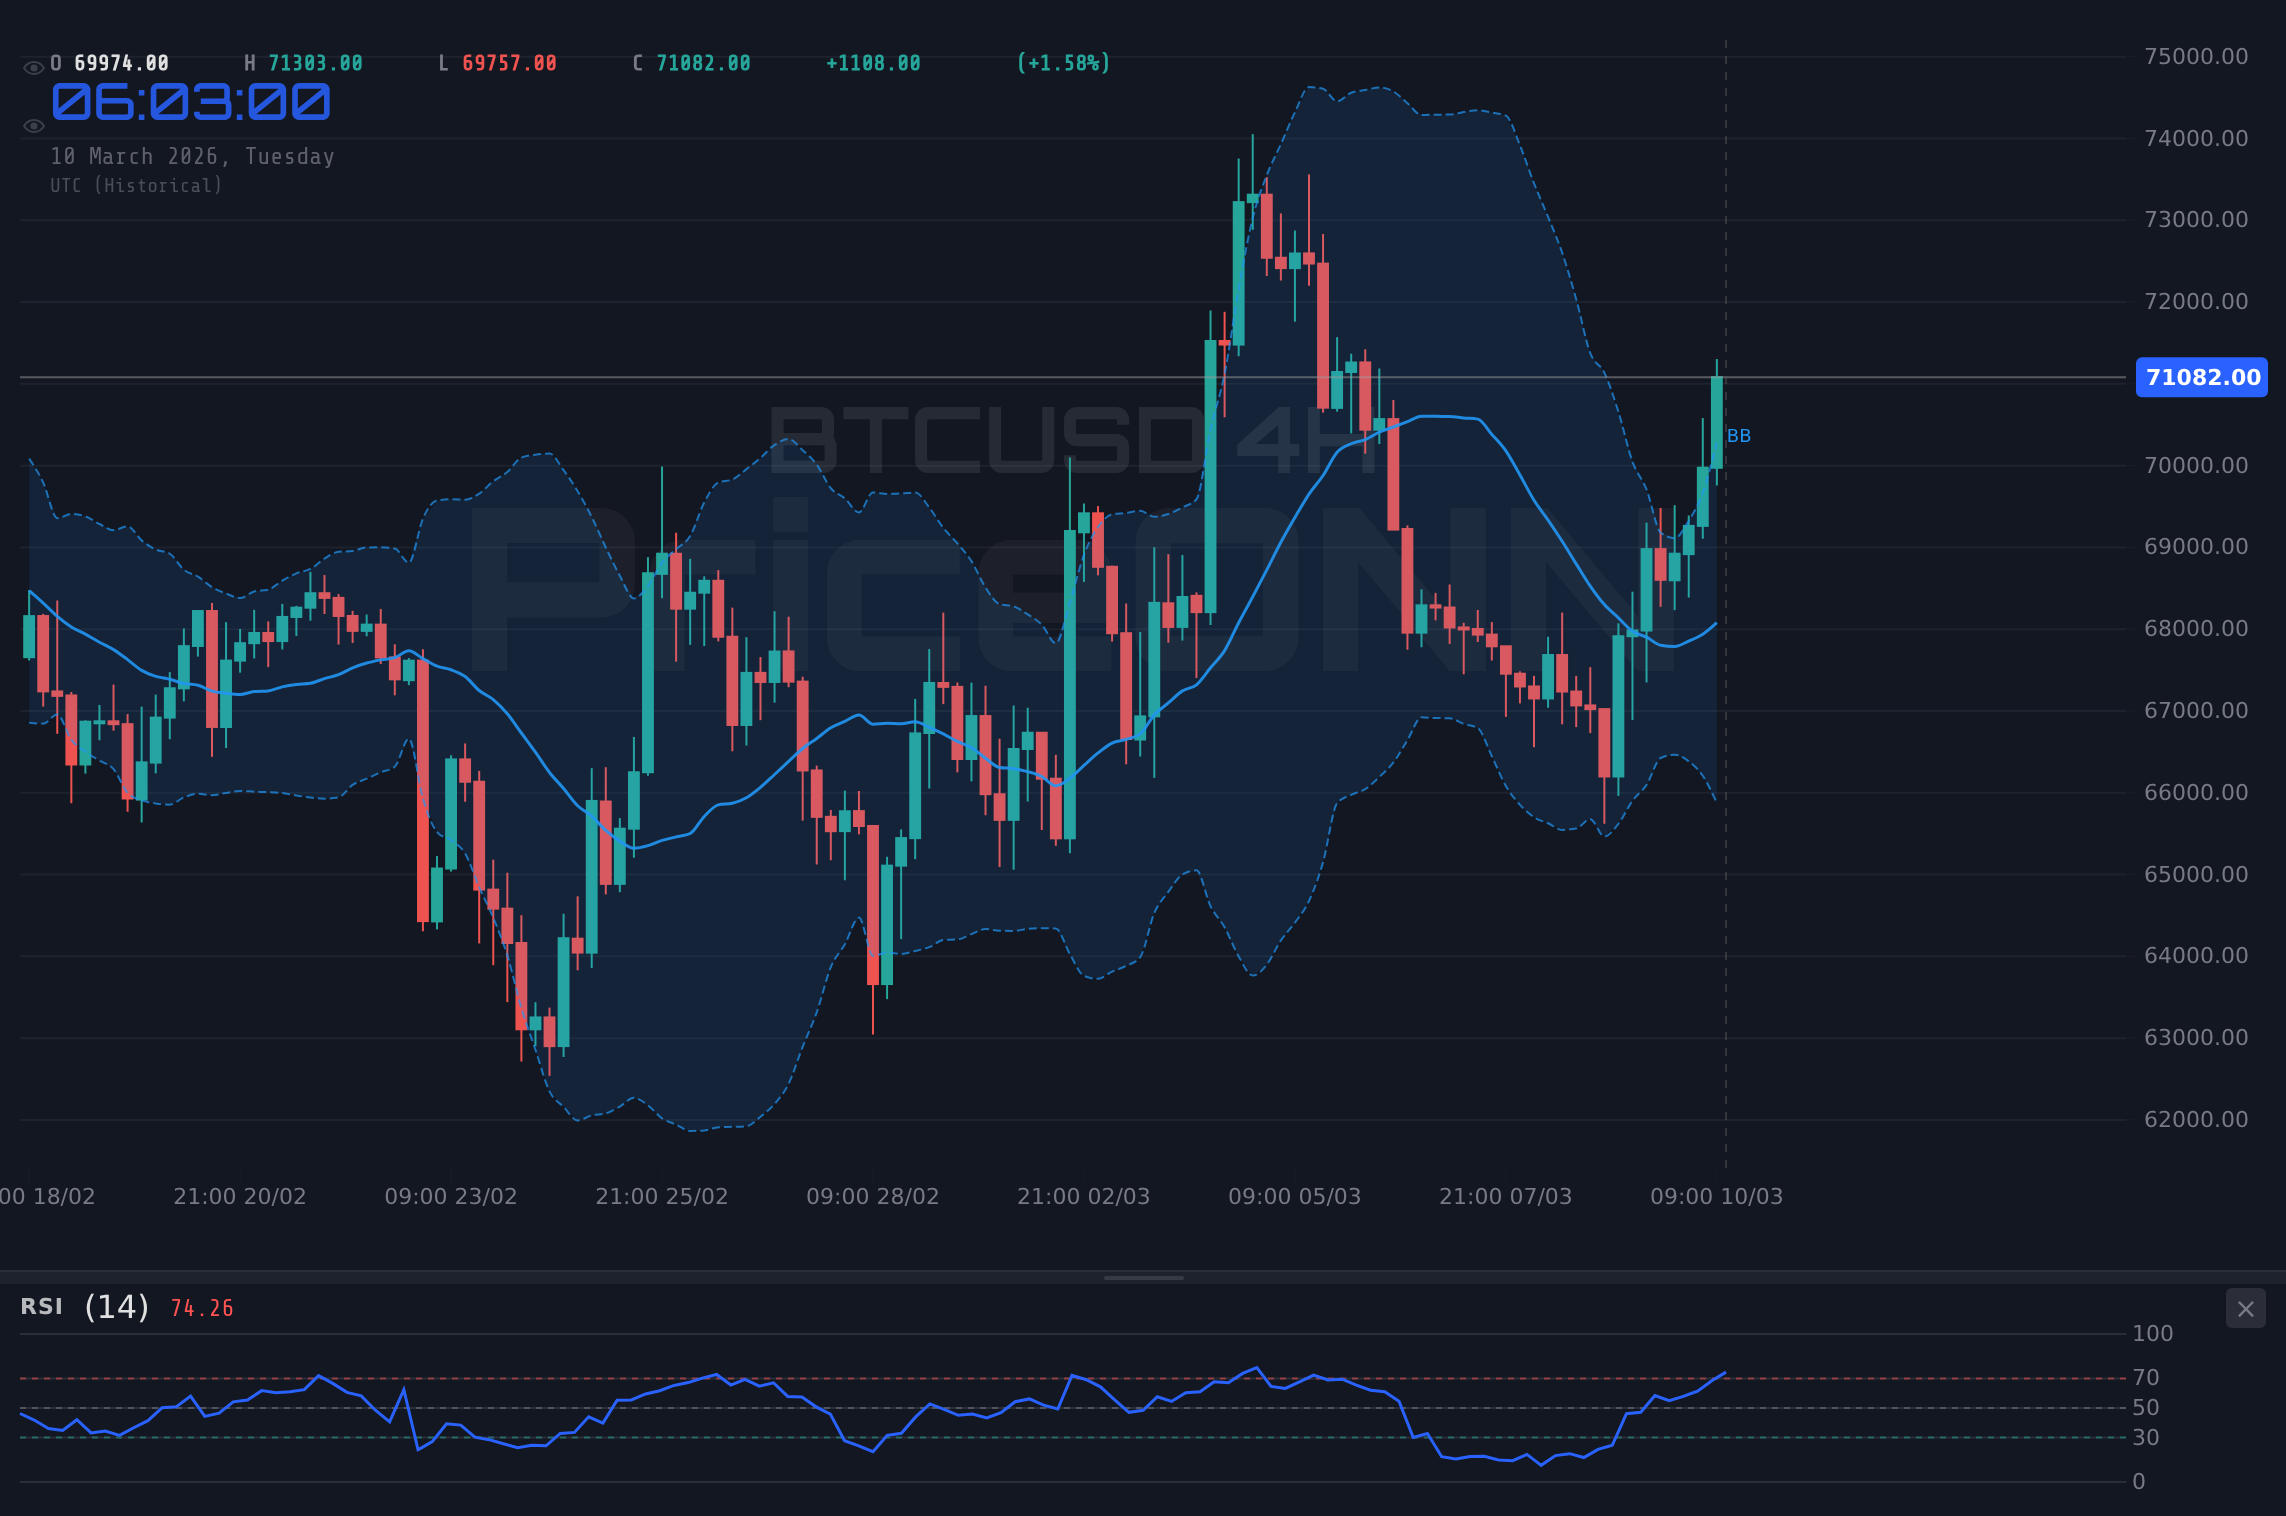
Technically, the 1-hour chart shows a strong uptrend with the price hovering above the middle Bollinger Band, indicating sustained bullish momentum. The RSI, currently at 62.56, suggests that there is room for further upside before reaching overbought territory. The MACD histogram is positive, confirming the prevailing bullish trend. The hourly stochastic oscillator, with K=65.82 and D=64, signals continued momentum. Moreover, the ADX stands at 37.49, further validating that it is a strong bullish trend that has been taking shape. The immediate resistance to watch is $70,320.67.
Adding to the bullish sentiment, the overall signal for the 1-hour time frame is a definitive 'AL' (Buy), supported by 8 out of 8 indicators. This is a strong indicator, especially when compared to the 4-hour and daily timeframes which present a more neutral picture. The positive momentum on the hourly chart has been strong.
The Bear Case for Bitcoin at $69,980
Conversely, the bearish argument hinges on the potential for tighter monetary policy from the Federal Reserve. If upcoming economic data, such as the CPI and home sales reports, indicate that inflation remains stubbornly high, the Fed may be forced to raise interest rates further or delay anticipated rate cuts. This would increase the opportunity cost of holding non-yielding assets like Bitcoin, potentially triggering a sell-off. Furthermore, regulatory scrutiny and geopolitical risks could also weigh on Bitcoin's price.
Looking at the daily chart, the overall signal is 'SAT' (Sell), with 3 out of 8 indicators suggesting a selling opportunity. The RSI on the daily chart is at 50.7, which is neutral, but the trend is bearish. The MACD is showing signs of waning bullish momentum. Moreover, the ADX is at 29.74, which indicates a strong downtrend. The immediate support to watch is $66,523.67.
The dollar index (DXY) currently sits at 98.57. If the upcoming economic data releases strengthen the dollar, BTCUSD will face significant pressure. The 4-hour chart shows a neutral trend, but the RSI and MACD are showing that there is weakening bullish momentum. A break below $69,625.67 could trigger a further decline towards $68,000, potentially triggering a stop hunt.
Technicals as a Tiebreaker
Given the conflicting fundamental narratives, technical analysis can provide valuable insights into the likely direction of BTCUSD. The multi-timeframe analysis reveals a mixed picture. While the 1-hour chart exhibits a strong uptrend, the 4-hour and daily charts present more neutral or bearish signals. This suggests that the short-term bullish momentum may be unsustainable, and a correction could be on the horizon.
Specifically, the ADX on the 4-hour chart is at 18.4, indicating a weak trend. The RSI is at 60.97, still in neutral territory, but showing that the bullish momentum is starting to slow. Moreover, the stochastic oscillator is showing overbought conditions with K=88.71 and D=82.46. This suggests that a near-term pullback is likely. If the price breaks below the hourly support at $69,625.67, the bears could gain control.
The 1-day technical chart shows more of a mixed picture. While the RSI is at 50.7, neutral, the MACD is showing that there is a bullish crossover. The ADX is at 29.74, indicating that it is a strong downtrend. The key level to watch is $66,523.67. A break below this could trigger a larger selloff.
The Verdict: Caution Ahead
Based on the current market data and technical analysis, a cautious approach is warranted for BTCUSD at $69,980. While the short-term bullish momentum is undeniable, the conflicting signals from the 4-hour and daily charts, coupled with the potential for tighter monetary policy, suggest that the upside may be limited. Traders should closely monitor the upcoming economic data releases and be prepared to adjust their positions accordingly. A break below the hourly support at $69,625.67 could signal the start of a bearish correction, while a sustained move above the hourly resistance at $70,320.67 would confirm the bullish trend.
Having tracked BTCUSD through multiple cycles, this current level is a point of indecision. Waiting for confirmation and managing risk will be key.
Frequently Asked Questions: BTCUSD Analysis
What happens if BTCUSD breaks above $70,320.67 resistance?
If BTCUSD decisively breaks above the immediate resistance at $70,320.67, it could trigger a continuation of the short-term bullish trend. This could lead to further gains toward the next resistance levels at $70,572.33 and $71,015.67 on the hourly chart.
Should I buy BTCUSD at current levels of $69,980 given the RSI at 62.56?
While the RSI at 62.56 indicates moderate bullish momentum, it is not yet in overbought territory. However, given the conflicting signals from the 4-hour and daily charts, it may be prudent to wait for a clearer confirmation of the bullish trend before initiating new long positions. A break above $70,320.67 would be a more compelling entry point.
Is the stochastic oscillator's overbought signal on the 4-hour chart a sell signal for BTCUSD?
The stochastic oscillator on the 4-hour chart, with K=88.71 and D=82.46, is indeed signaling overbought conditions. However, it is important to note that overbought signals can persist for extended periods during strong uptrends. It is advisable to look for additional confirmation, such as a break below the hourly support at $69,625.67, before considering a short position.
How will the upcoming CPI data affect BTCUSD this week?
The upcoming CPI data is a critical catalyst for BTCUSD. If the data indicates that inflation remains stubbornly high, the Federal Reserve may be forced to maintain a hawkish stance, which would likely strengthen the dollar and put downward pressure on BTCUSD. Conversely, if the data shows that inflation is cooling, it could weaken the dollar and provide a boost to BTCUSD.
Technical Outlook Summary
| Indicator | Value | Signal |
|---|---|---|
| RSI (14) | 62.56 | Neutral |
| MACD Histogram | Positive | Bullish |
| Stochastic | K=65.82, D=64 | Bullish |
| ADX | 37.49 | Strong Trend |
| Bollinger | Middle Band | Watch |
Key Levels
Support Levels
Resistance Levels
If BTCUSD breaks and holds above $70,320.67, expect a continuation towards $70,572.33 and potentially $71,015.67. This scenario is more likely if CPI data is weaker than expected, weakening the dollar.
A close below $69,625.67 could trigger a sell-off towards $69,182.33 and potentially $68,930.67. This scenario gains traction if upcoming economic data is stronger, strengthening the dollar.
Track markets in real-time
AI-powered analysis, technical indicators and real-time price data.
Join Our Telegram Channel
Breaking market news, AI analysis and trading signals instantly.
Join Channel