WTI Tumbles to $85.11: Is the Bull Run Over?
WTI crude oil plunges to $85.11 amid concerns about global demand and rising inventories. Is this the start of a deeper correction?
WTI's sharp decline is raising alarms for energy bulls. The commodity's tumble to $85.11 is raising questions about the sustainability of the recent rally, especially in light of renewed geopolitical tensions and fluctuating economic data.
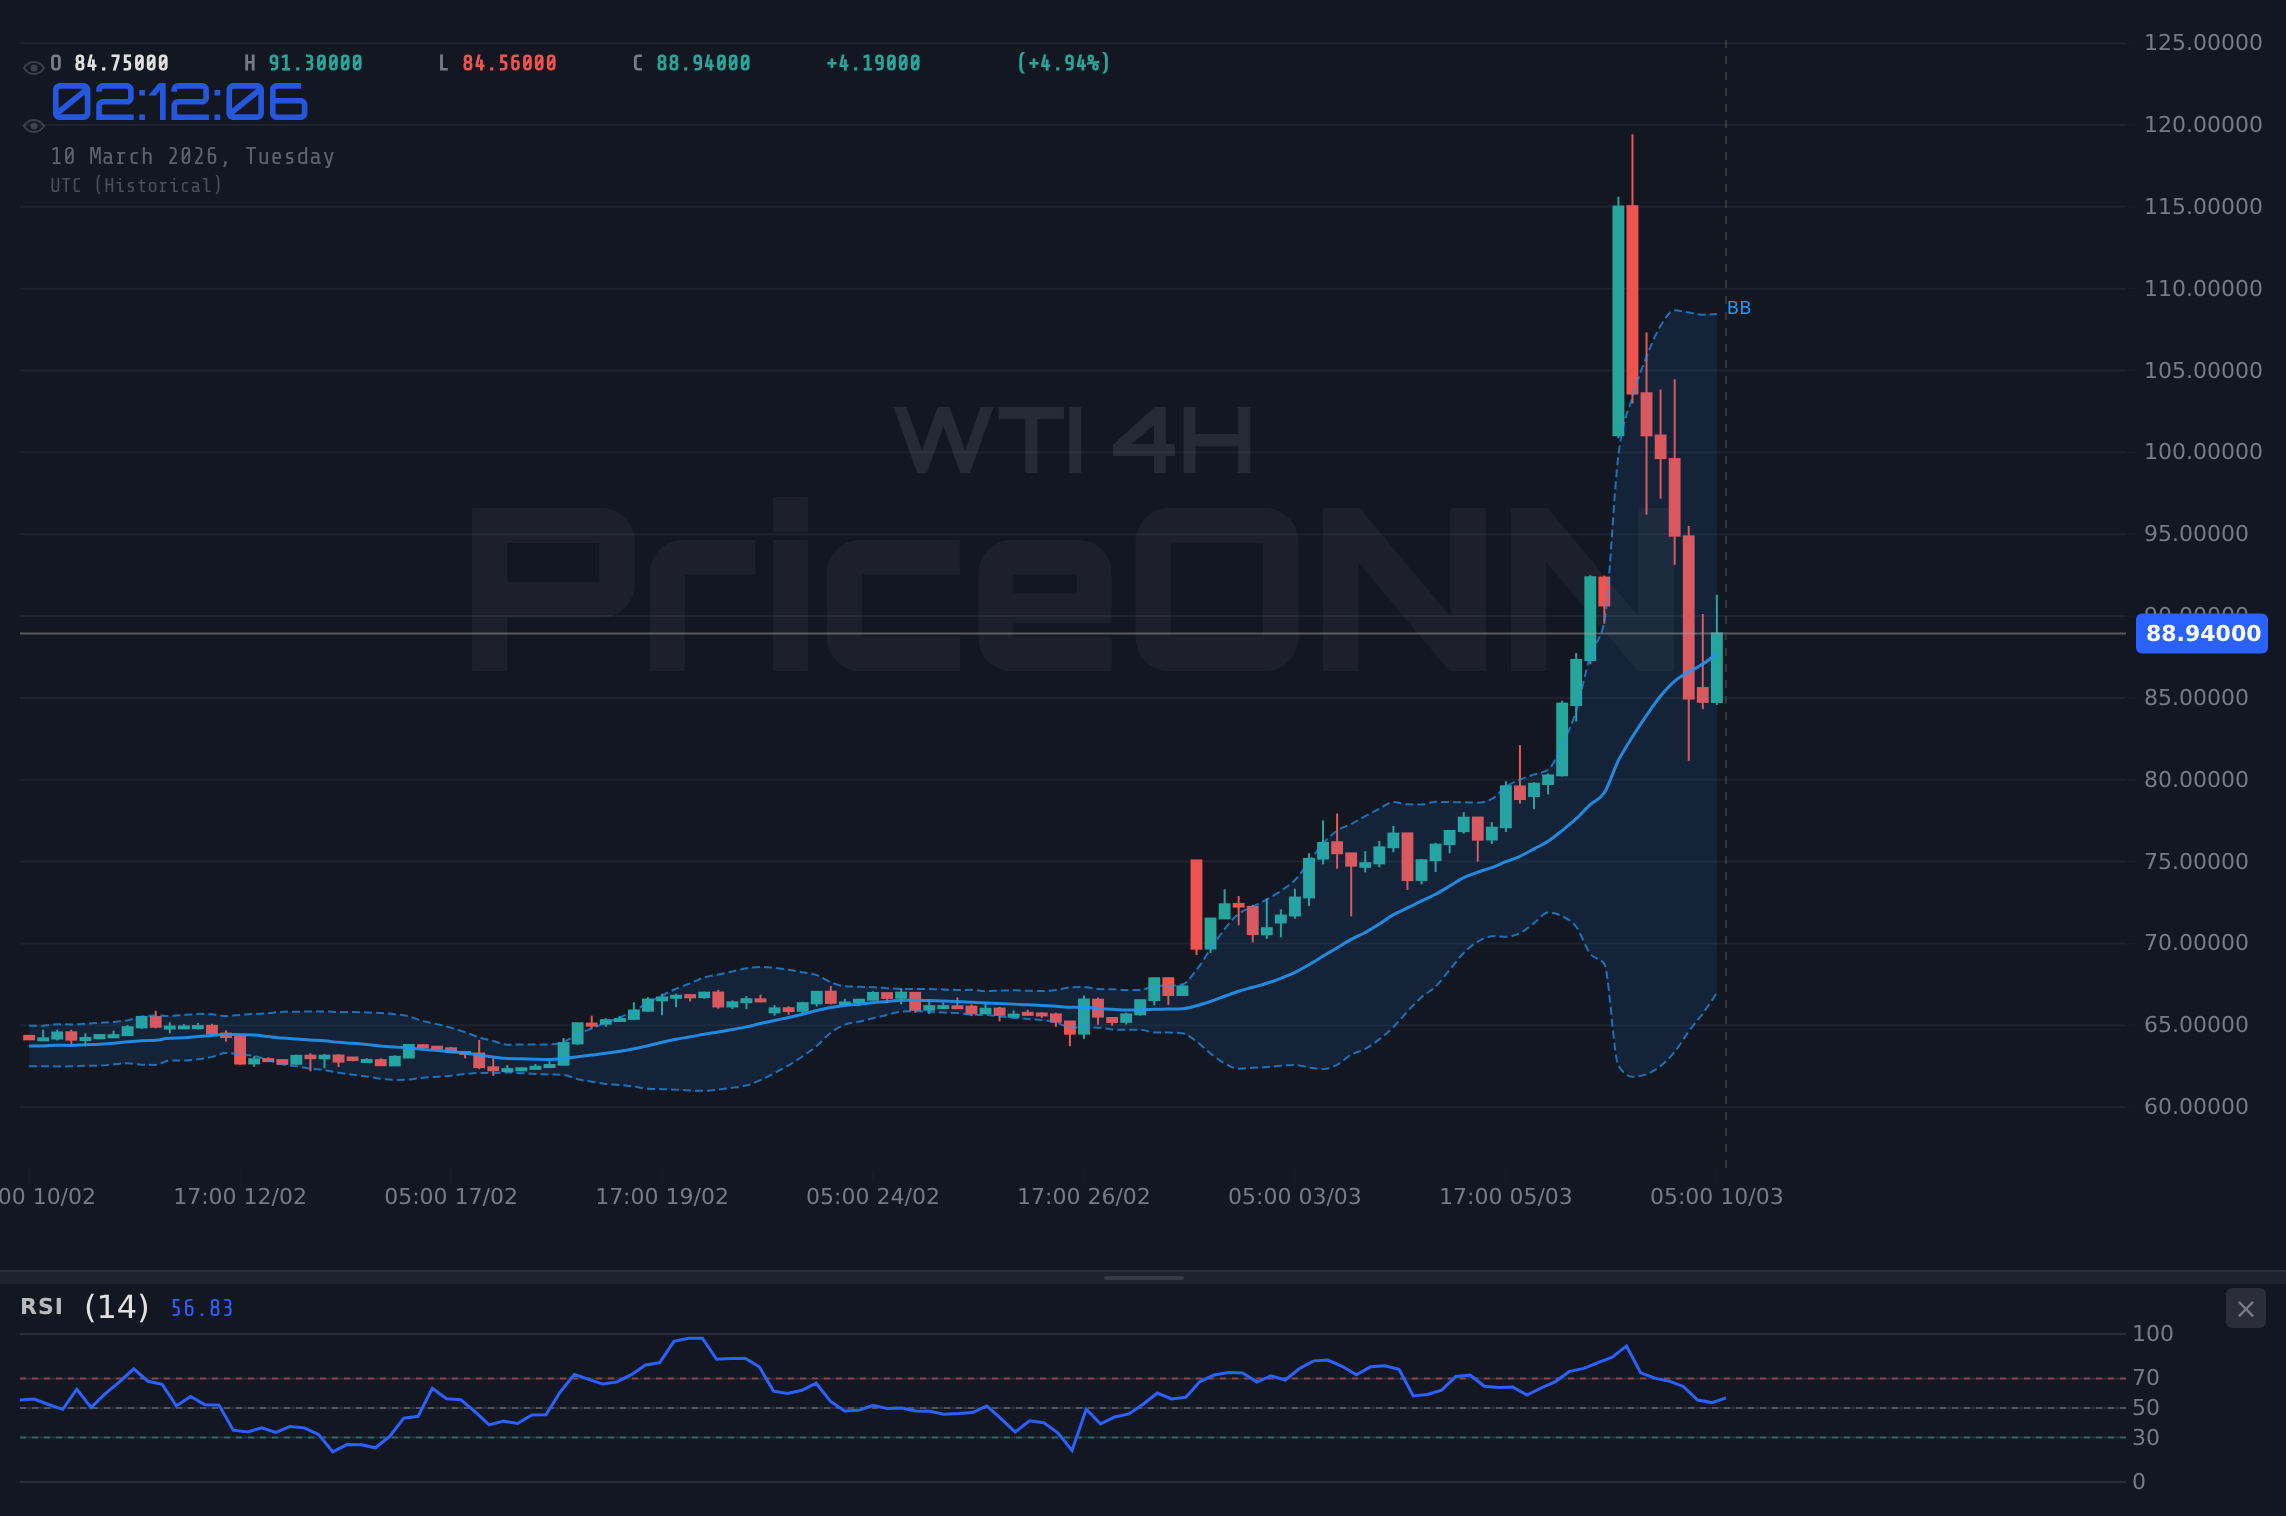
- WTI crude oil is currently trading at $85.11, marking a significant daily decline.
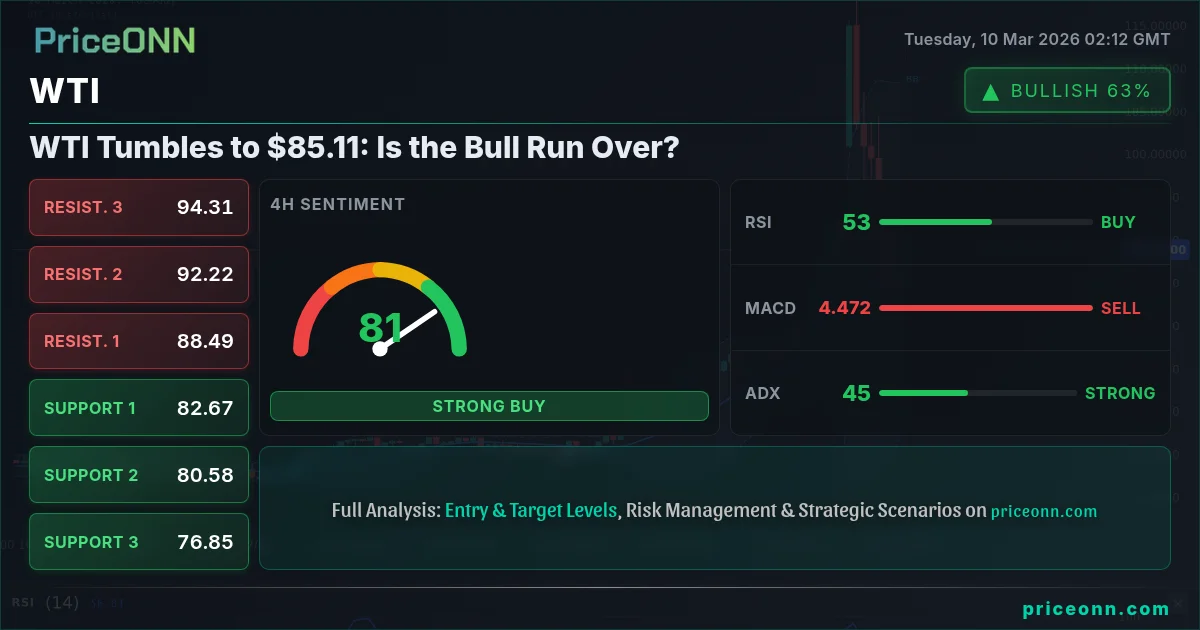
- RSI at 34.02 on the 1H chart suggests possible oversold conditions, but the overall trend remains downward.
- Key support levels lie at $84.80, $82.96, and $80.76, which could act as potential bounce zones.
- Despite the current downturn, the 1D chart shows a strong bullish trend, indicating a potential for a long-term recovery.
Recent geopolitical tensions, as highlighted by a recent article on Investing.com, had briefly pushed WTI above $120 per barrel. However, the rally proved short-lived. The current pullback seems to be fueled by a combination of factors, including profit-taking, concerns about global economic growth, and a strengthening US dollar. With the DXY currently at 98.6, any further dollar strength could put additional pressure on WTI.
Middle East Uncertainty and Market Impact
The ongoing conflict in the Middle East continues to be a major factor influencing oil prices. While initial fears of supply disruptions triggered a sharp rally, the market now appears to be reassessing the situation. Concerns about demand destruction, particularly from China, are weighing on sentiment. If economic data from China continues to disappoint, WTI could face further downside pressure.
"All Eyes Remain on the Conflict in the Middle East," reads a recent headline, reflecting the market's sensitivity to geopolitical developments. Any escalation of the conflict could quickly reverse the current downtrend and send prices soaring again. Traders need to closely monitor news headlines and be prepared for sudden shifts in market sentiment.
The USD/CAD pair is also worth watching, as noted in a recent report. A weaker WTI could weigh on the Canadian dollar, potentially leading to a rebound in USD/CAD. This correlation highlights the interconnectedness of the energy and forex markets.
WTI's Technical Breakdown
From a technical perspective, WTI's break below key support levels is a bearish signal. The 1-hour chart indicates a neutral trend, but the RSI at 34.02 suggests the commodity might be approaching oversold conditions. However, traders should be cautious about calling a bottom just yet. The ADX on the 1H chart is at 36.69, indicating a strong downtrend, suggesting that the bearish momentum remains strong. This could lead to further declines before any meaningful recovery.
Looking at the 4-hour chart, the trend is still bullish, but the RSI at 49.34 indicates that the buying pressure is waning. The Stochastic indicator shows K=19.26 and D=51.78, signaling a potential oversold condition, but the overall picture remains bearish. Key support levels to watch on this timeframe are $84.80, $82.96, and $80.76.
The daily chart paints a slightly different picture. While the trend is still bullish, the RSI at 74.3 is in overbought territory, suggesting that a correction is overdue. The MACD is positive, but the Stochastic indicator shows K=71.37 and D=78.64, signaling a potential downturn. The ADX is at 40.81, indicating a strong uptrend, but the overbought RSI suggests that the rally may be losing steam.
Economic Calendar and Central Bank Watch
The economic calendar is relatively light this week, but several key data releases could impact WTI prices. On Wednesday, the market will be watching the latest numbers. Any surprises in these reports could trigger volatility in the oil market.
Furthermore, traders should keep an eye on central bank policies. The Fed's upcoming meeting will be closely watched for any hints about future interest rate hikes. A hawkish Fed could strengthen the dollar and put further pressure on WTI. As Reuters has reported, Fed officials are concerned about 'sticky' inflation, which could lead to more aggressive monetary policy tightening.
Potential Scenarios for WTI
Given the current technical and fundamental backdrop, several scenarios are possible for WTI. A bullish scenario would involve a stabilization of global economic growth, a resolution of geopolitical tensions, and a dovish Fed. In this case, WTI could rebound towards the $90 level. However, this scenario appears less likely at the moment.
A more bearish scenario would involve a further deterioration of global economic growth, an escalation of geopolitical tensions, and a hawkish Fed. In this case, WTI could decline towards the $80 level, or even lower. This scenario appears more probable, given the current market conditions.
The Big Picture
WTI's recent tumble to $85.11 is a warning sign for energy bulls. The commodity faces several headwinds, including concerns about global economic growth, a strengthening US dollar, and a potentially hawkish Fed. While geopolitical tensions could provide some support, the overall picture appears bearish. Traders should closely monitor economic data, central bank policies, and news headlines to make informed trading decisions.
The ADX on the daily chart is at 28.64, confirming a strong uptrend. However, the RSI and Stochastic indicators suggest that the market is overbought and due for a correction. This conflicting signal highlights the need for caution. Traders should wait for confirmation before entering any new positions.
The recent drop in gold prices, as noted in a recent article, further underscores the shift in market sentiment. As gold falls below $5,100, investors appear to be moving away from safe-haven assets and towards riskier investments. This trend could further weigh on WTI prices.
CAD/JPY is also an important pair to watch, as the strength of the Canadian dollar is often linked to oil prices. With the Bank of Canada and the Bank of Japan taking different policy paths, this pair could offer interesting trading opportunities. However, traders should be mindful of the potential for sudden shifts in market sentiment.
The recent volatility in fuel prices in Turkey also highlights the sensitivity of energy markets to global events. As consumers face rising costs, governments may come under pressure to intervene, potentially impacting oil demand.
Technical Outlook Summary
| Indicator | Value | Signal |
|---|---|---|
| RSI (14) | 34.02 | Neutral |
| MACD Histogram | Negative | Bearish |
| Stochastic | 28.26/24.65 | Oversold |
| ADX | 36.69 | Strong Downtrend |
| Bollinger | Middle Band | Watch |
Frequently Asked Questions: WTI Analysis
Is WTI a good buy right now?
Given the current bearish momentum and overbought conditions on the daily chart, WTI is not a strong buy right now. Traders should wait for a clear bottom to form before entering any new long positions. Watch for a break above $88.84 to signal a potential trend reversal.
What is the WTI price forecast for this week?
The WTI price forecast for this week is bearish, with a potential decline towards the $80 level. However, a stabilization of global economic growth and a dovish Fed could provide some support. The probability of a significant rally is low, given the current market conditions.
What are the key support and resistance levels for WTI?
Key support levels for WTI are $84.80, $82.96, and $80.76. Key resistance levels are $88.84, $91.04, and $92.88. A break below $80.76 would signal a deeper correction, while a break above $92.88 would indicate a potential trend reversal.
Why is WTI moving today?
WTI is moving lower today due to concerns about global economic growth, a strengthening US dollar, and profit-taking after the recent rally. Geopolitical tensions are also playing a role, but the overall sentiment appears bearish.
Track markets in real-time
AI-powered analysis, technical indicators and real-time price data.
Join Our Telegram Channel
Breaking market news, AI analysis and trading signals instantly.
Join Channel