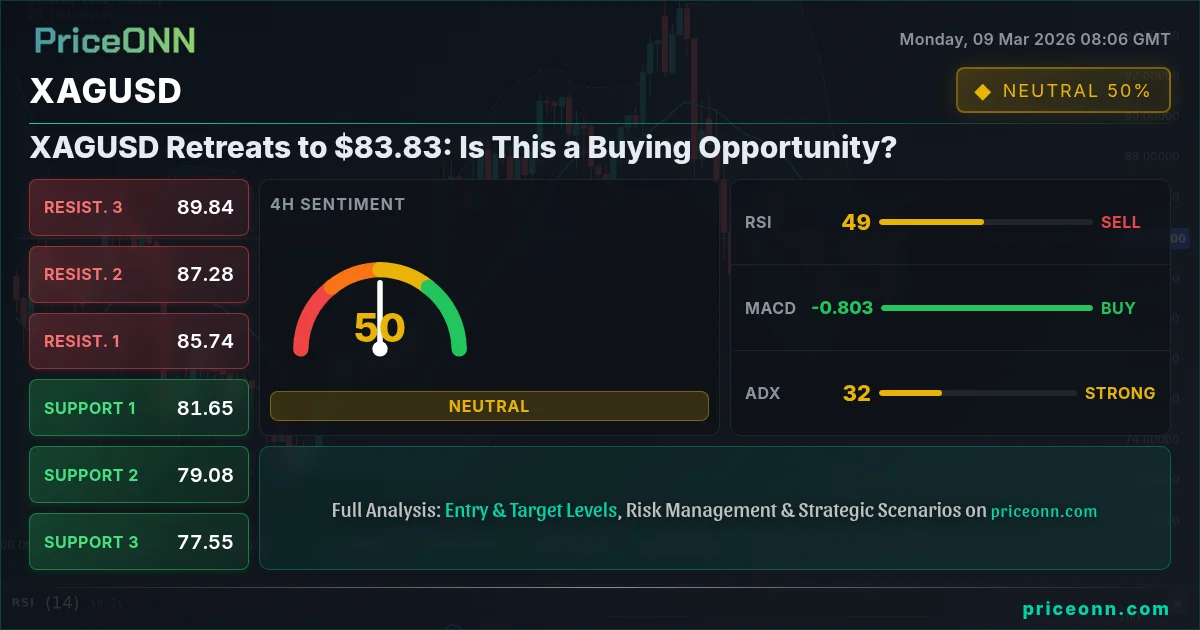
Silver (XAGUSD) is currently trading at $83.83, facing downward pressure amid a strengthening dollar and mixed signals from technical indicators. After a volatile run, the market awaits key retail data that could dictate the next significant move.
- RSI at 49.3 on the daily chart suggests neutral momentum, but leaning bearish.
- Key support level to watch sits at $82.32, a break below could trigger further declines.
- Stochastic oscillator signals bearish crossover on the daily timeframe, indicating potential for continued selling pressure.
- Dollar strength, as reflected in the DXY at 99, is acting as a headwind for silver prices.
Having tracked XAGUSD through various market cycles, the current pullback to $83.83 presents a crucial juncture. The direction silver takes from here will likely depend on a confluence of factors, including upcoming economic data, dollar movements, and overall risk sentiment. The forexprostr gümüş data points to continued interest in silver, underscoring the need to monitor both technical and fundamental drivers.
The 1-hour chart shows a neutral trend, with the RSI hovering around 53.62. This indicates neither strong buying nor selling pressure in the immediate term. A break above the immediate resistance at $84.55 could signal a short-term bullish move, while a drop below support at $83.30 could trigger further declines. The ADX at 16.98 suggests a weak trend, indicating that any breakout may lack sustained momentum. The Stochastic oscillator on the 1H chart shows a bullish signal with %K at 80.38 and %D at 60.35, suggesting a possible short-term upward move. However, traders should be cautious, considering the overall mixed signals.
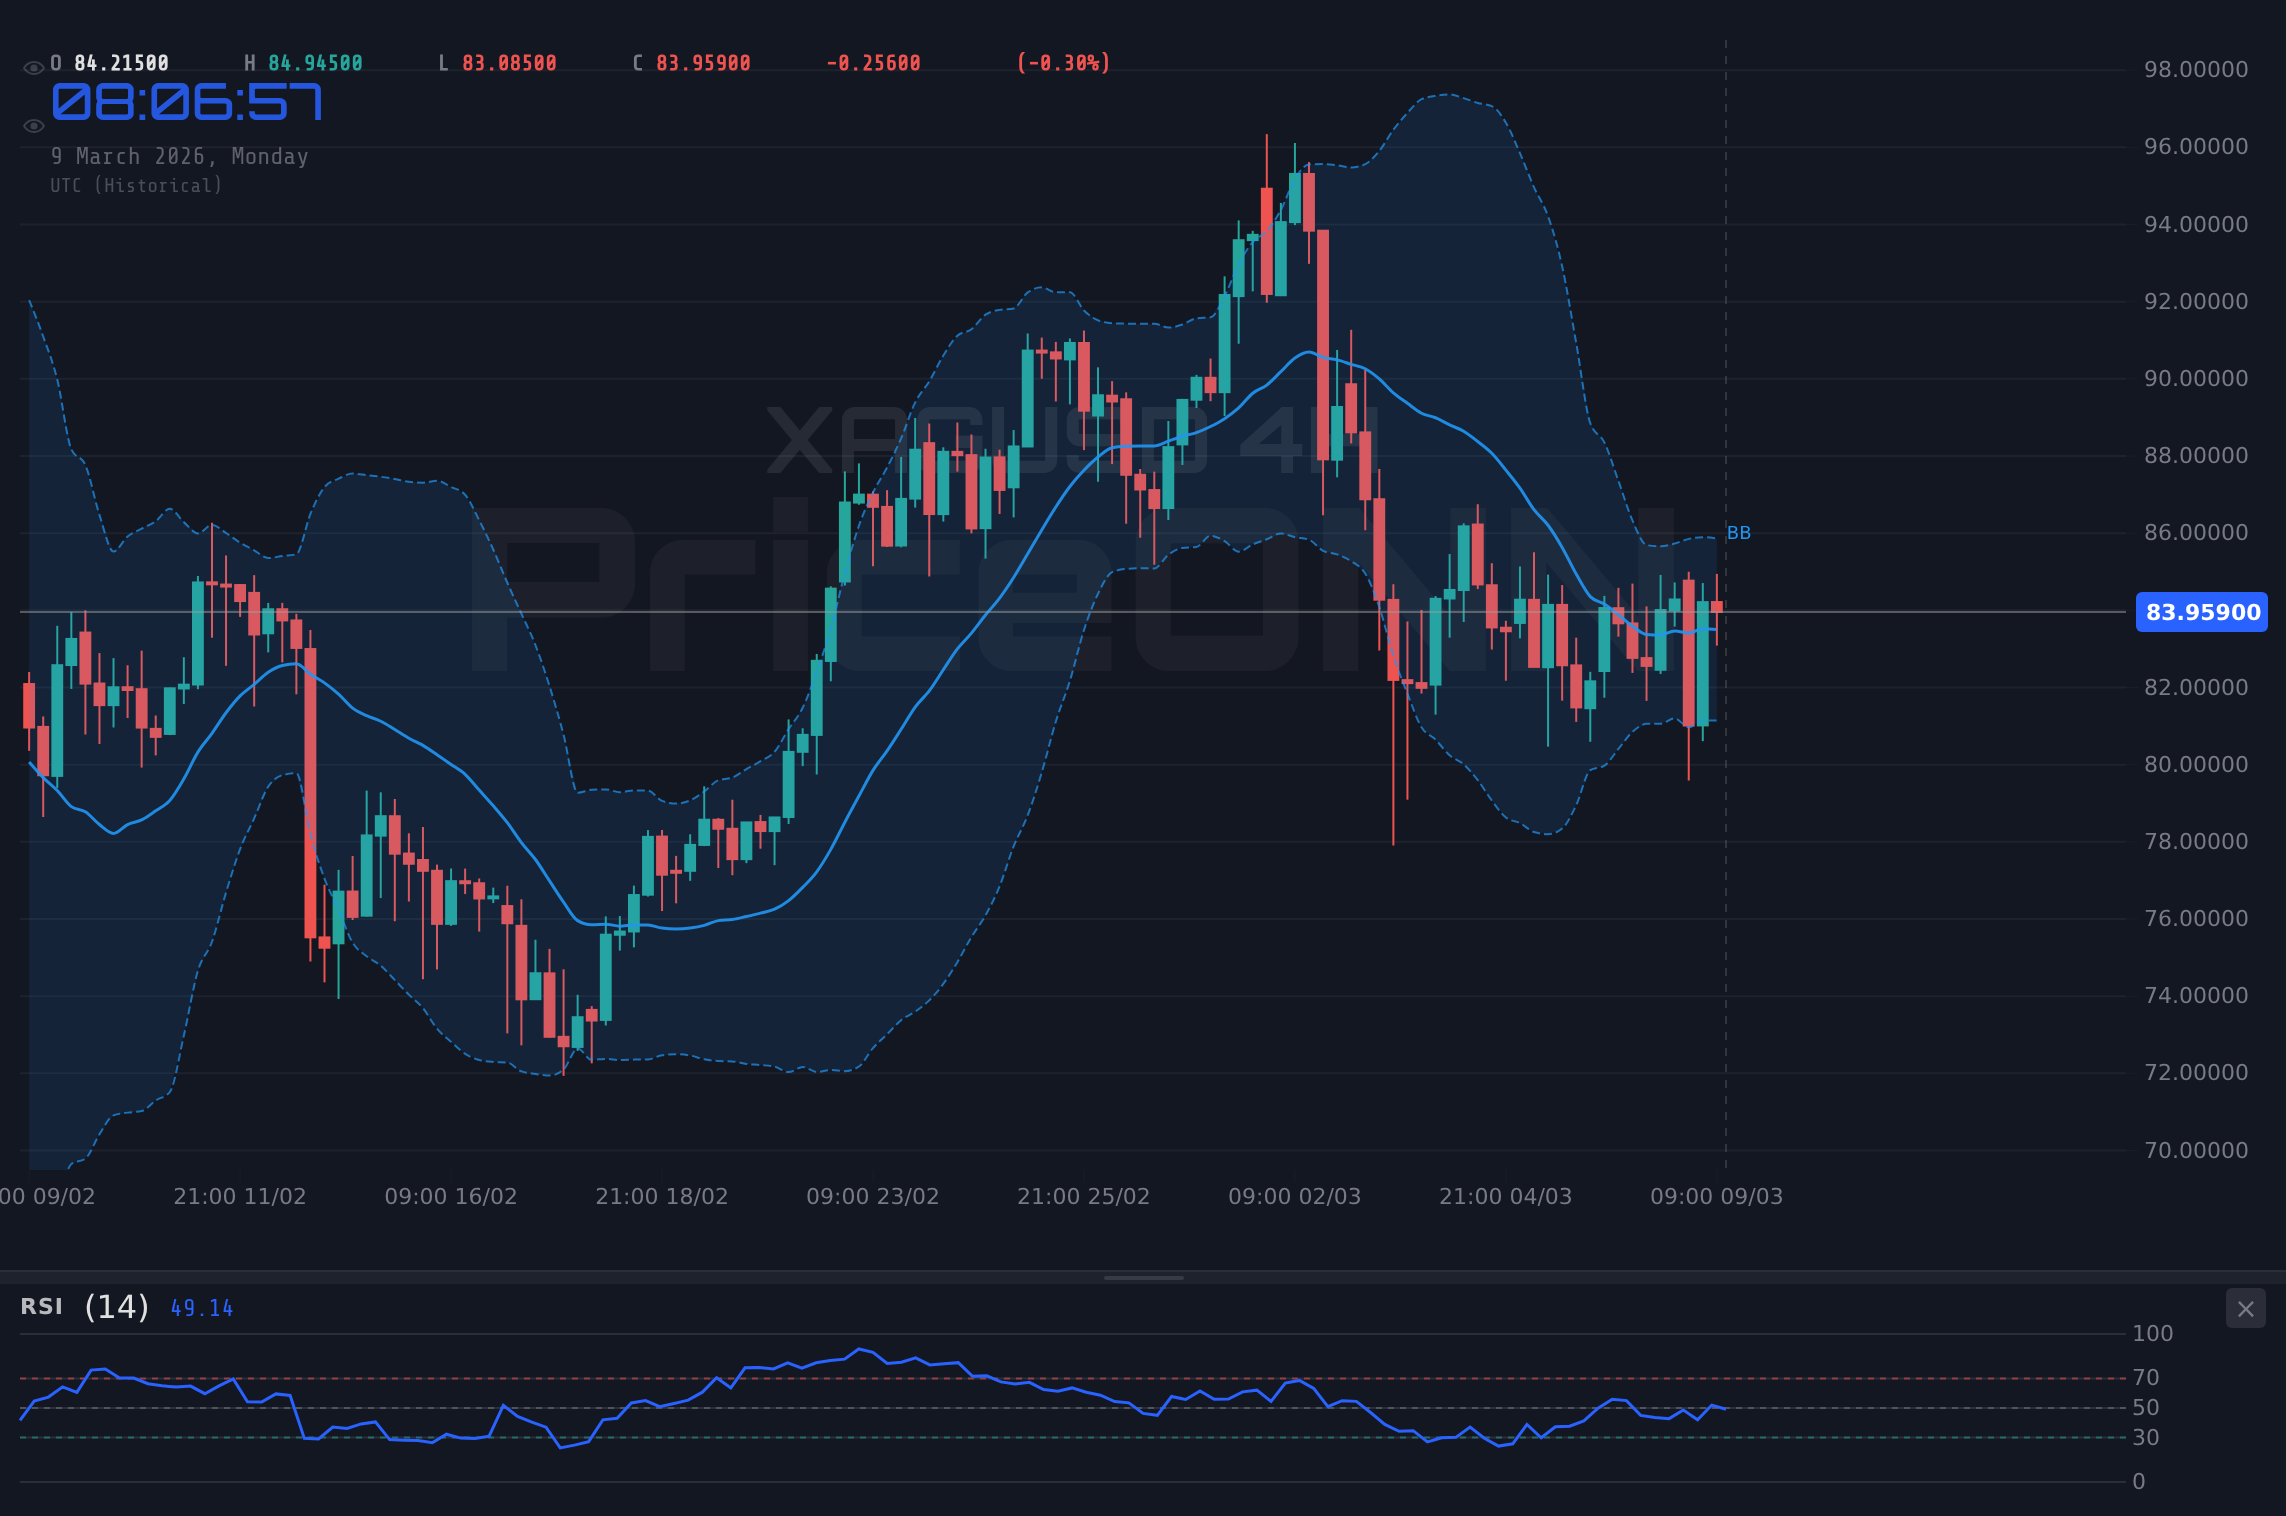
Stepping back to the 4-hour timeframe, a more bearish picture emerges. The RSI sits at 48.69, indicating a slight bearish bias. The ADX at 31.03 points to a stronger downtrend, suggesting that the recent pullback might be more than just a temporary correction. Key resistance on this timeframe lies at $84.15, while support can be found at $78.74. A decisive break of either of these levels could dictate the medium-term trend for XAGUSD. The MACD shows positive momentum, but the overall signal is neutral, suggesting that the market is still undecided.
The daily chart offers a broader perspective, revealing a bearish trend with an ADX of 17.46. The RSI at 49.3 reinforces the neutral-to-bearish sentiment. The key levels to watch on this timeframe are resistance at $85.58 and support at $82.32. A breakdown below this support could open the door for a test of lower levels, potentially around $80.35. The Stochastic oscillator shows a bearish signal (%K at 29.93 and %D at 46.86), suggesting that the downward pressure may persist. This aligns with current silver price XAG/USD trends being closely watched by investors.
The strength of the dollar, as measured by the DXY, is playing a significant role in the current weakness in silver. The DXY is currently at 99, with a daily change of 0.43%, indicating a strengthening dollar. Historically, a stronger dollar tends to put downward pressure on precious metals like silver, as they become more expensive for buyers using other currencies. With the DXY at 99, XAGUSD is under pressure, and traders should closely monitor the dollar's movements for clues about silver's next move.
Looking at other market correlations, the SP500 is down 1.43% today, reflecting a risk-off sentiment in the market. This could potentially provide some safe-haven demand for silver, but the stronger dollar is currently outweighing this effect. Traders should also keep an eye on oil prices, as rising oil prices can contribute to inflationary pressures, which could, in turn, support silver as an inflation hedge. However, the oil crisis and Canadian unemployment rate, as highlighted by recent news, add to the overall uncertainty and could influence investor behavior.
The latest jobs report reveals a significant slowdown in the US labor market, which could influence the Federal Reserve's rate policy. According to Reuters, Fed officials are closely monitoring inflation. This adds another layer of complexity to the outlook for silver, as changes in interest rate expectations can significantly impact the dollar and, consequently, silver prices. The upcoming US data on Tuesday is a key event to watch. Furthermore, EUR data on Wednesday adds to the global economic calendar to monitor.
Silver's industrial demand, particularly in comparison to gold, is another factor to consider. While gold's demand is primarily driven by investment and central bank purchases, silver has significant industrial applications, especially in electronics and solar panels. The industrial demand silver vs gold percentage is a key metric to watch, as it can provide insights into the overall demand for silver beyond its role as a safe-haven asset. The current silver price XAG USD reflects this balance between investment and industrial demand.
Frequently Asked Questions: XAGUSD Analysis
Is XAGUSD a good buy right now?
Given the current pullback to $83.83 and mixed technical signals, XAGUSD is not a clear buy at this moment. A more decisive move above resistance at $84.55 or a drop below support at $82.32 would provide better confirmation.
What is the XAGUSD price forecast for this week?
The XAGUSD price forecast for this week depends heavily on the upcoming retail data. A stronger-than-expected report could push the dollar higher and silver lower, potentially testing support at $82.32. Conversely, a weaker report could lead to a rebound towards resistance at $85.58.
What are the key support and resistance levels for XAGUSD?
Key support levels for XAGUSD are currently at $82.32, $80.35, and $78.74. Resistance levels to watch are $84.55, $85.58, and $87.28, all based on current market data.
Why is XAGUSD moving today?
XAGUSD is moving lower today primarily due to a strengthening dollar, as indicated by the DXY rising to 99. Risk-off sentiment in the broader market, as reflected in the SP500's decline, is also contributing to the downward pressure.
The technical picture for XAGUSD remains mixed, but the stronger dollar and bearish signals on the daily chart suggest caution. Traders should closely monitor the upcoming economic data and key support and resistance levels before making any decisions. Having watched XAGUSD through numerous market cycles, patience looks like it will be rewarded here. Manage your risk, wait for your setup-the market always gives a second chance.
Technical Outlook Summary
| Indicator | Value | Signal |
|---|---|---|
| RSI (14) | 49.3 | Neutral |
| MACD Histogram | Positive | Bullish |
| Stochastic | 29.93/46.86 | Bearish |
| ADX | 17.46 | Weak Trend |
| Bollinger | Upper Band | Watch |
Key Levels
Support Levels
Resistance Levels
Track markets in real-time
AI-powered analysis, technical indicators and real-time price data.
Join Our Telegram Channel
Breaking market news, AI analysis and trading signals instantly.
Join Channel