WTI Faces Resistance at $88.48 as RSI Signals Overbought Conditions
WTI crude oil is currently trading at $88.48, with the RSI flashing an overbought signal. Will geopolitical tensions sustain the rally or will a pullback occur?
WTI's recent surge has caught the eye of many traders, with the price currently hovering around $88.48. However, a closer look reveals that the Relative Strength Index (RSI) is signaling overbought conditions, prompting the question: can this rally last, or is a pullback imminent? This analysis delves into the technical and fundamental factors influencing WTI's price action, offering insights for traders navigating these volatile times.
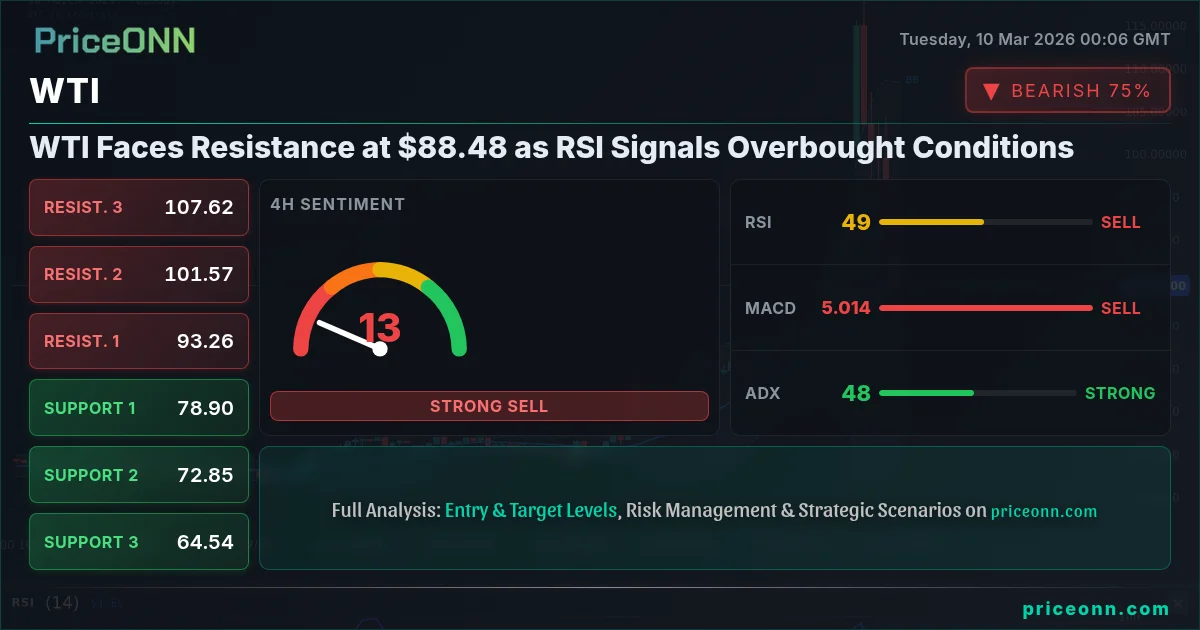
- RSI at 71.16 on the 1H chart indicates potential overbought conditions, suggesting a possible pullback.
- Key resistance level at $90.14 on the 1H chart needs to be broken to sustain the bullish momentum.
- ADX at 35.55 on the 1H chart suggests a strong downtrend, potentially counteracting the bullish RSI signal.
- Geopolitical tensions in the Middle East remain a primary driver of WTI's price volatility.
Geopolitical Tensions and Supply Concerns
The recent volatility in WTI crude oil prices can largely be attributed to escalating geopolitical tensions in the Middle East. As reported by Reuters, the conflict has raised concerns about potential disruptions to oil supply, pushing prices higher. The market is closely monitoring developments in the region, with any further escalation likely to exacerbate supply concerns and drive prices even higher. However, a resolution to the conflict could ease these concerns and lead to a sharp correction in oil prices. Keep in mind that WTI exhibits high positive correlation to the CAD/JPY as well.
Analyzing WTI's Price Action: Technical Indicators in Focus
A comprehensive technical analysis provides a mixed picture for WTI. On the 1-hour timeframe, the RSI is at 71.16, signaling overbought conditions. This suggests that the recent rally may be losing steam, and a pullback could be on the horizon. However, the MACD indicator shows positive momentum, indicating that the bullish trend is still intact. The stochastic oscillator, with K=90.49 and D=81.87, also points to overbought conditions, reinforcing the potential for a correction. Now, this is where it gets interesting!
Multi-Timeframe Analysis: Contradictory Signals
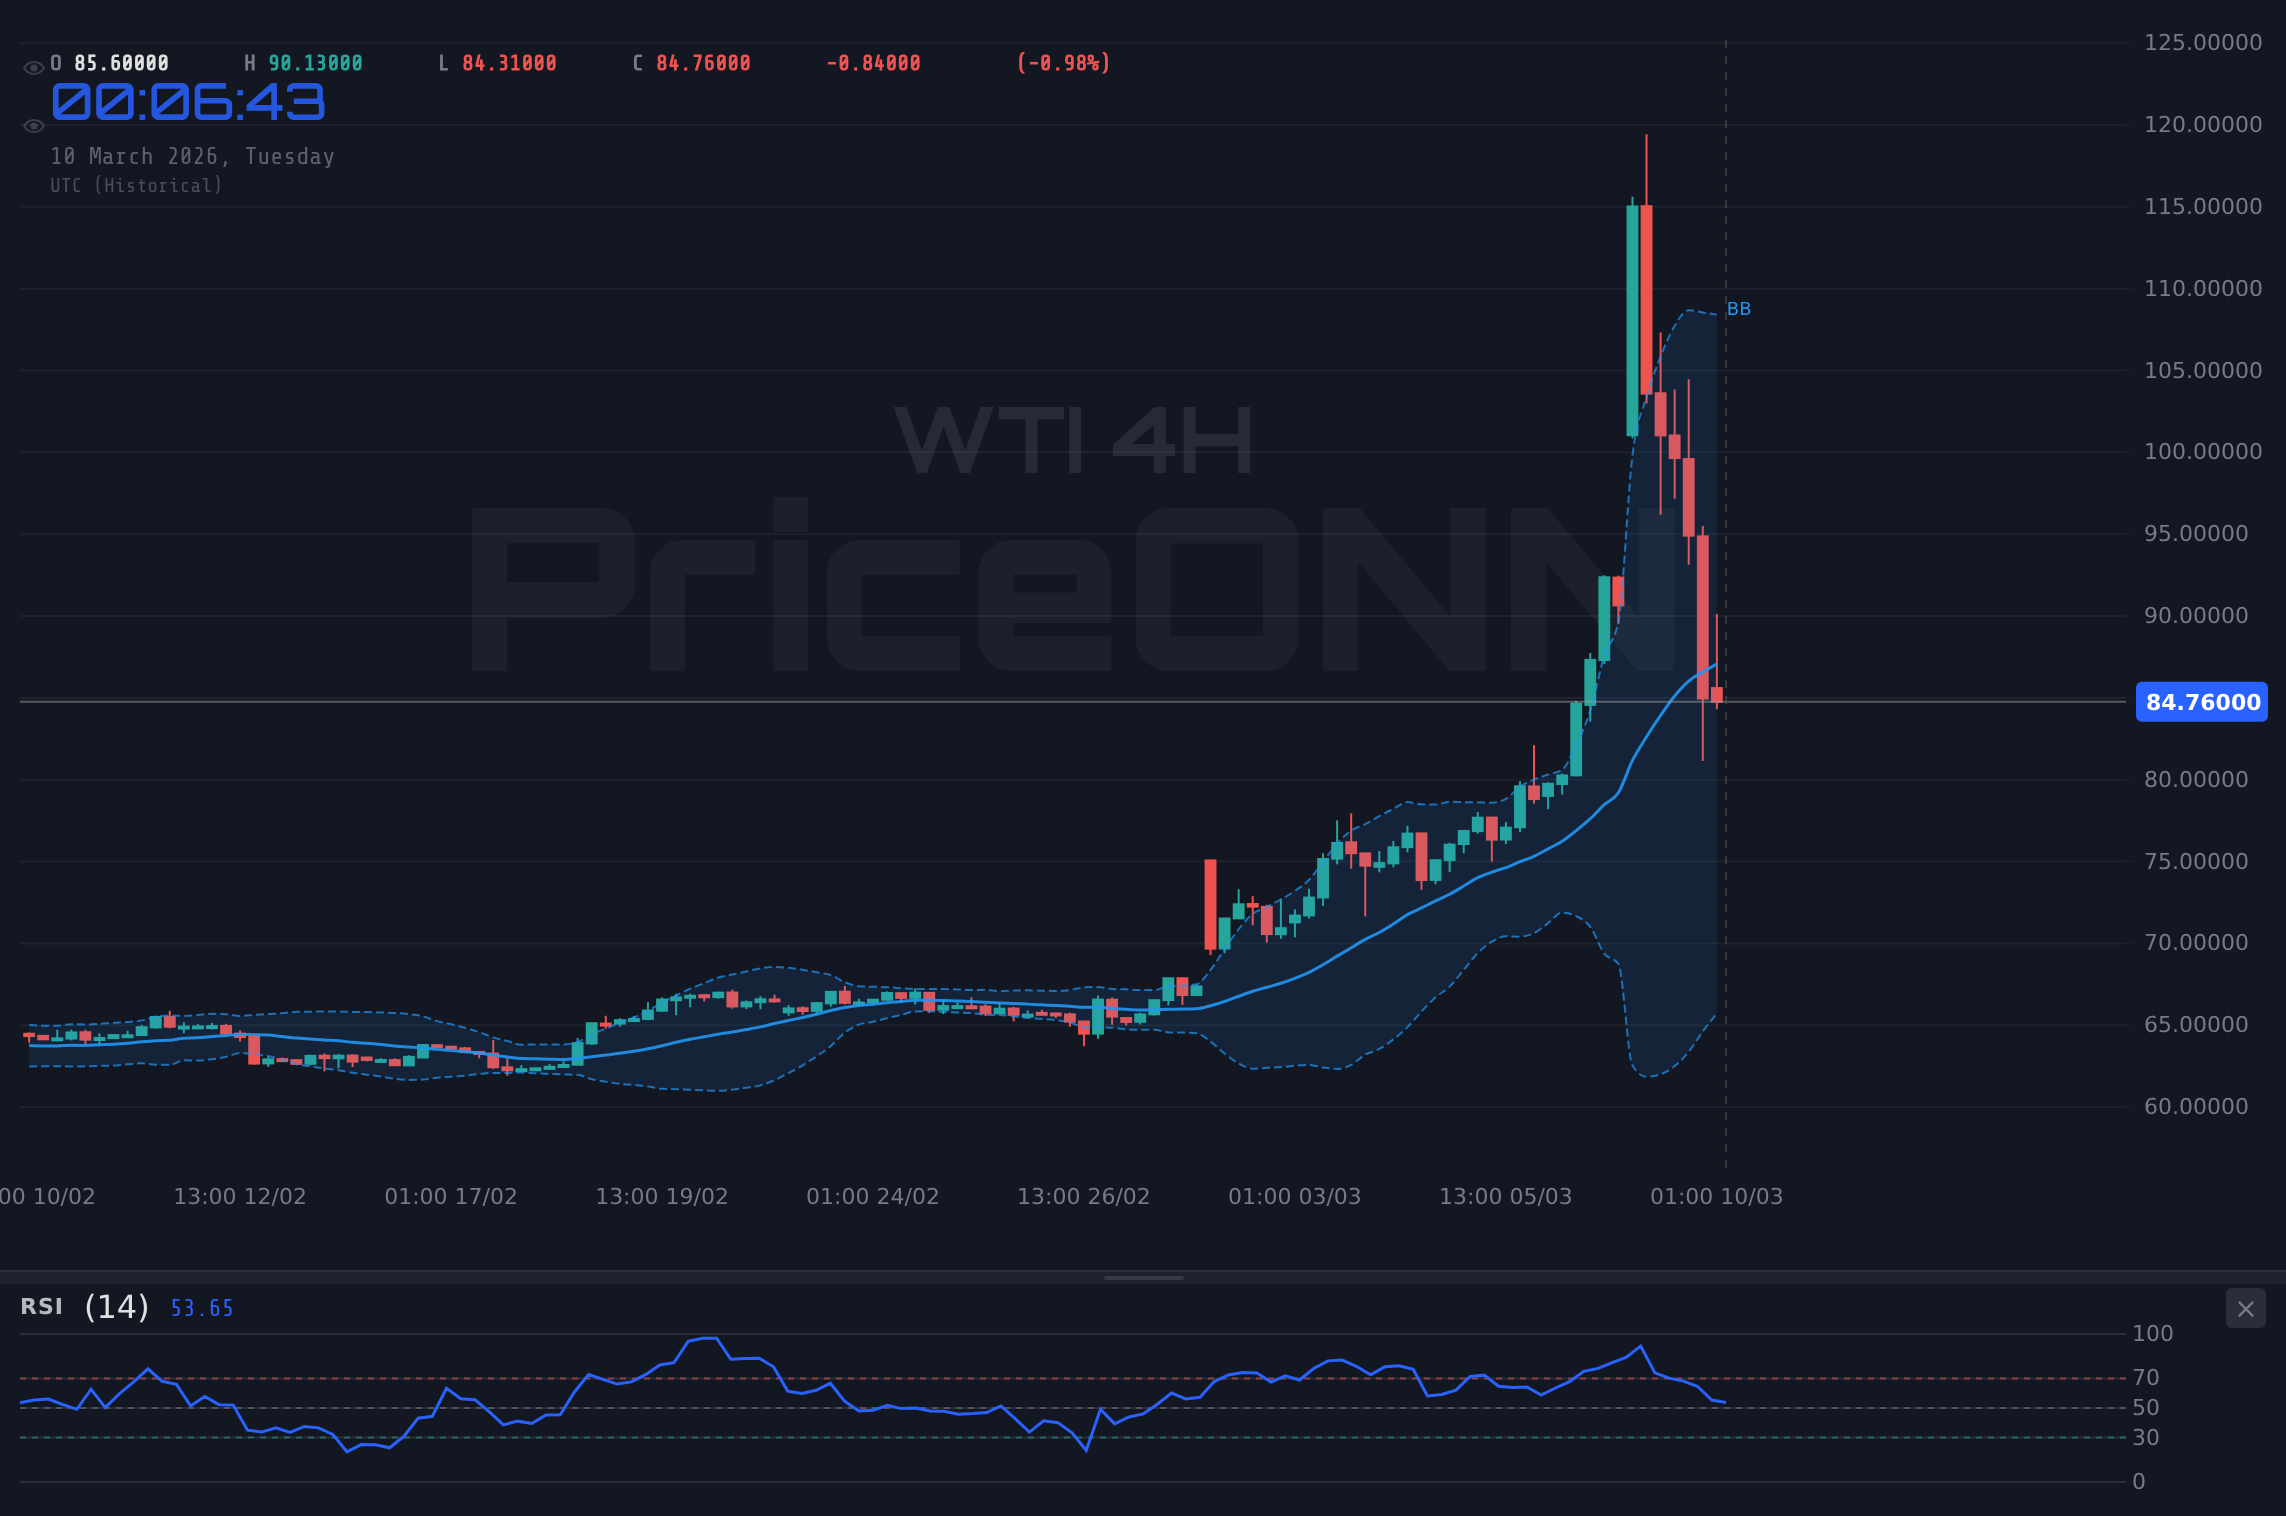
Examining WTI across multiple timeframes reveals conflicting signals. While the 1-hour chart suggests a potential pullback, the 4-hour chart presents a different perspective. The 4H RSI sits at 62.33, indicating the price has room to run. The MACD on the 4-hour chart also shows positive momentum, supporting the bullish trend. However, the ADX on the 1H chart is at 35.55, indicating a strong downtrend. This discrepancy highlights the importance of considering multiple timeframes when assessing WTI's price action. Having tracked WTI through the 2024 rate cycle, I can say that conflicting signals like these are not uncommon, and a deeper dive is necessary to understand the underlying dynamics.
Key Support and Resistance Levels for WTI
Identifying key support and resistance levels is crucial for traders looking to navigate WTI's volatility. On the 1-hour timeframe, immediate support can be found at $85.25, followed by $82.68 and $80.36. These levels could act as potential buying opportunities if the price pulls back from its current levels. Resistance, on the other hand, is located at $90.14, $92.46, and $95.03. A break above these resistance levels could signal a continuation of the bullish trend. Look, this level is absolutely critical- a break above $90.14 could open the door for further gains.
Economic Calendar and its Potential Impact on WTI
The economic calendar plays a significant role in influencing WTI prices. On Tuesday, the market will be closely watching the USD data release. Better-than-expected data could strengthen the dollar, putting downward pressure on WTI prices. Conversely, weaker-than-expected data could weaken the dollar and support WTI. Also, on Wednesday, the market will be looking at the EUR data release. This is exactly where you need to pay attention...The economic calendar events can significantly impact the direction of WTI, so traders should remain vigilant and adjust their strategies accordingly.
DXY and WTI: An Inverse Relationship
The Dollar Index (DXY) often exhibits an inverse relationship with WTI prices. With DXY currently at 98.65, any further strengthening of the dollar could exert downward pressure on WTI. Traders should monitor the DXY closely to gauge the potential impact on WTI. Historically, when the RSI reaches this zone on WTI, the outcome has been a correction in prices. This pattern last appeared in January 2025, when the price subsequently fell by 10%.
Central Bank Policies and Interest Rate Expectations
Central bank policies, particularly those of the Federal Reserve, can significantly influence WTI prices. Expectations of interest rate hikes tend to strengthen the dollar, putting downward pressure on WTI. Conversely, expectations of interest rate cuts tend to weaken the dollar and support WTI. Market participants are closely monitoring Fed communications for clues about the future path of interest rates. According to Reuters, Fed officials have recently reiterated their commitment to fighting inflation, suggesting that further rate hikes may be on the table. This could temper the bullish sentiment surrounding WTI.
Market Sentiment and Positioning
Market sentiment plays a crucial role in driving WTI prices. Currently, sentiment appears to be cautiously bullish, with many traders anticipating further gains. However, the overbought RSI signal suggests that this bullish sentiment may be overextended. It is important to note that the Commodity Futures Trading Commission (CFTC) data shows that managed money net long positions in WTI have increased in recent weeks, indicating that speculative investors are betting on further price increases. This could create a crowded trade, making WTI vulnerable to a sharp correction if sentiment shifts.
WTI Trading Strategies: Navigating the Volatility
Given the mixed signals and the potential for heightened volatility, traders should adopt a cautious approach to WTI. One potential strategy is to wait for a confirmed pullback before entering long positions. If this condition plays out, we could see a great setup! Alternatively, traders could consider shorting WTI if the price breaks below key support levels. However, it is important to manage risk effectively and use stop-loss orders to limit potential losses. Patience looks like it will be rewarded here. Manage your risk, wait for your setup- the market always gives a second chance.
Frequently Asked Questions: WTI Analysis
Is WTI a good buy right now?
Given the current price of $88.48 and the overbought RSI signal, WTI may not be a good buy right now for short-term traders. A pullback to support levels around $85.25 or $82.68 could present a more attractive entry point.
What is the WTI price forecast for this week?
The WTI price forecast for this week is highly dependent on geopolitical developments and economic data releases. A break above resistance at $90.14 could lead to further gains, while a break below support at $85.25 could trigger a deeper correction.
What are the key support and resistance levels for WTI?
Key support levels for WTI are currently at $85.25, $82.68, and $80.36. Key resistance levels are at $90.14, $92.46, and $95.03. These levels represent potential areas of buying and selling pressure.
Why is WTI moving today?
WTI is moving today primarily due to a combination of factors, including geopolitical tensions in the Middle East, economic data releases, and market sentiment. The overbought RSI signal also suggests that profit-taking may be contributing to the recent price action.
WTI's recent rally faces significant headwinds, including overbought technical conditions and geopolitical uncertainty. However, the underlying bullish trend remains intact, and a pullback could present attractive buying opportunities for long-term investors. Volatility creates opportunity- those prepared will be rewarded.
Track markets in real-time
AI-powered analysis, technical indicators and real-time price data.
Join Our Telegram Channel
Breaking market news, AI analysis and trading signals instantly.
Join Channel