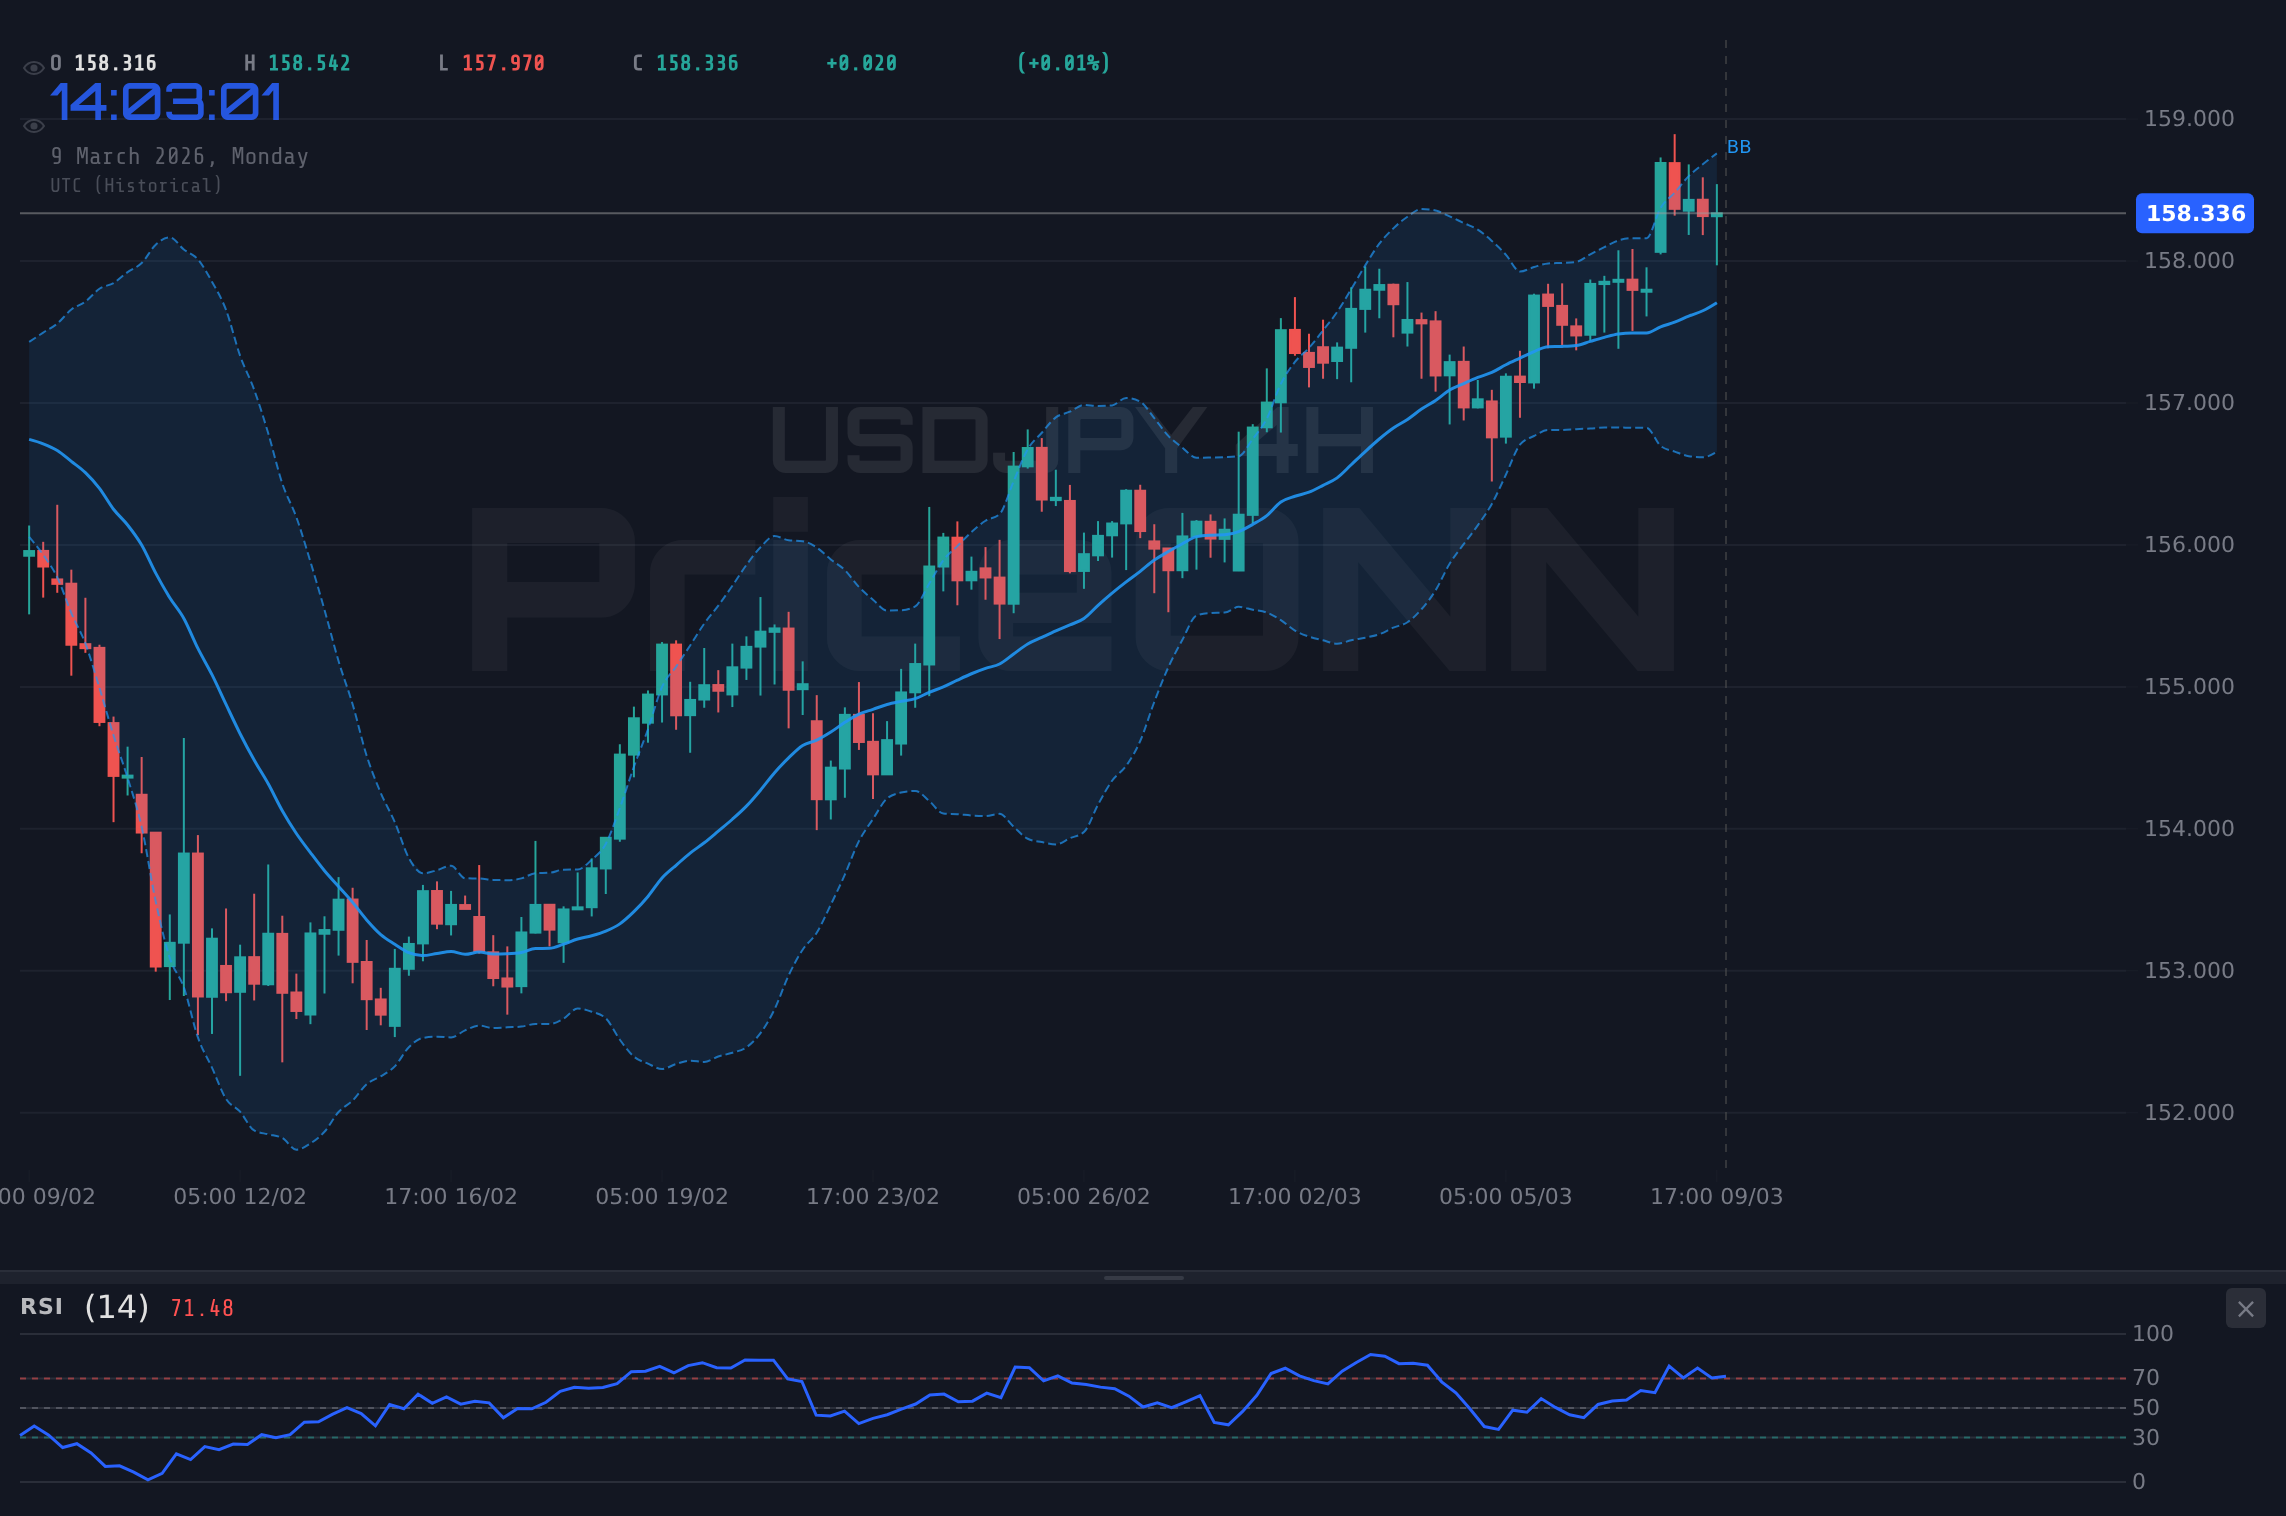
As the global oil crisis intensifies and economic data signals mixed trends, the USDJPY pair finds itself navigating a complex landscape. Currently trading near $158.32, the pair's direction hinges on upcoming retail sales data, which is expected to offer crucial insights into consumer spending and overall economic health. The dollar index, currently at 98.94, plays a crucial role, as its strength often exerts pressure on major currency pairs, including USDJPY.
- USDJPY is consolidating around $158.32, awaiting a catalyst from retail sales data.
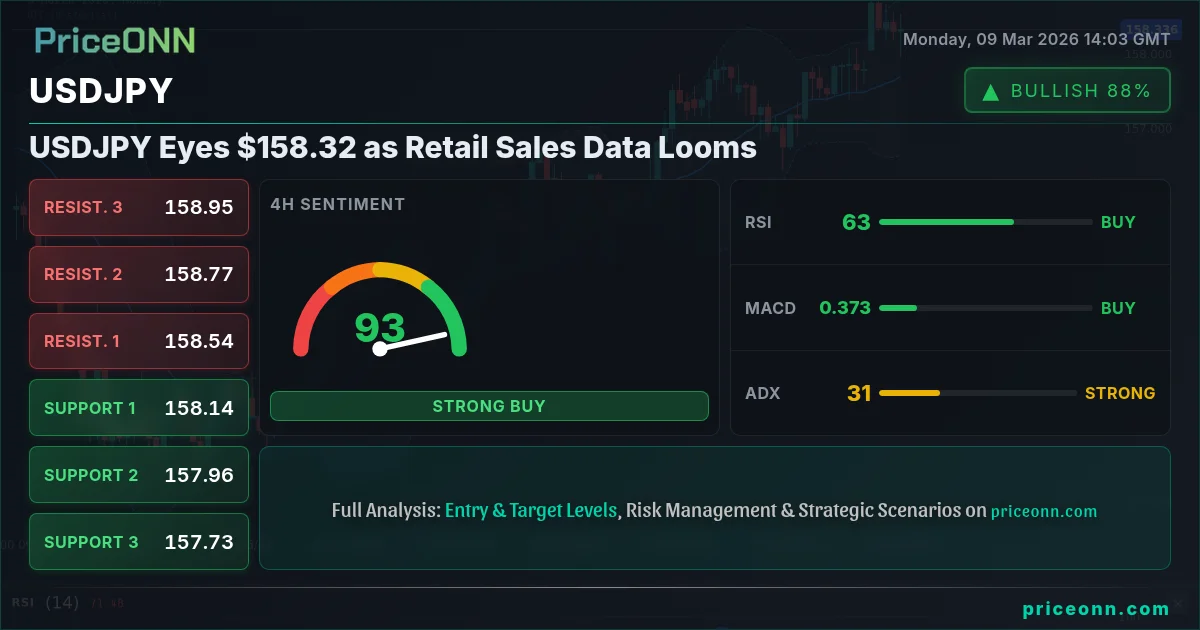
- Key resistance at 158.68, acting as a barrier for bullish momentum.
- RSI at 51.27 suggests a neutral stance, indicating a potential for either breakout or breakdown.
- DXY strength at 98.94 is influencing USDJPY, with dollar strength impacting the pair negatively.
The market is currently displaying a neutral trend across multiple timeframes. On the 1-hour chart, the ADX sits at 17.6, signaling a weak trend and suggesting a period of consolidation. However, the 4-hour chart paints a slightly different picture, with the ADX at 30.53 indicating a stronger bullish trend. This discrepancy highlights the market's indecision and the need for a clear catalyst to drive directional momentum. The upcoming retail sales data could be just that catalyst, potentially confirming or denying the current consolidation pattern.
From a fundamental perspective, the Japanese Yen has been under pressure due to the Bank of Japan's (BOJ) ultra-loose monetary policy. While other central banks have been aggressively raising interest rates to combat inflation, the BOJ has maintained its dovish stance, keeping rates near zero. This policy divergence has widened the interest rate differential between the US and Japan, making the dollar more attractive to investors and putting downward pressure on the Yen. The recent surge in crude oil prices, nearing $90 a barrel amidst Middle East tensions, as reported by several news outlets, adds another layer of complexity. Higher oil prices can fuel inflation, potentially influencing the Fed's future policy decisions and further impacting USDJPY.
The technical picture for USDJPY is mixed. On the 1-hour chart, immediate resistance lies at 158.65, a level that bulls need to overcome to establish a sustained uptrend. Support can be found at 158.41, which needs to hold to prevent further downside. A breakout above 158.65 could lead to a test of the next resistance level at 158.74. Conversely, a breakdown below 158.41 could trigger a move towards the next support level at 158.25. Scalpers might find opportunities in these short-term fluctuations, but should remain cautious due to the overall lack of clear directional bias. The stochastic oscillator on the 1H chart shows a signal of K=39.83, D=43.65 - Düşüş sinyali, %K
On the 4-hour chart, the overall signal is "AL" (Buy), with a slightly more bullish outlook. The RSI sits at 63.18, indicating potential for further upside but also suggesting that the pair is approaching overbought territory. The MACD is positive, reinforcing the bullish sentiment. However, traders should be mindful of the ADX at 30.53, which suggests that the uptrend may be losing steam. Swing traders might look for a sustained break above 158.68 to initiate long positions, targeting the next resistance level at 158.92. Stop-loss orders could be placed below 158.18 to manage risk.
The daily timeframe offers a more nuanced perspective. While the overall signal is "AL" (Buy), the Stochastic indicator shows that the pair is in overbought territory (%K: 89.61, %D: 87.04), suggesting that a correction could be imminent. The RSI at 64.09 also supports this view. The ADX at 18.01 indicates a weak trend, further highlighting the potential for a reversal. Long-term investors should exercise caution and wait for a clearer directional signal before committing to new positions. Key support lies at 157.41, a level that needs to hold to maintain the overall bullish bias.
The correlation between USDJPY and other asset classes is also worth considering. The DXY (Dollar Index) is currently trading at 98.94, with a slightly bullish bias. A stronger dollar typically puts downward pressure on USDJPY, as it makes the Yen relatively less attractive. However, the SP500 is currently down by 1.27%, indicating a risk-off environment. In such environments, safe-haven currencies like the Yen tend to strengthen, potentially offsetting the impact of the stronger dollar. The price of Brent crude oil is currently at $65.73, up by 1.96%. Higher oil prices can fuel inflation, potentially leading to a more hawkish stance from the Federal Reserve, which could further strengthen the dollar and weigh on USDJPY.
The upcoming retail sales data is expected to provide crucial insights into the strength of the US economy. A stronger-than-expected reading could reinforce the bullish bias in the dollar, pushing USDJPY higher. Conversely, a weaker-than-expected reading could undermine the dollar, leading to a decline in USDJPY. Traders should pay close attention to the actual figures released and compare them to the consensus forecasts. Any significant deviation from expectations could trigger a sharp move in the currency pair. The economic calendar shows several high-impact events scheduled for this week. On Tuesday, March 10th, the US will release its latest inflation figures. On Wednesday, March 11th, the US will release its PPI data.
Looking back, the USDJPY pair has experienced significant volatility in recent years, influenced by various factors such as the global economic slowdown, the US-China trade tensions, and the ongoing COVID-19 pandemic. The pair reached a multi-year high in early 2023, fueled by the Fed's aggressive interest rate hikes. However, it subsequently declined as the Fed signaled a potential pause in its tightening cycle. The current consolidation pattern suggests that the market is waiting for a new catalyst to drive directional momentum. The escalating oil crisis, triggered by Middle East tensions, as reported by Forex News, could add another layer of uncertainty to the economic outlook and further impact USDJPY.
For scalpers, the immediate focus is on the short-term support and resistance levels outlined above. A breakout above 158.65 could provide a quick profit opportunity, while a breakdown below 158.41 could trigger a short-selling opportunity. However, scalpers should be mindful of the overall lack of clear directional bias and manage their risk accordingly. Swing traders might look for a sustained break above 158.68 to initiate long positions, targeting the next resistance level at 158.92. Stop-loss orders could be placed below 158.18 to manage risk. Long-term investors should exercise caution and wait for a clearer directional signal before committing to new positions. Key support lies at 157.41, a level that needs to hold to maintain the overall bullish bias.
The USDJPY pair is currently in a state of consolidation, awaiting a catalyst from upcoming retail sales data. The technical picture is mixed, with conflicting signals across different timeframes. Traders should pay close attention to the actual figures released and compare them to the consensus forecasts. Any significant deviation from expectations could trigger a sharp move in the currency pair. Furthermore, traders should be mindful of the correlation between USDJPY and other asset classes, such as the DXY, SP500, and Brent crude oil. The overall outlook for USDJPY remains uncertain, and traders should exercise caution and manage their risk accordingly. With RSI at 51.27, bulls are losing steam - not in full reversal territory yet, but worth watching. The ADX at 17.6 is the real story here. A weak-trend reading like this means the breakout hasn't committed yet - it could go either way.
Frequently Asked Questions: USDJPY Analysis
Is USDJPY a good buy right now?
Given the current neutral trend and mixed signals, it's not definitively a good buy right now. A confirmed break above 158.65 could signal a buying opportunity. However, caution is warranted until the retail sales data provides more clarity.
What is the USDJPY price forecast for this week?
The USDJPY price forecast for this week is highly dependent on the retail sales data. A strong report could push the pair towards 158.92, while a weak report could lead to a decline towards 158.25. The probability of either scenario is roughly equal at this point.
What are the key support and resistance levels for USDJPY?
Key support levels for USDJPY are at 158.41 and 158.25. Key resistance levels are at 158.65 and 158.74. These levels are derived from the 1-hour chart and represent potential areas of buying and selling pressure.
Why is USDJPY moving today?
USDJPY's movement today is primarily driven by consolidation and anticipation of upcoming retail sales data. There are no major economic releases or geopolitical events impacting the pair at this moment, leading to a period of indecision.
Technical Outlook Summary
| Indicator | Value | Signal |
|---|---|---|
| RSI (14) | 51.27 | Neutral |
| MACD Histogram | Positive | Bullish |
| Stochastic | K=39.83, D=43.65 | Bearish |
| ADX | 17.6 | Weak Trend |
| Bollinger | Middle Band | Watch |
Key Levels
Support Levels
Resistance Levels
Track markets in real-time
AI-powered analysis, technical indicators and real-time price data.
Join Our Telegram Channel
Breaking market news, AI analysis and trading signals instantly.
Join Channel