For those closely monitoring USDJPY, the pair's current position near $158.03 presents a critical juncture. The market is holding its breath ahead of upcoming retail sales data, which could very well dictate the short-term direction. Is this a period of consolidation before a significant move, or are we simply seeing a market indecisive about its next steps?
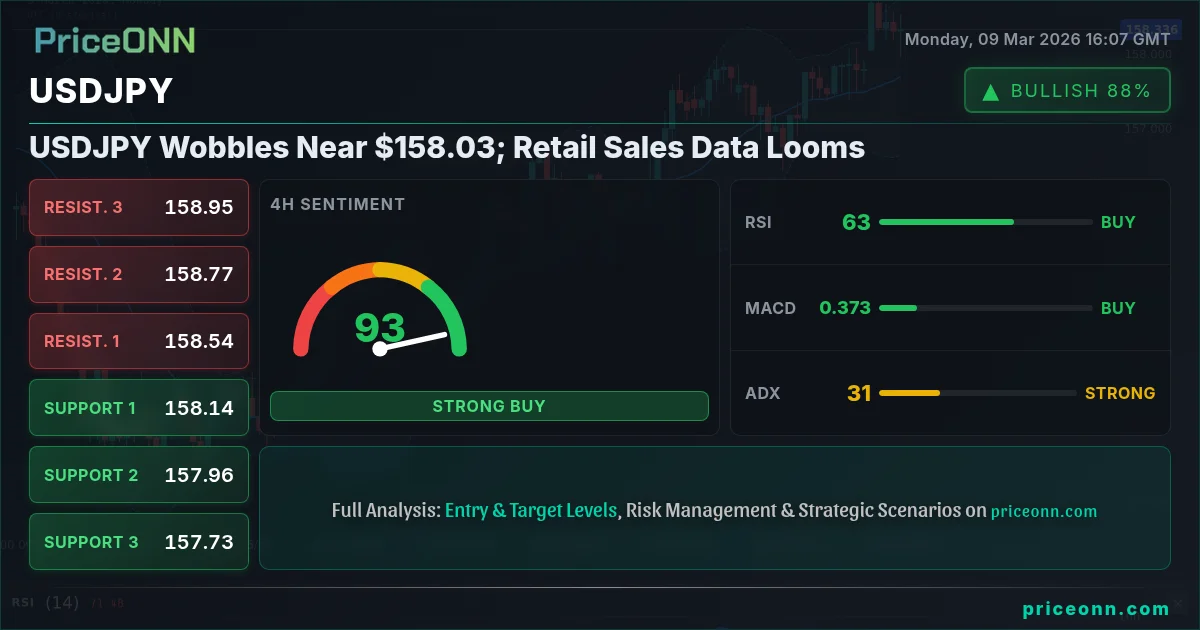
- USDJPY is hovering near $158.03, a key psychological level.
- Upcoming retail sales data is a potential catalyst for a breakout.
- RSI shows a neutral trend at 44 on the 1-hour chart, indicating a lack of strong momentum.
- Overall, the daily trend signals a neutral stance, with conflicting signals across different timeframes.
Having tracked USDJPY through various economic cycles, the current environment feels particularly sensitive. The escalating oil crisis, as highlighted by recent news of EUR/CAD plunges amidst dollar strength, adds another layer of complexity. How will these global pressures influence the yen's trajectory against the dollar?
The Calm Before the Storm: Analyzing USDJPY's Neutral Trend
The present neutral trend in USDJPY, as indicated by the data, isn't necessarily a sign of market complacency. Instead, it suggests a market bracing itself for a significant catalyst. The 1-hour chart shows a neutral trend, with the RSI at 44, reflecting neither overbought nor oversold conditions. This lack of strong momentum is further reinforced by the ADX at 16.9, indicating a weak trend. Now this is where it gets interesting! A weak trend, coupled with an impending data release, often precedes a sharp directional move.
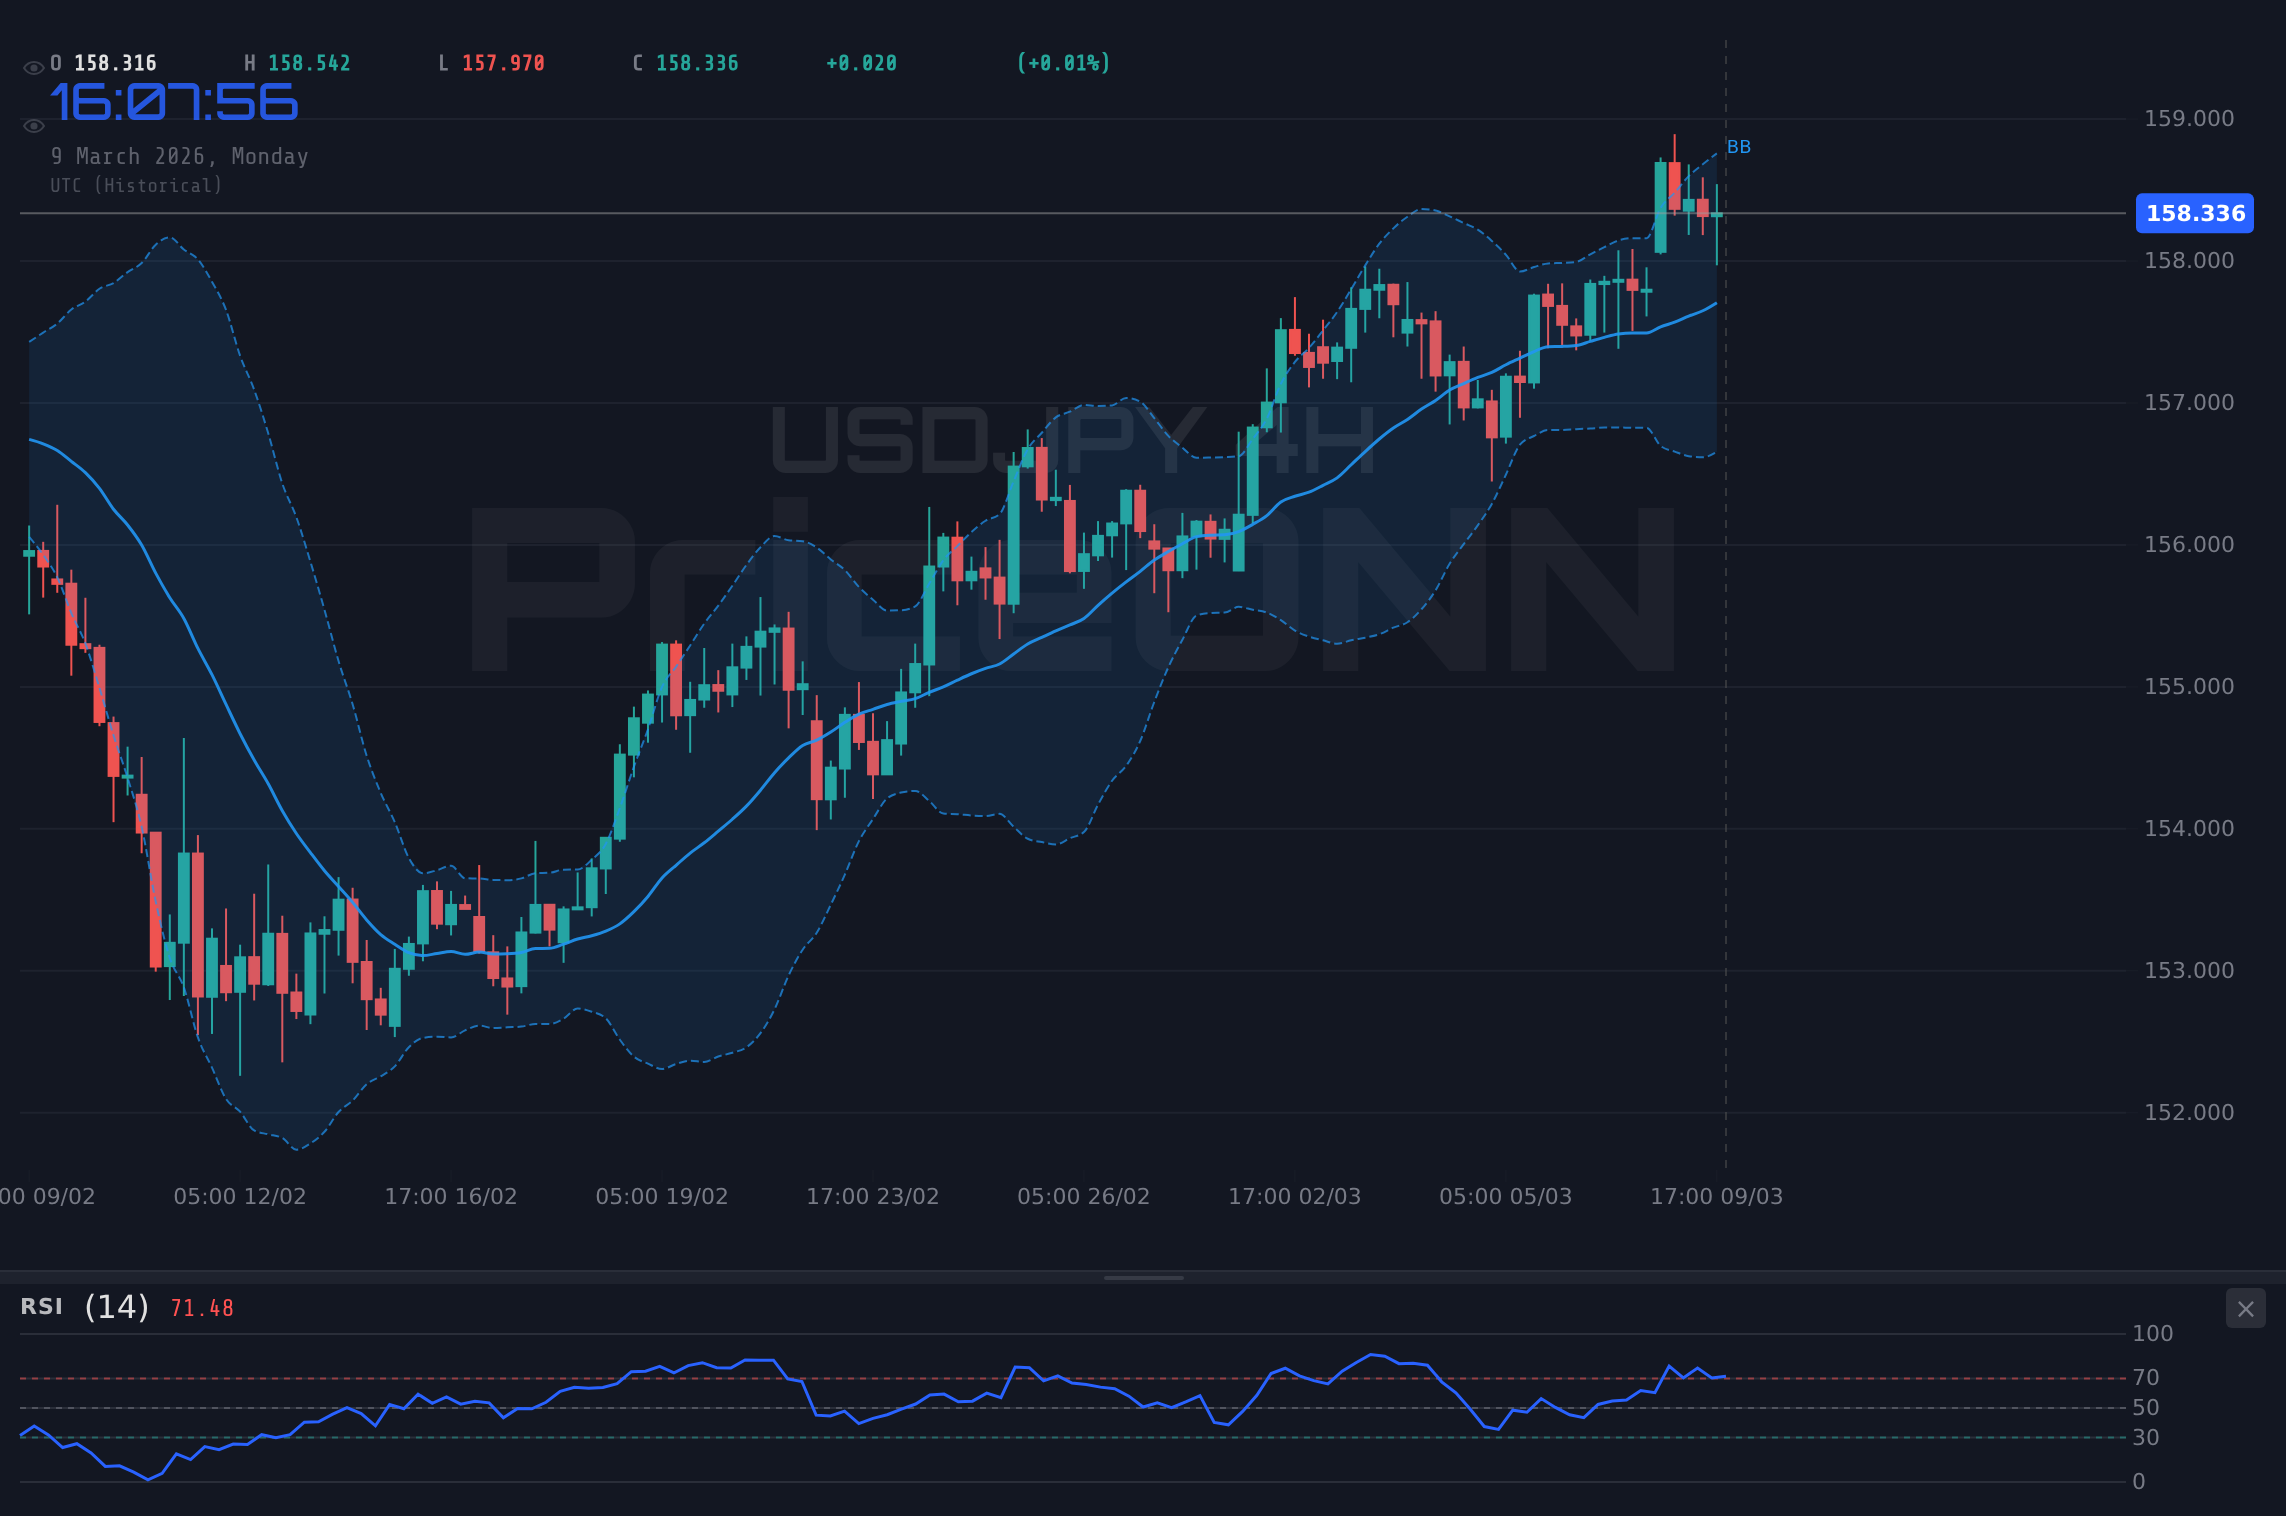
Contrast this with the 4-hour timeframe, which shows a strong upward trend (95% strength), and the daily timeframe, which is also neutral. These conflicting signals across different timeframes highlight the market's uncertainty. Are we about to see a continuation of the upward trend on the 4-hour chart, or will the daily neutral trend prevail? The answer likely lies in the upcoming retail sales data.
Decoding the Data: What Retail Sales Mean for USDJPY
Retail sales data is a crucial barometer of economic health. A strong reading typically indicates robust consumer spending, which fuels economic growth and supports the currency. Conversely, a weak reading suggests a slowdown in consumer activity, potentially weakening the currency. The impact of this data on USDJPY cannot be overstated. If the data comes in above expectations, we could see a surge in USDJPY, breaking through resistance levels. If it disappoints, support levels will likely be tested.
Looking back at recent economic data, the US job market has shown signs of weakening, as reported by recent news. This adds another layer of complexity to the equation. Will strong retail sales data be enough to offset concerns about the job market, or will the overall economic outlook weigh on the dollar? These crosscurrents are what make trading so compelling.
Navigating Key Levels: Support and Resistance in Focus
Understanding key support and resistance levels is paramount in navigating the USDJPY landscape. On the 1-hour chart, immediate support lies at 158.266, followed by 158.153 and 158.015. These levels represent potential areas where buying pressure could emerge, preventing further declines. Resistance, on the other hand, is found at 158.517, 158.655, and 158.768. A break above these levels could signal a continuation of the upward trend. These are the lines in the sand you need to watch.
Zooming out to the 4-hour timeframe, support shifts to 158.183, 157.935, and 157.686, while resistance is seen at 158.68, 158.929, and 159.177. These levels provide a broader perspective on potential price movements. The daily chart shows support at 157.418, 157.037, and 156.704, with resistance at 158.132, 158.465, and 158.846. Now this is where it gets interesting! These levels become critical pivot points for traders to monitor.
DXY Dynamics: The Dollar Index's Influence
The Dollar Index (DXY) plays a pivotal role in the USDJPY narrative. With DXY currently at 98.77 and trending upwards, it exerts upward pressure on USDJPY. However, the 1-hour chart shows a bearish signal for DXY, with the RSI at 45.17 and the ADX at a weak 12.67. If the DXY weakens, it could alleviate some of the upward pressure on USDJPY, potentially leading to a period of consolidation or even a slight decline. Conversely, if DXY continues its upward trajectory, USDJPY could experience further gains.
This inverse relationship between DXY and USDJPY is a key factor to consider. Monitoring DXY's movements can provide valuable insights into the potential direction of USDJPY. If the DXY breaks through resistance levels, it could signal a stronger dollar and further upside for USDJPY. Conversely, if DXY fails to hold support, it could indicate a weaker dollar and potential downside for USDJPY. It's a constant tug-of-war between these two forces.
Technical Indicator Insights: RSI, MACD, and Stochastic
Technical indicators offer valuable clues about the underlying market dynamics. On the 1-hour chart, USDJPY's RSI is at 44, indicating a neutral condition. The MACD shows positive momentum, but the Stochastic is signaling a potential overbought condition. This conflicting signals highlight the market's indecision. This is exactly where you need to pay attention...
The 4-hour chart paints a slightly different picture. The RSI is at 57.38, still in neutral territory, but the MACD continues to show positive momentum. The Stochastic, however, is signaling a potential pullback. On the daily chart, the RSI is at 62.81, approaching overbought levels, while the MACD is also positive. The Stochastic is firmly in overbought territory, signaling a potential correction. Again, we see conflicting signals across different timeframes, reinforcing the need for caution and confirmation.
The Impact of Global Economic Data and Events
Global economic data and events exert a significant influence on USDJPY. The upcoming retail sales data is just one piece of the puzzle. The oil crisis, geopolitical tensions, and central bank policies all play a role. Recent news highlights the escalating oil crisis, which could have a significant impact on global economies and currencies. How will these events influence the yen's trajectory against the dollar? It's a complex web of interconnected factors.
Looking at the economic calendar, there are several key events to watch. The upcoming JPY data release on Monday will provide insights into the Japanese economy. The US data release on Tuesday will shed light on the US economic outlook. Keep your eyes peeled for these potential market movers.
Frequently Asked Questions: USDJPY Analysis
Is USDJPY a good buy right now?
USDJPY's neutral trend and impending retail sales data make it a risky buy currently. The price around $158.03 is a pivotal level, and waiting for data confirmation before entering a long position is advisable.
What is the USDJPY price forecast for this week?
This week's USDJPY price forecast hinges on the retail sales data. A positive surprise could push it towards 158.80, while a disappointment might see it test support at 157.40. Expect volatility.
What are the key support and resistance levels for USDJPY?
Key support levels for USDJPY are 157.418, 157.037, and 156.704. Resistance levels to watch are 158.132, 158.465, and 158.846, all derived from current market data.
Why is USDJPY moving today?
USDJPY's movement today is influenced by a combination of DXY strength and market anticipation of upcoming retail sales data. This data will provide insight into consumer spending and economic growth.
The USDJPY market is at a critical juncture, with the upcoming retail sales data poised to be a major catalyst. The neutral trend, conflicting signals across different timeframes, and influence of DXY all contribute to the uncertainty. The market is holding its breath, waiting for the data to provide a clear direction. Manage your risk, wait for your setup-the market always gives a second chance.
Track markets in real-time
AI-powered analysis, technical indicators and real-time price data.
Join Our Telegram Channel
Breaking market news, AI analysis and trading signals instantly.
Join Channel