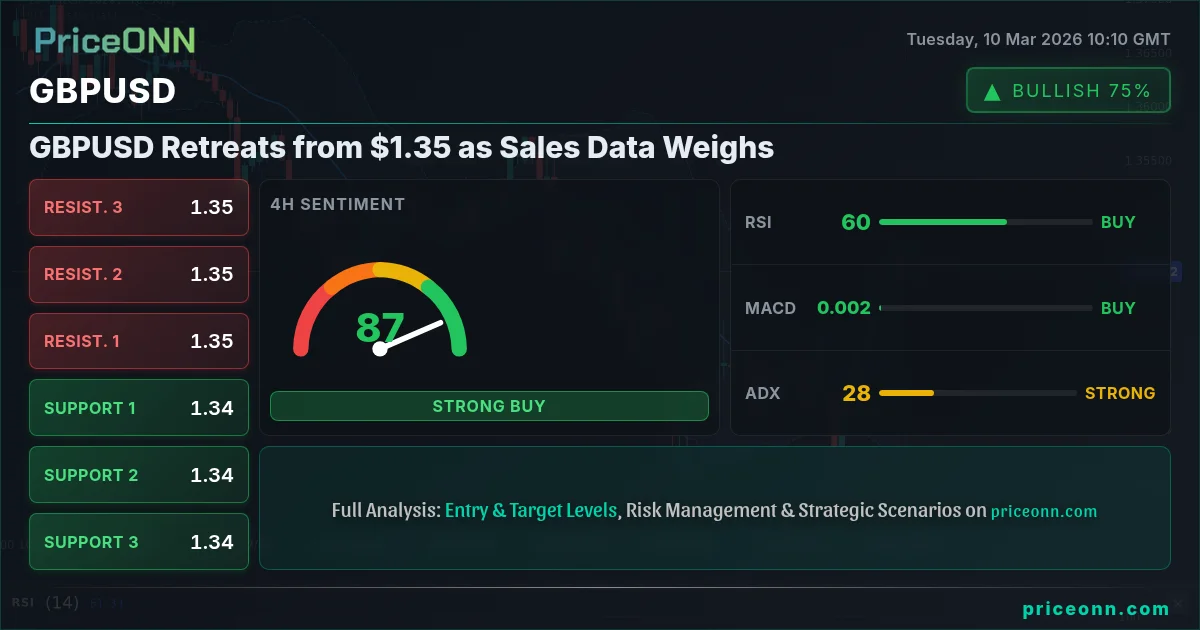
GBPUSD's struggle at the $1.35 level highlights the ongoing battle between bulls and bears. Can the pair sustain its recent gains, or will economic data and central bank policies exert downward pressure? GBPUSD today analysis reveals a market at a critical juncture, with both technical and fundamental factors suggesting potential downside.
- GBPUSD retreats from $1.35 as weaker-than-expected sales data emerges.
- Key support sits at 1.34457, a level tested multiple times in the last few hours.
- MACD histogram shows waning bullish momentum, signaling a potential trend reversal.
- Upcoming UK GDP data on March 13th will be crucial in determining GBPUSD's direction.
The Bullish Case for GBPUSD
Despite the recent pullback, several factors support a bullish outlook for GBPUSD. The pair's short-term trend is upward, with the 1-hour chart indicating a strong bullish trend with an ADX of 41.54. The RSI(14) on the 1-hour timeframe stands at 64.84, suggesting that while not overbought, there's still room for further upside. The Stochastic oscillator, with %K at 74.69 and %D at 66.7, further confirms the bullish momentum.
From a fundamental perspective, scaled-back expectations for BoE rate cuts are providing some support. As reported on March 9th, GBP/JPY advanced as markets reassessed the monetary policy outlook for the UK. This suggests that the market is pricing in a less dovish stance from the Bank of England, which could bolster the pound. The overall signal on the 1H timeframe is a strong 'AL' (Buy) signal, which reflects the short-term bullish outlook.
The Bearish Case for GBPUSD
Conversely, a bearish scenario for GBPUSD cannot be dismissed. The daily chart reveals a strong downward trend with an ADX of 27.88. The RSI(14) on the daily timeframe is at 46.91, indicating that the pair is neither overbought nor oversold, leaving room for further downside. The Stochastic oscillator shows a potential sell signal, with %K at 54.6 and %D at 38.64.
Fundamentally, the strength of the US dollar, fueled by Middle East tensions, is a significant headwind for GBPUSD. As reported on March 10th, EUR/USD softened below 1.1650 as Middle East turmoil boosted the US Dollar. While this directly impacts EUR/USD, the broader dollar strength also weighs on GBPUSD. Furthermore, weaker-than-expected UK economic data, such as the upcoming sales data and home sales figures, could further pressure the pound. The overall signal on the 1D timeframe is a 'SAT' (Sell) signal, reflecting the longer-term bearish outlook.
Technicals as Tiebreaker: Navigating Conflicting Signals
Given the conflicting signals from different timeframes, technical analysis can help determine the likely direction of GBPUSD. The key level to watch is the immediate resistance at 1.34765 on the 1-hour chart. A sustained break above this level could invalidate the bearish scenario and pave the way for further gains. Conversely, failure to break above this resistance and a subsequent break below the immediate support at 1.34457 would confirm the bearish outlook.
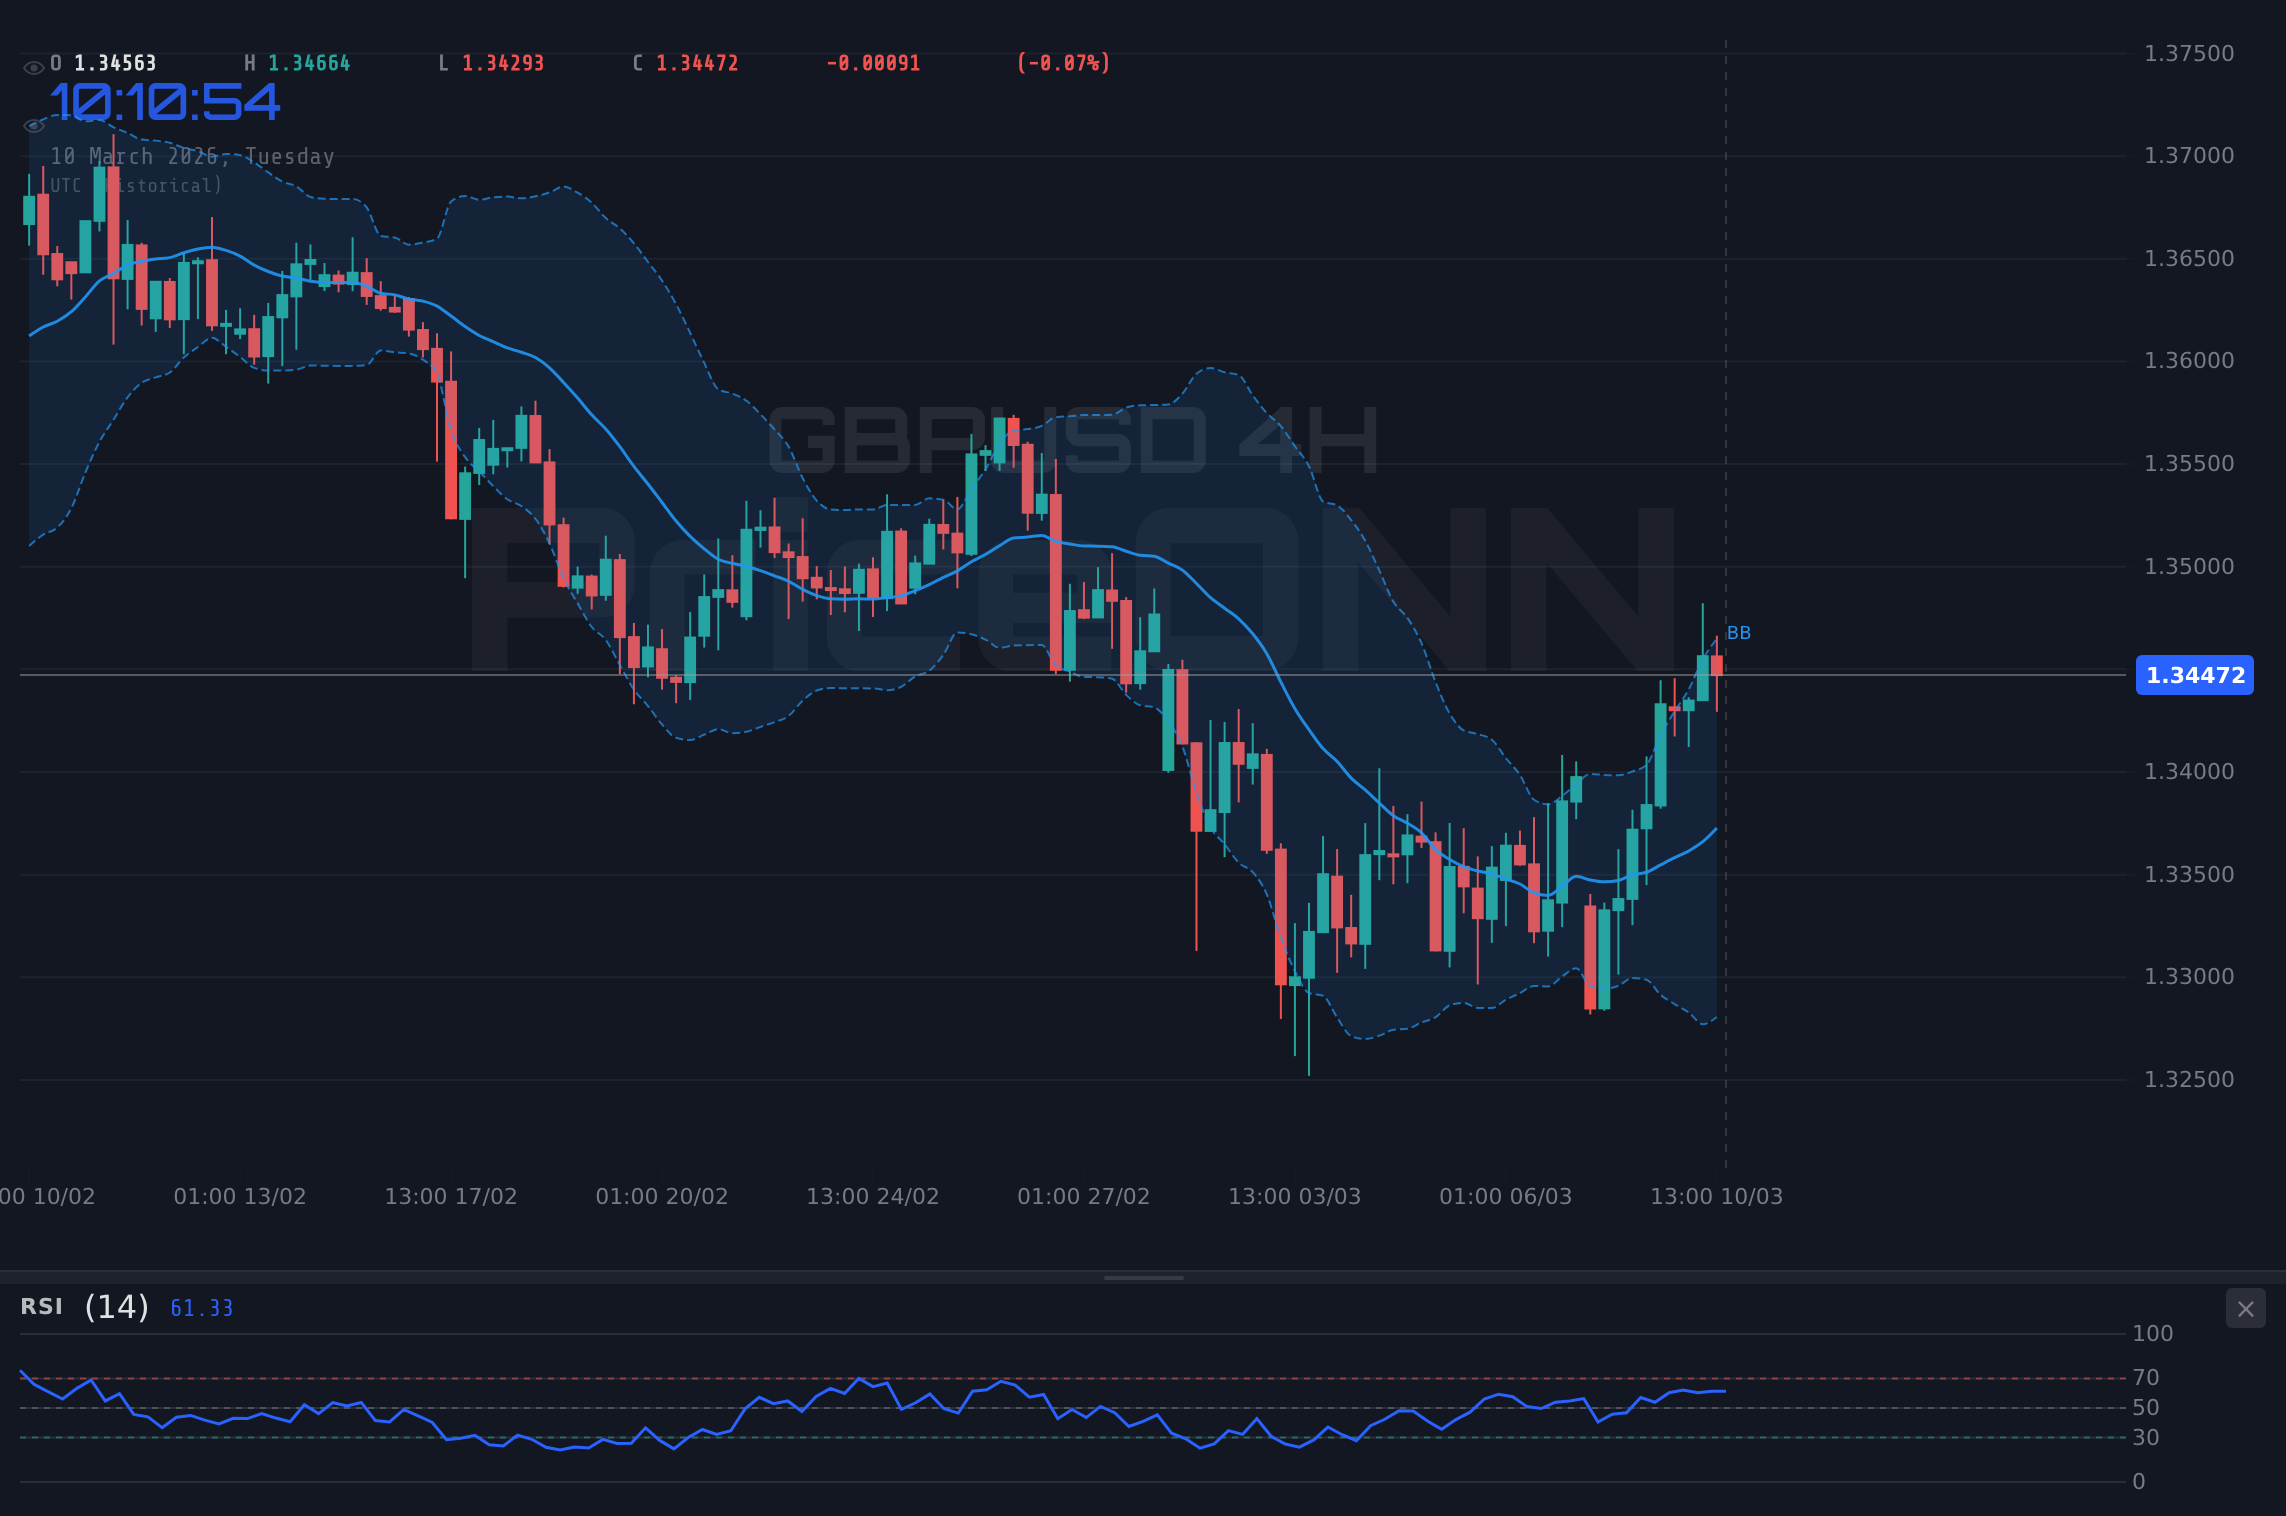
Multi-timeframe analysis is crucial here. While the 1-hour chart suggests bullish momentum, the 4-hour chart presents a more neutral picture. The 4-hour RSI(14) is at 61.29, and the ADX is at 29.22, indicating a moderately strong bullish trend. However, the Stochastic oscillator is in overbought territory, with %K at 90.31 and %D at 78.24, suggesting a potential pullback. This highlights the need for caution and confirmation before committing to a directional bias.
Economic Data in Focus: The Week Ahead
The economic calendar will play a crucial role in shaping GBPUSD's direction this week. The high-impact GBP data release on March 13th (Friday) will be closely watched. The previous reading was 0.1, and the market will be keen to see if the UK economy has gained momentum. Any disappointing data could further pressure the pound, reinforcing the bearish scenario. Meanwhile, the US data releases on March 11th (Wednesday) and March 13th (Friday) will also be important. Strong US data could further bolster the dollar, adding to the downside pressure on GBPUSD.
The Verdict: Cautious Bearish Outlook
Considering the technical and fundamental factors, a cautious bearish outlook appears justified for GBPUSD. While the short-term bullish momentum cannot be ignored, the longer-term downward trend and the strength of the US dollar present significant headwinds for the pair. The key levels to watch are the resistance at 1.34765 and the support at 1.34457. A break below the support would confirm the bearish outlook, while a sustained break above the resistance could signal a potential trend reversal.
Traders should exercise caution and wait for confirmation before committing to a directional bias. Monitoring the upcoming economic data releases and paying close attention to price action around the key levels will be crucial in navigating GBPUSD's next move.
Frequently Asked Questions: GBPUSD Analysis
What happens if GBPUSD breaks below 1.34457 support?
If GBPUSD breaks below the 1.34457 support level, it would likely confirm the bearish outlook. The next support level to watch would be 1.34331, followed by 1.34149, as indicated by the 1H timeframe data.
Should I buy GBPUSD at the current levels of $1.35, given the RSI at 64.84 on the 1H chart?
While the RSI at 64.84 on the 1H chart suggests bullish momentum, it's prudent to wait for confirmation before buying. Consider waiting for a break above the 1.34765 resistance level, or for a pullback to the 1.34457 support level, before entering a long position.
Is the Stochastic oscillator's overbought signal on the 4H chart a reliable sell signal for GBPUSD?
The Stochastic oscillator's overbought signal on the 4H chart, with %K at 90.31 and %D at 78.24, suggests a potential pullback. However, it's not a reliable sell signal on its own. It should be used in conjunction with other technical indicators and fundamental factors to confirm the bearish outlook.
How will the UK GDP data on March 13th affect GBPUSD this week?
The UK GDP data on March 13th will be a crucial catalyst for GBPUSD this week. Stronger-than-expected data could bolster the pound, potentially leading to a break above the 1.34765 resistance level. Conversely, weaker-than-expected data could further pressure the pound, confirming the bearish outlook and leading to a break below the 1.34457 support level.
Technical Outlook Summary
| Indicator | Value | Signal |
|---|---|---|
| RSI (14) | 64.84 | Neutral |
| MACD Histogram | Positive | Bullish |
| Stochastic | 85.58/81.57 | Overbought |
| ADX | 33.73 | Strong Trend |
| Bollinger | Upper Band | Watch |
Track markets in real-time
AI-powered analysis, technical indicators and real-time price data.
Join Our Telegram Channel
Breaking market news, AI analysis and trading signals instantly.
Join Channel