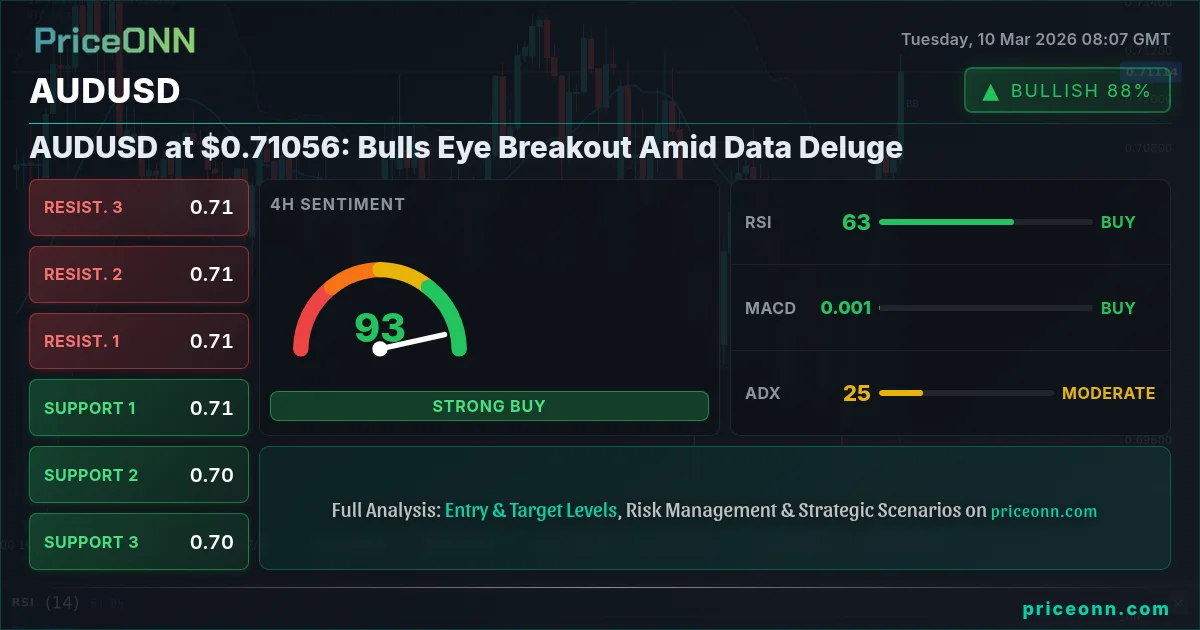
AUDUSD is currently trading at $0.71056, a level where bulls and bears are locked in a fierce battle. The pair has exhibited positive momentum in the short term, but the longer-term picture remains less clear. The question now is whether the bulls can sustain this momentum and push AUDUSD through key resistance levels, or whether the bears will regain control and drive the pair lower.
- AUDUSD currently trades at $0.71056, a critical level for bulls to defend
- Immediate resistance is at $0.71178, a break above which could trigger further gains
- The 1-hour RSI at 72.78 signals overbought conditions, warranting caution for short-term traders.
- Upcoming USD data releases on Wednesday and Friday could inject volatility into AUDUSD
The Bullish Case for AUDUSD
The bullish case for AUDUSD hinges on several factors. First, the short-term technical indicators suggest positive momentum. The 1-hour chart shows a strong uptrend, with the ADX at 30.07 confirming the strength of the move. The RSI, while in overbought territory at 72.78, has not yet reached levels that would typically trigger a significant reversal. The MACD is also positive, indicating that the upward momentum is likely to continue in the near term. Furthermore, the Stochastic oscillator shows a bullish signal, with %K greater than %D.
Second, the overall trend for AUDUSD in the 1-hour, 4-hour, and 1-day timeframes is up, with the 1-hour trend showing a 94% strength. A break above the immediate resistance level of $0.71178 could open the door for a test of the next resistance level at $0.71588. Additionally, the SP500 is up 0.4% today, indicating positive risk sentiment that often supports commodity currencies like the AUD. If the positive risk sentiment continues to prevail, AUDUSD could see further upside.
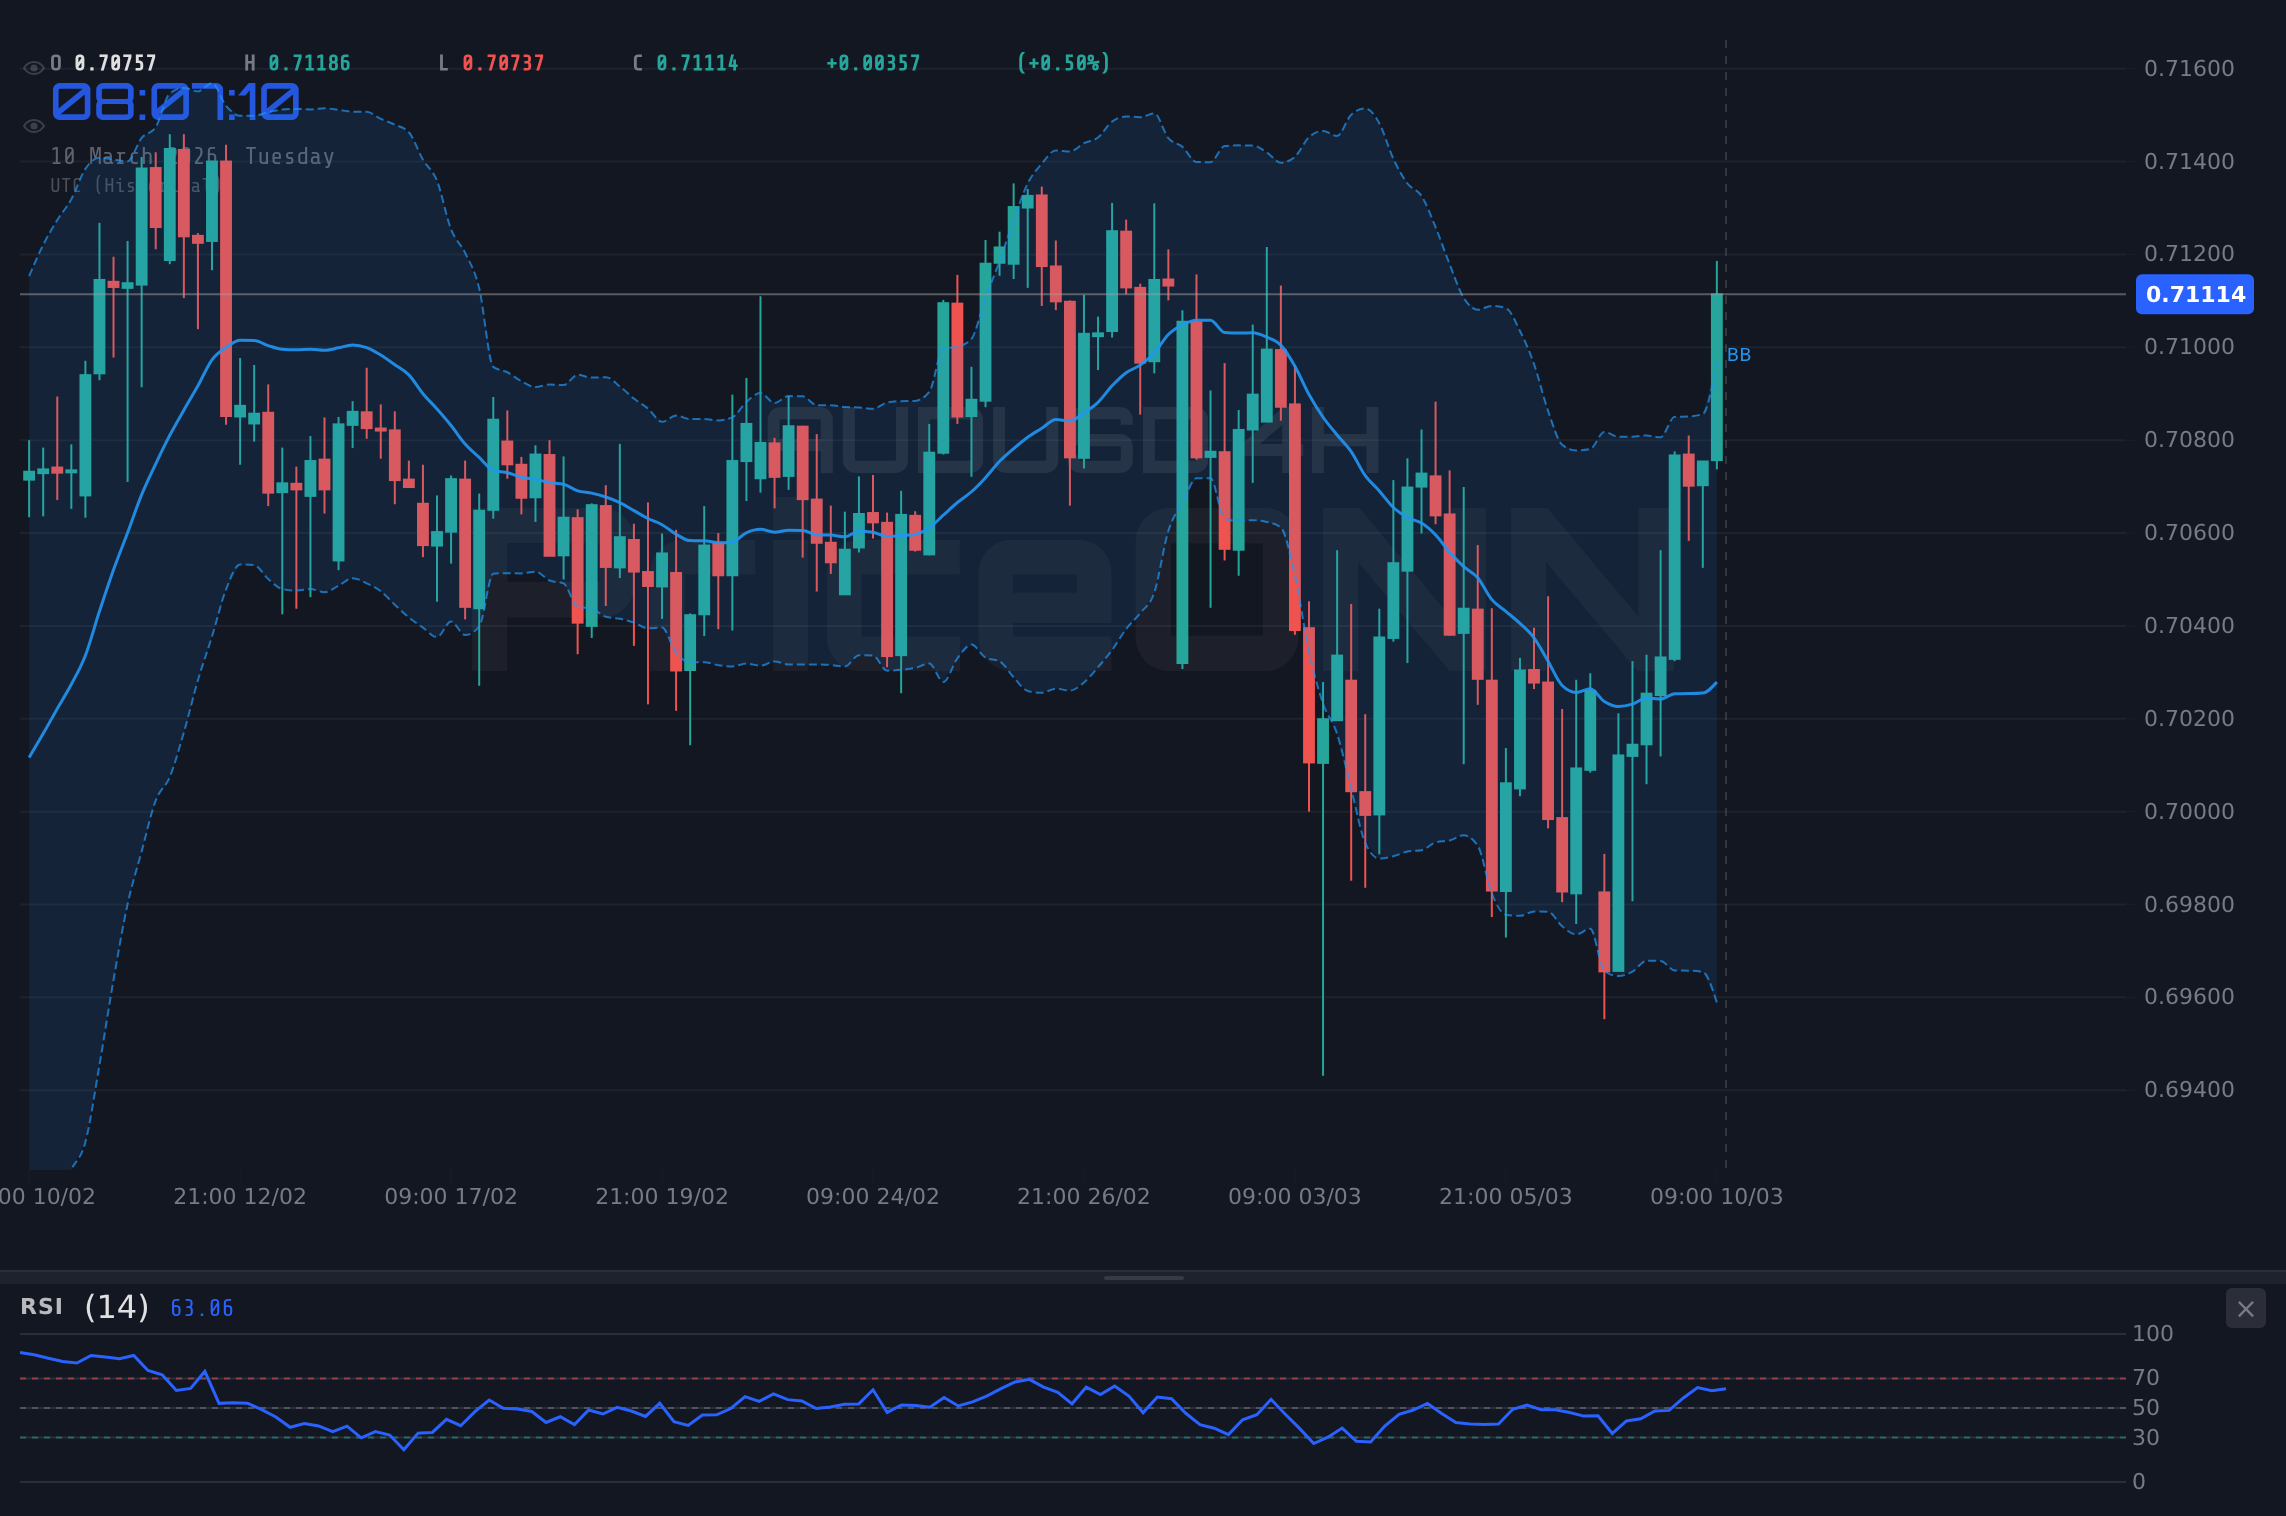
Third, the price action has been constructive, with AUDUSD consistently making higher highs and higher lows on the 1-hour chart. This suggests that the bulls are in control and are likely to continue pushing the pair higher. Scalpers may look to capitalize on the short-term bullish momentum by targeting the resistance levels at $0.71178 and $0.71588. Swing traders may wait for a pullback to support before entering long positions, while long-term investors may look to add to their positions on any significant dips.
The Bearish Counter-Argument
Despite the bullish momentum, there are several reasons to be cautious about AUDUSD. First, the daily chart shows a bearish trend, with the ADX at 27.94 indicating a strong downtrend. Although the 1D RSI is in neutral territory at 58.7, the Stochastic oscillator shows a bearish signal, with %K less than %D. The overall signal for the 1-day timeframe is 'Sell', indicating the potential for downward pressure on the pair.
Second, the DXY (Dollar Index) is currently trading at 98.32. A stronger dollar typically puts pressure on AUDUSD, and any further gains in the DXY could weigh on the pair. The US Dollar Index gathers strength to near 99.00 on Middle East tensions, which may further boost the dollar and pressure AUDUSD. Furthermore, the upcoming USD data releases on Wednesday and Friday could provide a catalyst for a stronger dollar, potentially triggering a reversal in AUDUSD.
Third, the news from March 9 indicates that gold prices dropped below $5,100 as oil spike lifts US Dollar. Given the positive correlation between gold and AUD, a decline in gold prices could also weigh on AUDUSD. The bearish scenario would be confirmed if AUDUSD breaks below the support level of $0.70781. A break below this level could open the door for a test of the next support level at $0.7064.
Technicals as the Tiebreaker
The technical picture for AUDUSD is mixed, with conflicting signals across different timeframes. On the 1-hour chart, the pair is clearly in an uptrend, with positive momentum and supportive technical indicators. However, on the daily chart, the trend is bearish, with negative momentum and a 'Sell' signal. The 4-hour chart is neutral, suggesting that the pair is currently in a consolidation phase.
The key to resolving this conflict is to focus on the key levels. The immediate resistance is at $0.71178. A break above this level would confirm the bullish momentum and open the door for further gains. On the other hand, the immediate support is at $0.70781. A break below this level would negate the bullish momentum and suggest that the bears are regaining control. The ADX at 13.36 on the 1-day timeframe suggests a weak trend, indicating that the market is in a consolidation phase. This further supports the notion that a breakout above resistance or a breakdown below support could trigger a significant move in AUDUSD.
For scalpers, the focus should be on the short-term momentum. Look for opportunities to buy on dips towards support and sell on rallies towards resistance. Swing traders should wait for a clear break above resistance or a breakdown below support before entering positions. Long-term investors should remain patient and look to add to their positions on any significant dips, while keeping a close eye on the overall trend and the fundamental drivers.
Economic Data Impact
The economic calendar is packed with high-impact data releases that could significantly influence AUDUSD. On Wednesday, there are several USD data releases to watch, including previous data of 0.2, 2.4, and 0.3. These data points will provide insights into the strength of the US economy and could impact the dollar's trajectory. A stronger-than-expected reading could boost the dollar and weigh on AUDUSD, while a weaker-than-expected reading could have the opposite effect.
On Friday, the focus will be on GBP data, with previous data of 0.1, and USD data, with previous data of 4.3, 0.4, and 3. These data points will provide further insights into the health of the global economy and could impact risk sentiment. Positive data could boost risk sentiment and support AUDUSD, while negative data could trigger risk aversion and weigh on the pair. The All Eyes Remain on the Conflict in the Middle East news, as reported on March 9, suggests that geopolitical tensions could also influence market sentiment and impact AUDUSD.
Correlation Analysis: DXY, SP500, and Oil
AUDUSD's price action is often correlated with other assets, including the DXY, SP500, and oil prices. The DXY, currently at 98.32, measures the strength of the US dollar against a basket of currencies. A rising DXY typically puts pressure on AUDUSD, as a stronger dollar makes the Australian dollar relatively more expensive. Conversely, a falling DXY tends to support AUDUSD.
The SP500 is a gauge of risk appetite. A rising SP500 typically indicates positive risk sentiment, which tends to support commodity currencies like the AUD. Conversely, a falling SP500 suggests risk aversion, which tends to weigh on AUDUSD. The Nasdaq100 is up 0.52% today, indicating positive risk sentiment that may support AUDUSD.
Oil prices can also influence AUDUSD, particularly through their impact on inflation expectations. Rising oil prices tend to fuel inflation expectations, which can prompt central banks to raise interest rates. Higher interest rates can boost a currency's attractiveness and support its value. Currently, WTI crude oil is at $86.01, and Brent crude oil is at $65.73. These prices are relatively stable, and their impact on AUDUSD may be limited.
Frequently Asked Questions: AUDUSD Analysis
What happens if AUDUSD breaks above $0.71178 resistance?
A break above the $0.71178 resistance level would likely confirm the bullish momentum and open the door for a test of the next resistance level at $0.71588. Scalpers and swing traders may look to enter long positions on such a breakout.
Should I buy AUDUSD at current levels of $0.71056 given the RSI at 72.78?
The RSI at 72.78 indicates overbought conditions on the 1-hour chart, suggesting caution for short-term traders. It may be prudent to wait for a pullback towards support before entering long positions. However, the overall trend remains bullish, and a break above resistance could negate the overbought signal.
Is the bearish signal on the daily Stochastic oscillator a reason to sell AUDUSD?
The bearish signal on the daily Stochastic oscillator suggests that the bears may be regaining control. However, the overall trend is mixed, and the 4-hour chart is neutral. It may be prudent to wait for a clear breakdown below support before entering short positions.
How will the upcoming USD data releases on Wednesday affect AUDUSD this week?
The upcoming USD data releases on Wednesday could inject volatility into AUDUSD. Stronger-than-expected data could boost the dollar and weigh on AUDUSD, while weaker-than-expected data could have the opposite effect. Traders should closely monitor these data releases and adjust their positions accordingly.
Track markets in real-time
AI-powered analysis, technical indicators and real-time price data.
Join Our Telegram Channel
Breaking market news, AI analysis and trading signals instantly.
Join Channel