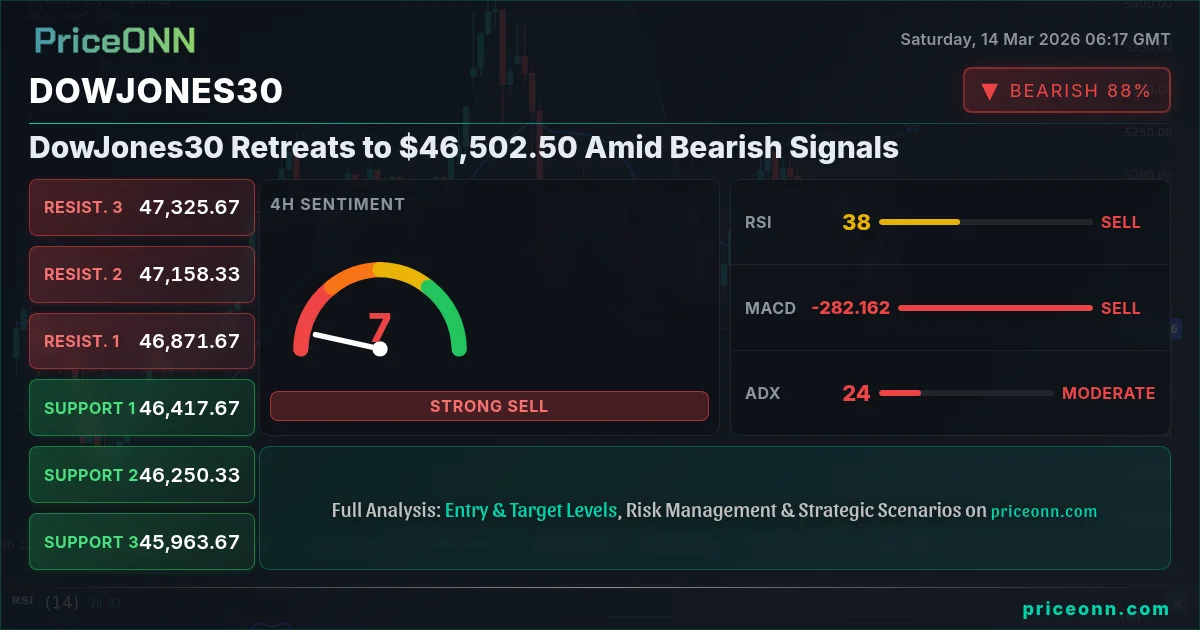
DowJones30 closed last Friday at $46,502.50, facing considerable bearish pressure. The index is navigating a complex landscape of technical headwinds and looming economic data, setting the stage for a potentially volatile week ahead. Several technical indicators point to the possibility of further declines, urging caution among investors.
- RSI at 27.44 on the daily chart signals oversold conditions but also underlying weakness.
- Critical support sits at 46,485.67, a break below which could trigger further selling.
- MACD histogram shows negative momentum, suggesting bearish pressure remains intact.
- Federal Reserve policy expectations are driving DowJones30's correlation with the DXY.
The DowJones30's performance last week was characterized by a steady decline, culminating in a close at $46,502.50. This bearish momentum is reflected in the daily chart, where the Relative Strength Index (RSI) sits at 27.44, indicating oversold conditions. While this might suggest a potential for a bounce, it also underscores the underlying weakness in the index. The oversold RSI alone is not a buy signal; it needs confirmation from other indicators or a change in market sentiment. A contrarian investor might see this as an opportunity, but the overall technical picture warrants caution.
Adding to the bearish outlook is the Moving Average Convergence Divergence (MACD) histogram, which shows negative momentum. The MACD line remains below the signal line, reinforcing the downward trend. This suggests that selling pressure is still prevalent, and a trend reversal is not yet confirmed. The ADX on the daily timeframe is at 34.71, indicating a strong downtrend, which further supports the bearish narrative. While the RSI may be hinting at oversold conditions, the MACD and ADX confirm that the bears are still in control.
Key support levels to watch include 46,485.67, 46,243.33, and 45,825.67. The immediate support at 46,485.67 is crucial; a break below this level could trigger further selling, potentially leading the index towards the subsequent support levels. On the upside, resistance levels are located at 47,145.67, 47,563.33, and 47,805.67. The DowJones30 would need to convincingly break above 47,145.67 to negate the current bearish trend. Without such a breakout, the path of least resistance appears to be downward.
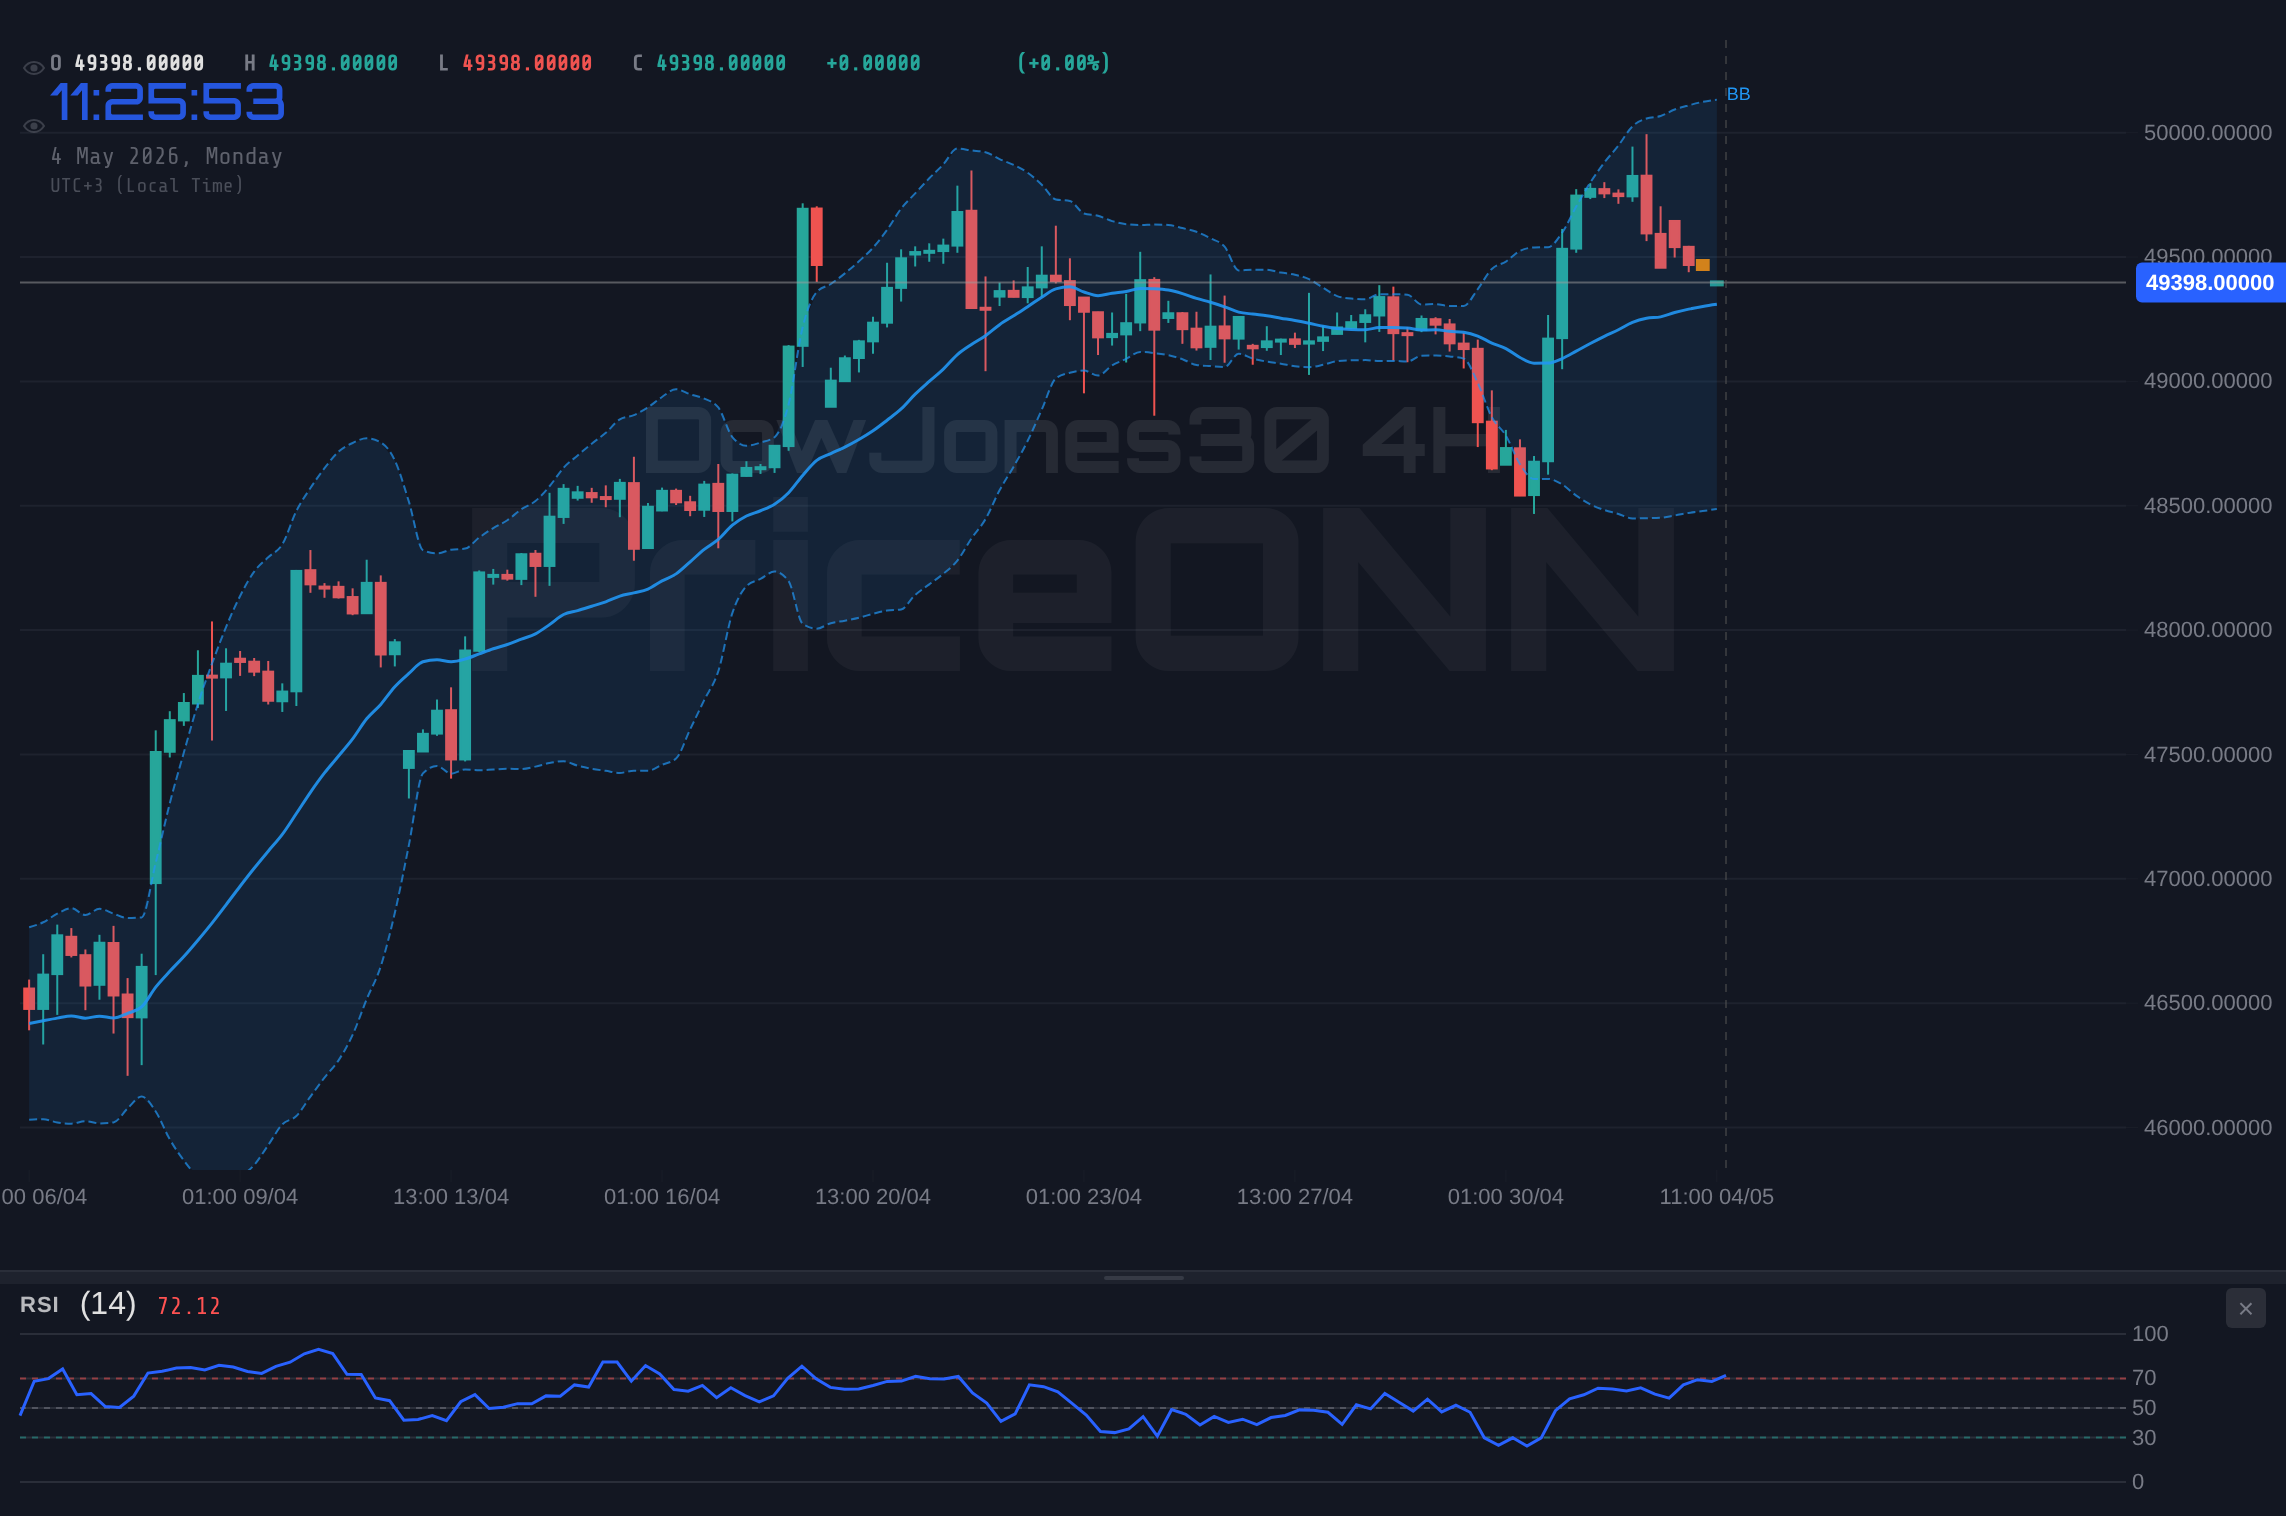
Examining the hourly and 4-hourly timeframes provides additional insights. On the 1H chart, the RSI stands at 36.82, while the MACD also shows negative momentum, reinforcing the short-term bearish outlook. The ADX is at 19.63, indicating a weak trend in the short term. The 4H chart presents a similar picture, with an RSI of 37.64 and negative MACD momentum. The ADX on the 4H chart is at 24, suggesting a moderate downtrend. These shorter-term timeframes align with the daily chart, confirming that the DowJones30 is facing bearish headwinds across multiple time horizons.
Furthermore, the broader market context plays a crucial role. The DXY (Dollar Index) is currently trading at 100.2, showing a daily increase of 0.8%. A stronger dollar typically puts pressure on equities, including the DowJones30. This inverse correlation is evident in the current market environment, where the rising DXY is contributing to the downward pressure on the Dow. Risk appetite is also declining, as reflected in the SP500's daily change of -0.81% and the Nasdaq100's daily change of -0.85%. This risk-off sentiment further supports the demand for safe-haven assets and puts pressure on riskier assets like equities.
The energy sector is experiencing notable movements, with Brent crude oil trading at $103.82 and WTI crude oil at $99.18. These elevated oil prices contribute to inflationary pressures, which could prompt the Federal Reserve to maintain its hawkish stance. The DowJones30 is sensitive to interest rate expectations, and any indication of continued rate hikes could further weigh on the index. According to recent news, tensions in the Middle East are escalating, potentially disrupting global oil supply chains. This geopolitical risk is adding to the inflationary pressures and creating additional uncertainty for the DowJones30.
The economic calendar is relatively quiet today, but next week is packed with high-impact events. While no specific events are listed with actuals on 2026-03-11 (Wednesday) or 2026-03-13 (Friday), the market will be keenly focused on any news regarding inflation and employment. These data releases could significantly influence the Federal Reserve's policy decisions and, consequently, the DowJones30's performance. The upcoming CPI data will be a key catalyst, providing insights into the trajectory of inflation and potentially shaping market expectations for future rate hikes. If the CPI data comes in higher than expected, it could reinforce the bearish sentiment and lead to further declines in the DowJones30.
Given the current technical and fundamental backdrop, a neutral stance seems prudent. The bearish momentum is evident across multiple timeframes, and the rising DXY is adding to the downward pressure. While the oversold RSI might suggest a potential bounce, it is not a reliable signal on its own. Investors should closely monitor the key support levels and wait for a confirmed breakout above the resistance levels before considering any long positions. On the other hand, short positions should be approached with caution, given the oversold conditions and the potential for a short squeeze.
DowJones30 today analysis reveals a confluence of bearish signals. The last Friday close at $46,502.50 reflects the culmination of a week of steady decline. Key levels to watch include the immediate support at 46,485.67 and resistance at 47,145.67. A decisive break of either level will likely dictate the next direction of the index. In the meantime, it’s important to monitor the economic data releases next week, particularly the CPI data, which will likely play a key role in shaping market expectations. The DowJones30 is in a precarious position, and a careful approach is warranted.
Frequently Asked Questions: DowJones30 Analysis
What happens if DowJones30 breaks below $46,485.67 support?
If DowJones30 decisively breaks below the $46,485.67 support level, it could trigger further selling pressure and lead to a test of the subsequent support levels at 46,243.33 and 45,825.67. This breakdown would confirm the prevailing bearish trend and potentially open the door for more significant declines.
Should I buy DowJones30 at current levels of $46,502.50 given the RSI at 27.44?
While the RSI at 27.44 indicates oversold conditions, it is not a standalone buy signal. The bearish MACD and ADX suggest that the downtrend remains intact. A more prudent approach would be to wait for confirmation of a trend reversal before considering long positions, such as a breakout above the 47,145.67 resistance level.
Is the negative MACD histogram a reliable signal for DowJones30 trend analysis?
The negative MACD histogram is a reliable indicator of bearish momentum. It confirms that selling pressure is still prevalent and that the downtrend is likely to continue until the MACD line crosses above the signal line. Traders should use it in conjunction with other indicators and price action to confirm their trading decisions.
How will the upcoming CPI data affect DowJones30 this week?
The upcoming CPI data will be a key catalyst for the DowJones30. Higher-than-expected CPI data could reinforce the bearish sentiment, as it would suggest that the Federal Reserve is likely to maintain its hawkish stance. This could lead to further declines in the index, as investors price in the possibility of continued rate hikes.
Volatility creates opportunity- those prepared will be rewarded. Markets are cyclical; every downturn plants seeds for the next rally. Patient investors always find opportunities- the key is waiting for the right moment. The key is disciplined risk management.
Technical Outlook Summary
| Indicator | Value | Signal |
|---|---|---|
| RSI (14) | 27.44 | Oversold |
| MACD Histogram | Negative | Bearish |
| Stochastic | 19.19 | Oversold |
| ADX | 34.71 | Strong Downtrend |
| Bollinger | Lower Band | Watch |
Key Levels
Support Levels
Resistance Levels
Track markets in real-time
AI-powered analysis, technical indicators and real-time price data.
Join Our Telegram Channel
Breaking market news, AI analysis and trading signals instantly.
Join Channel