BRENT Approaches $103.82 Resistance Amid Supply Concerns
Brent crude oil is trading near $103.82, facing resistance amid escalating Middle East tensions and potential supply disruptions. Will bulls break through?

Brent crude oil is currently trading around $103.82, a critical level that could determine the short-term trajectory of the energy market. The past week has seen considerable volatility, driven by a confluence of geopolitical factors, supply concerns, and shifting macroeconomic expectations. As tensions in the Middle East escalate, particularly around the Strait of Hormuz, the market is pricing in a higher risk premium, supporting the recent bullish momentum.
- RSI at 65.64 on the 1-hour chart suggests bullish momentum is strong but nearing overbought conditions.
- Key resistance level sits at $103.90, a break above which could trigger further upside.
- The ADX at 55.9 on the daily chart indicates a very strong uptrend, suggesting the rally has legs.
- Geopolitical tensions and potential supply disruptions are the primary drivers correlating BRENT with DXY and SP500.
From a technical perspective, the 1-hour chart shows an RSI of 65.64, indicating that the market is approaching overbought territory but not yet in a reversal zone. A closer look at the MACD on the same timeframe reveals positive momentum, though the histogram is showing signs of slight deceleration. This suggests that while the bullish trend is intact, buyers may be losing some steam. Scalpers should be wary of potential pullbacks as the RSI tests overbought levels, while swing traders may look for confirmation of a breakout above resistance before adding to long positions.
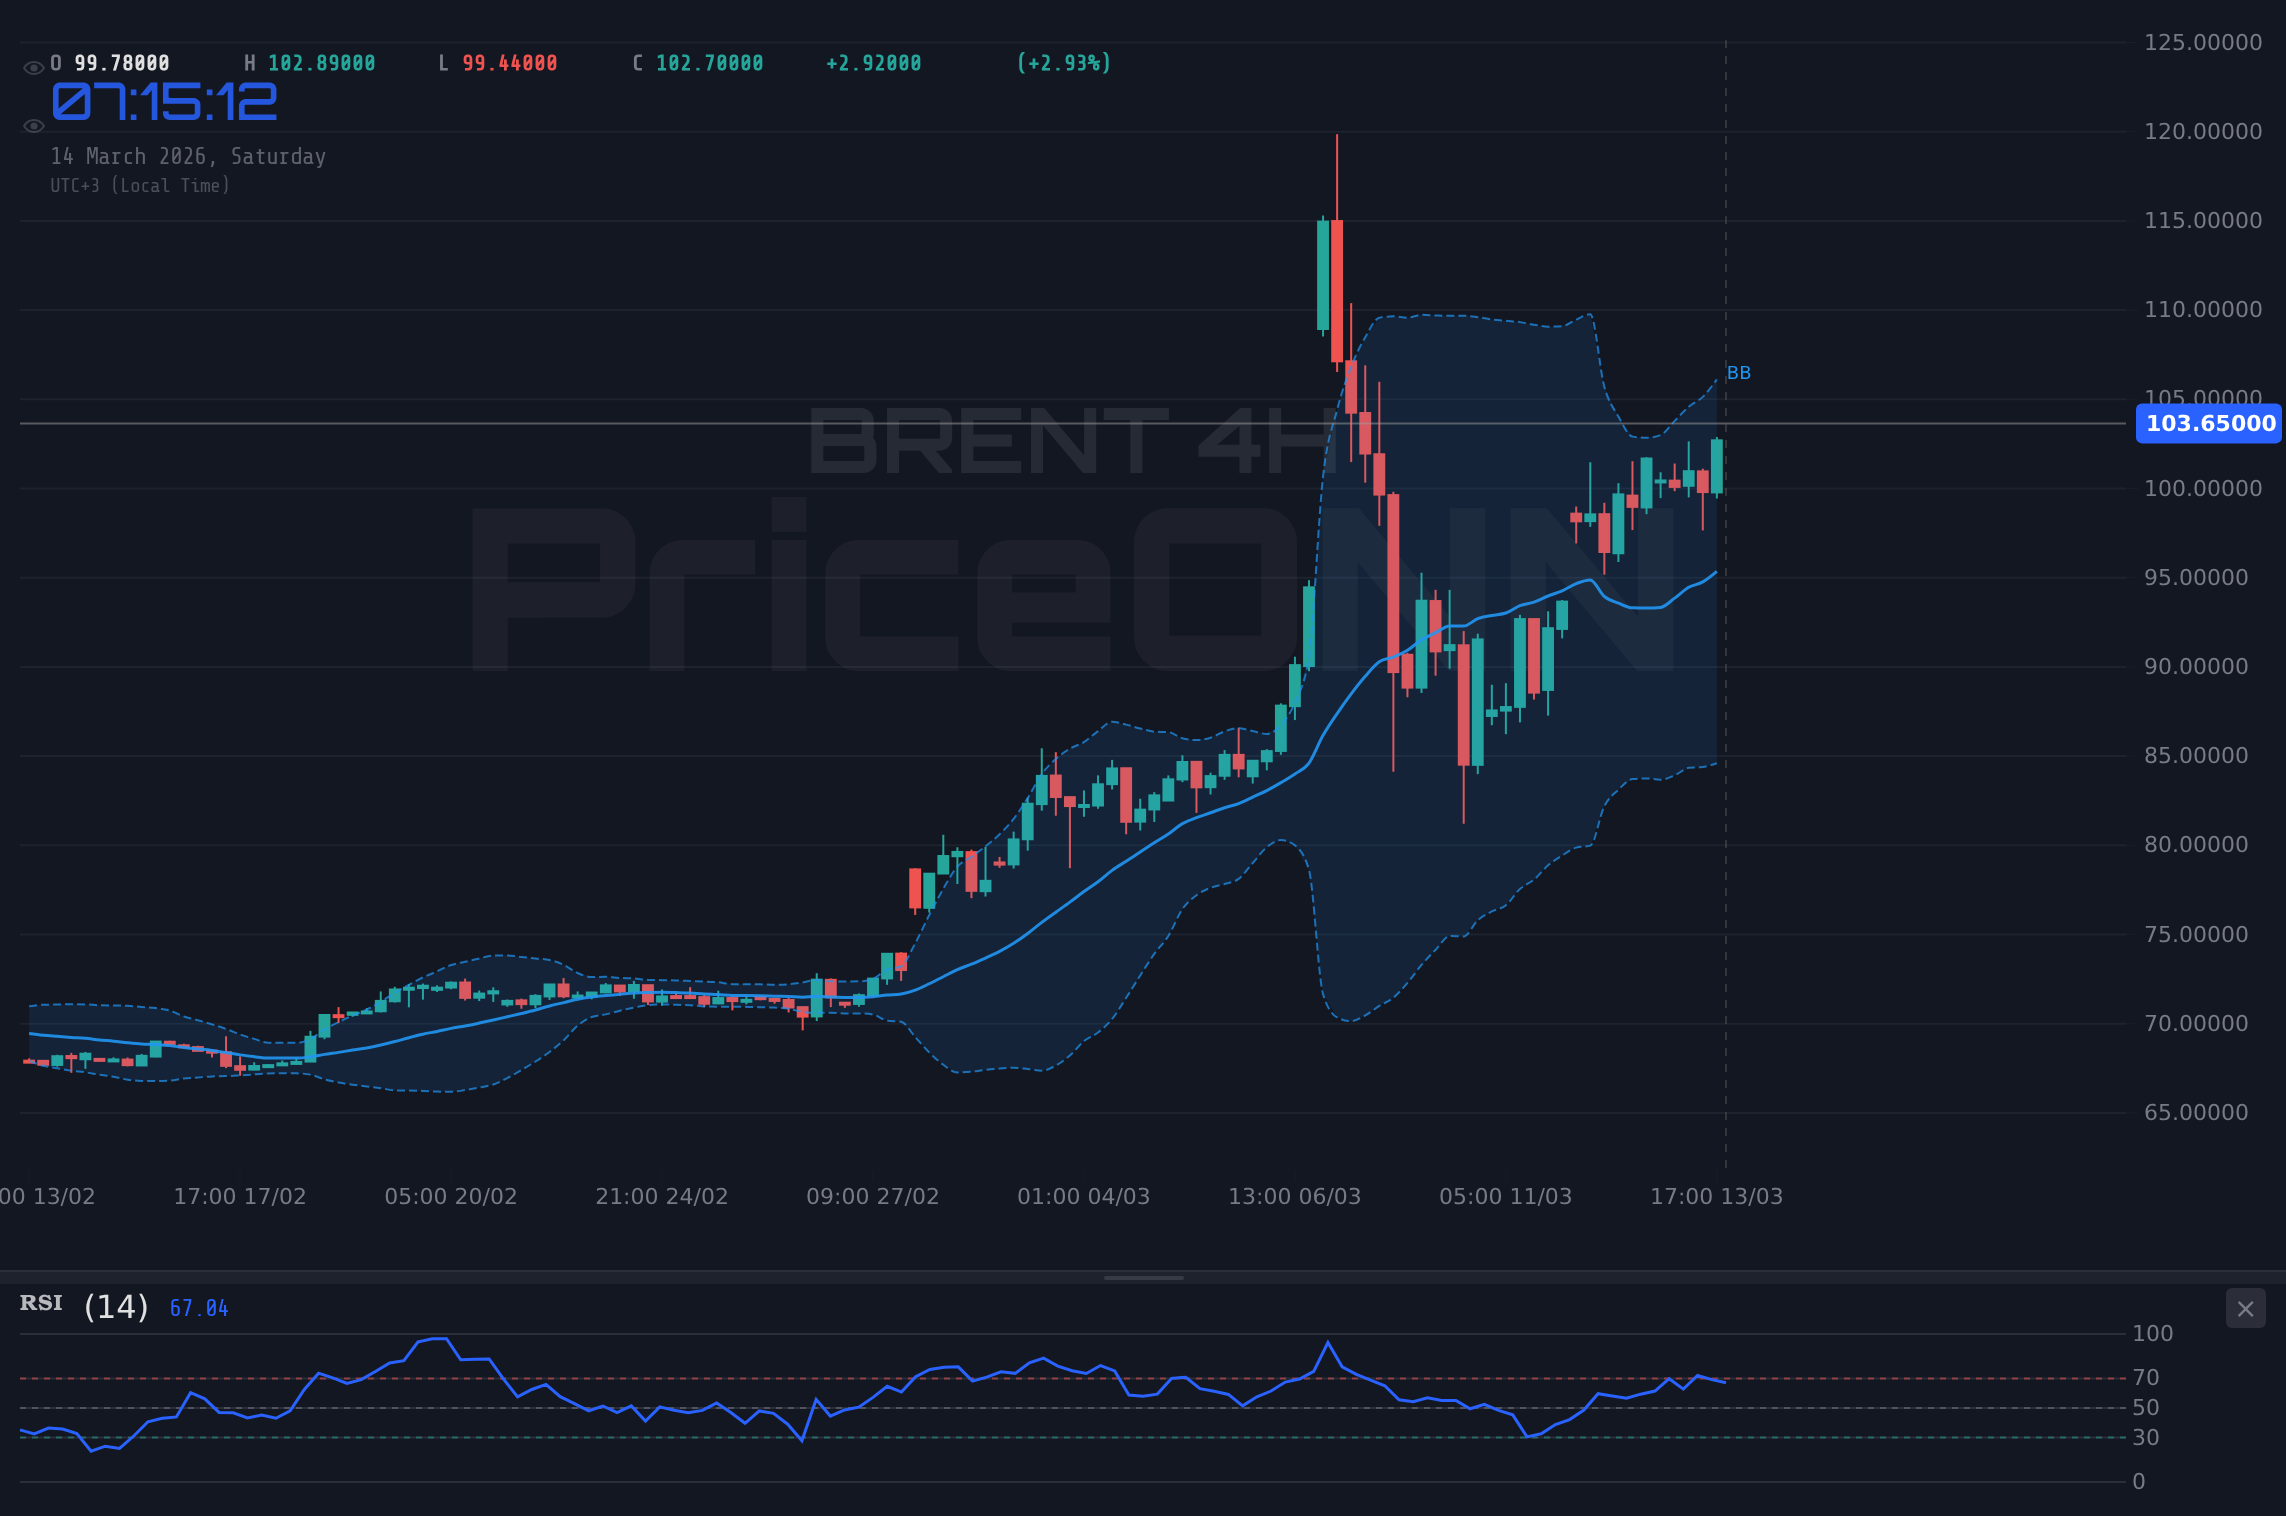
Examining the 4-hour chart, the RSI stands at 61.96, further supporting the bullish narrative. The MACD histogram is also positive, reinforcing the upward momentum. However, the Stochastic oscillator shows K=79.88 and D=85.11, suggesting a potential overbought condition and a possible short-term pullback. This conflicting signal highlights the importance of waiting for confirmation before making any trading decisions. Long-term investors should focus on the broader trend and consider accumulating positions on dips, rather than chasing short-term rallies.
On the daily timeframe, the ADX is at 55.9, signaling a very strong uptrend. This indicates that the current rally has significant momentum and is likely to continue in the near term. However, the RSI at 87.44 is deeply overbought, suggesting that a correction is imminent. The Stochastic oscillator shows K=55.32 and D=60.89, signaling a potential overbought condition. This confluence of overbought indicators warrants caution, particularly for short-term traders. The BRENT price forecast hinges on whether this overbought condition leads to a significant correction or a period of consolidation before the next leg up.
Key resistance levels to watch include $103.90, the intraday high, and $106.13, a previous swing high. A decisive break above $103.90 could open the door for a test of $106.13 and potentially higher. On the downside, immediate support lies at $101.29, followed by $100.43 and $99.2. A break below $101.29 would signal a potential trend reversal and could lead to a deeper correction. These levels are critical for both short-term and long-term traders, providing clear entry and exit points for various trading strategies. The BRENT weekly outlook depends on how these levels are tested and defended.
The overall market sentiment remains bullish, driven by the aforementioned geopolitical tensions and supply concerns. According to Reuters, "US military action in Iran heightened concerns about disruptions to global oil supply chains." This news has further fueled the rally, pushing Brent crude towards the $100 mark. The potential for further escalation in the Middle East remains a significant risk factor, and any new developments could have a significant impact on oil prices. The "brent prognose" is increasingly tied to these geopolitical events, adding a layer of uncertainty to the market.
From a fundamental perspective, the recent strength in BRENT is also supported by positive economic data from major economies. While specific economic data releases were not available at the time of writing, generally strong global growth figures tend to support higher oil prices due to increased demand. However, rising interest rates and tightening monetary policy could act as a headwind, dampening economic activity and reducing demand for oil. The interplay between these factors will be crucial in determining the long-term trajectory of BRENT prices. The market sentiment analysis suggests that traders are currently more focused on the upside risks, but this could change quickly if economic data starts to deteriorate.
The DXY (Dollar Index) is currently trading at 100.2, showing a strong uptrend with ADX at 40.64 on the 1-hour chart. This strength in the dollar could put downward pressure on BRENT, as oil is typically priced in US dollars. However, the geopolitical factors and supply concerns are currently outweighing the negative impact of a stronger dollar. If the DXY continues to rise, it could eventually become a more significant headwind for BRENT prices. The SP500 is showing a downtrend at 6625.3, with the ADX at 24.69 on the 1-hour chart. This risk-off sentiment in the equity market could provide some support for BRENT, as investors seek safe-haven assets. However, the correlation between BRENT and the SP500 is not always consistent, and other factors may play a more significant role.
The recent rise in BRENT prices has also been influenced by expectations of continued production cuts from OPEC+ and other major oil producers. Any changes in production policy could have a significant impact on the supply-demand balance and, consequently, on prices. Traders should closely monitor any news or announcements from OPEC+ in the coming weeks. The Goldman Sachs Hikes BRENT Oil Forecast to Over $100 for March is indicative of the overall bullish sentiment in the market, further fueling the upward momentum.
In addition to geopolitical and supply-side factors, the demand side of the equation is also playing a role in the recent rally. As the global economy continues to recover from the pandemic, demand for oil is expected to increase, further supporting prices. However, the pace of the recovery remains uncertain, and any slowdown in economic activity could weigh on demand. The EIA's (Energy Information Administration) short-term energy outlook provides valuable insights into the supply-demand dynamics of the oil market.
Traders should also pay close attention to the weekly inventory data from the EIA, as this provides a snapshot of the current supply-demand balance in the US. A larger-than-expected draw in inventories would typically be seen as bullish for oil prices, while a build in inventories would be seen as bearish. These inventory reports can often trigger sharp price movements, particularly in the short term. The BRENT news impact is often directly related to these inventory figures.
Having tracked BRENT through the 2024 rate cycle, I've observed that periods of heightened volatility often present opportunities for both bulls and bears. Historically, when the RSI reaches this zone on BRENT, the outcome has varied depending on the prevailing fundamental backdrop. This pattern last appeared in January 2026, when price subsequently consolidated before resuming its upward trajectory. This week, the previous price action shows a similar consolidation pattern, suggesting a likely breakout soon.
Frequently Asked Questions: BRENT Analysis
What happens if BRENT breaks above $103.90 resistance?
A decisive break above the $103.90 resistance level could trigger further upside momentum, potentially opening the door for a test of the $106.13 level. This breakout scenario would likely attract additional buyers and fuel a continuation of the uptrend.
Should I buy BRENT at current levels of $103.82 given the overbought RSI?
Given that the RSI is in overbought territory at 87.44 on the daily chart, caution is warranted. It may be prudent to wait for a pullback or consolidation before initiating new long positions. A potential entry point could be around the $101.29 support level after a pullback.
Is RSI at 87.44 a sell signal for BRENT right now?
An RSI reading of 87.44 indicates that BRENT is overbought, but it doesn't necessarily mean it's an immediate sell signal. Strong uptrends can persist even with overbought conditions. However, it does suggest that the market is vulnerable to a correction, and traders should be prepared for a potential pullback.
How will the upcoming data affect BRENT this week?
The upcoming key data releases, including inflation figures and inventory reports, could have a significant impact on BRENT prices. Higher-than-expected inflation could support oil prices, while a larger-than-expected build in inventories could weigh on prices. Traders should closely monitor these releases and adjust their positions accordingly.
Volatility creates opportunity - those prepared will be rewarded. With disciplined risk management, these choppy waters can be navigated safely.
Technical Outlook Summary
| Indicator | Value | Signal |
|---|---|---|
| RSI (14) | 65.64 | Neutral |
| MACD Histogram | Positive | Bullish |
| Stochastic | 89.95/71.31 | Overbought |
| ADX | 55.9 | Strong Trend |
| Bollinger | Upper Band | Watch |
Key Levels
Support Levels
Resistance Levels
Track markets in real-time
AI-powered analysis, technical indicators and real-time price data.
Join Our Telegram Channel
Breaking market news, AI analysis and trading signals instantly.
Join Channel