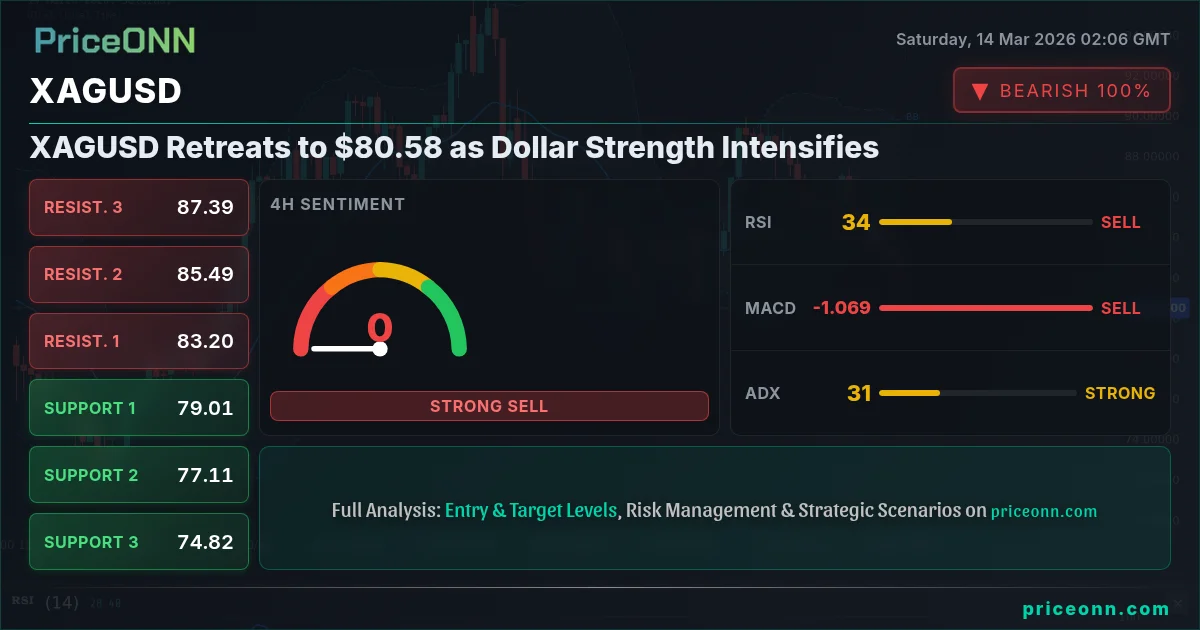
As geopolitical tensions in the Middle East escalate, and with the US Dollar Index (DXY) nearing 10-month highs at 100.2, silver (XAGUSD) finds itself under pressure, retreating to $80.58. The combination of a strengthening dollar and risk-off sentiment is weighing on the precious metal as traders brace for important US economic data releases next week.
- XAGUSD slides to $80.58, pressured by a strengthening dollar index at 100.2.
- Key support level identified at $80.32, a break below could trigger further selling.
- The 1-hour RSI at 33.11 indicates potential for a short-term bounce, but the overall trend remains bearish.
- Traders eye upcoming US CPI data next week, which could significantly impact dollar strength and silver prices.
This week's pullback in silver prices reflects a broader market dynamic where safe-haven demand is being diverted towards the US dollar amid escalating geopolitical risks. According to Reuters, uncertainty surrounding the Middle East conflict is prompting investors to seek refuge in the greenback, driving the Dollar Index higher and consequently, putting downward pressure on commodities like silver. The current silver price XAG/USD reflects this current environment.
The dollar's strength is not solely driven by safe-haven flows. Expectations of continued hawkishness from the Federal Reserve are also playing a significant role. With the latest inflation data showing stickiness in price pressures, markets are pricing in a higher probability of the Fed maintaining its restrictive monetary policy stance for longer. This has led to a surge in Treasury yields, further bolstering the dollar's appeal. The current silver price XAG/USD march 2 2026 is certainly impacted.
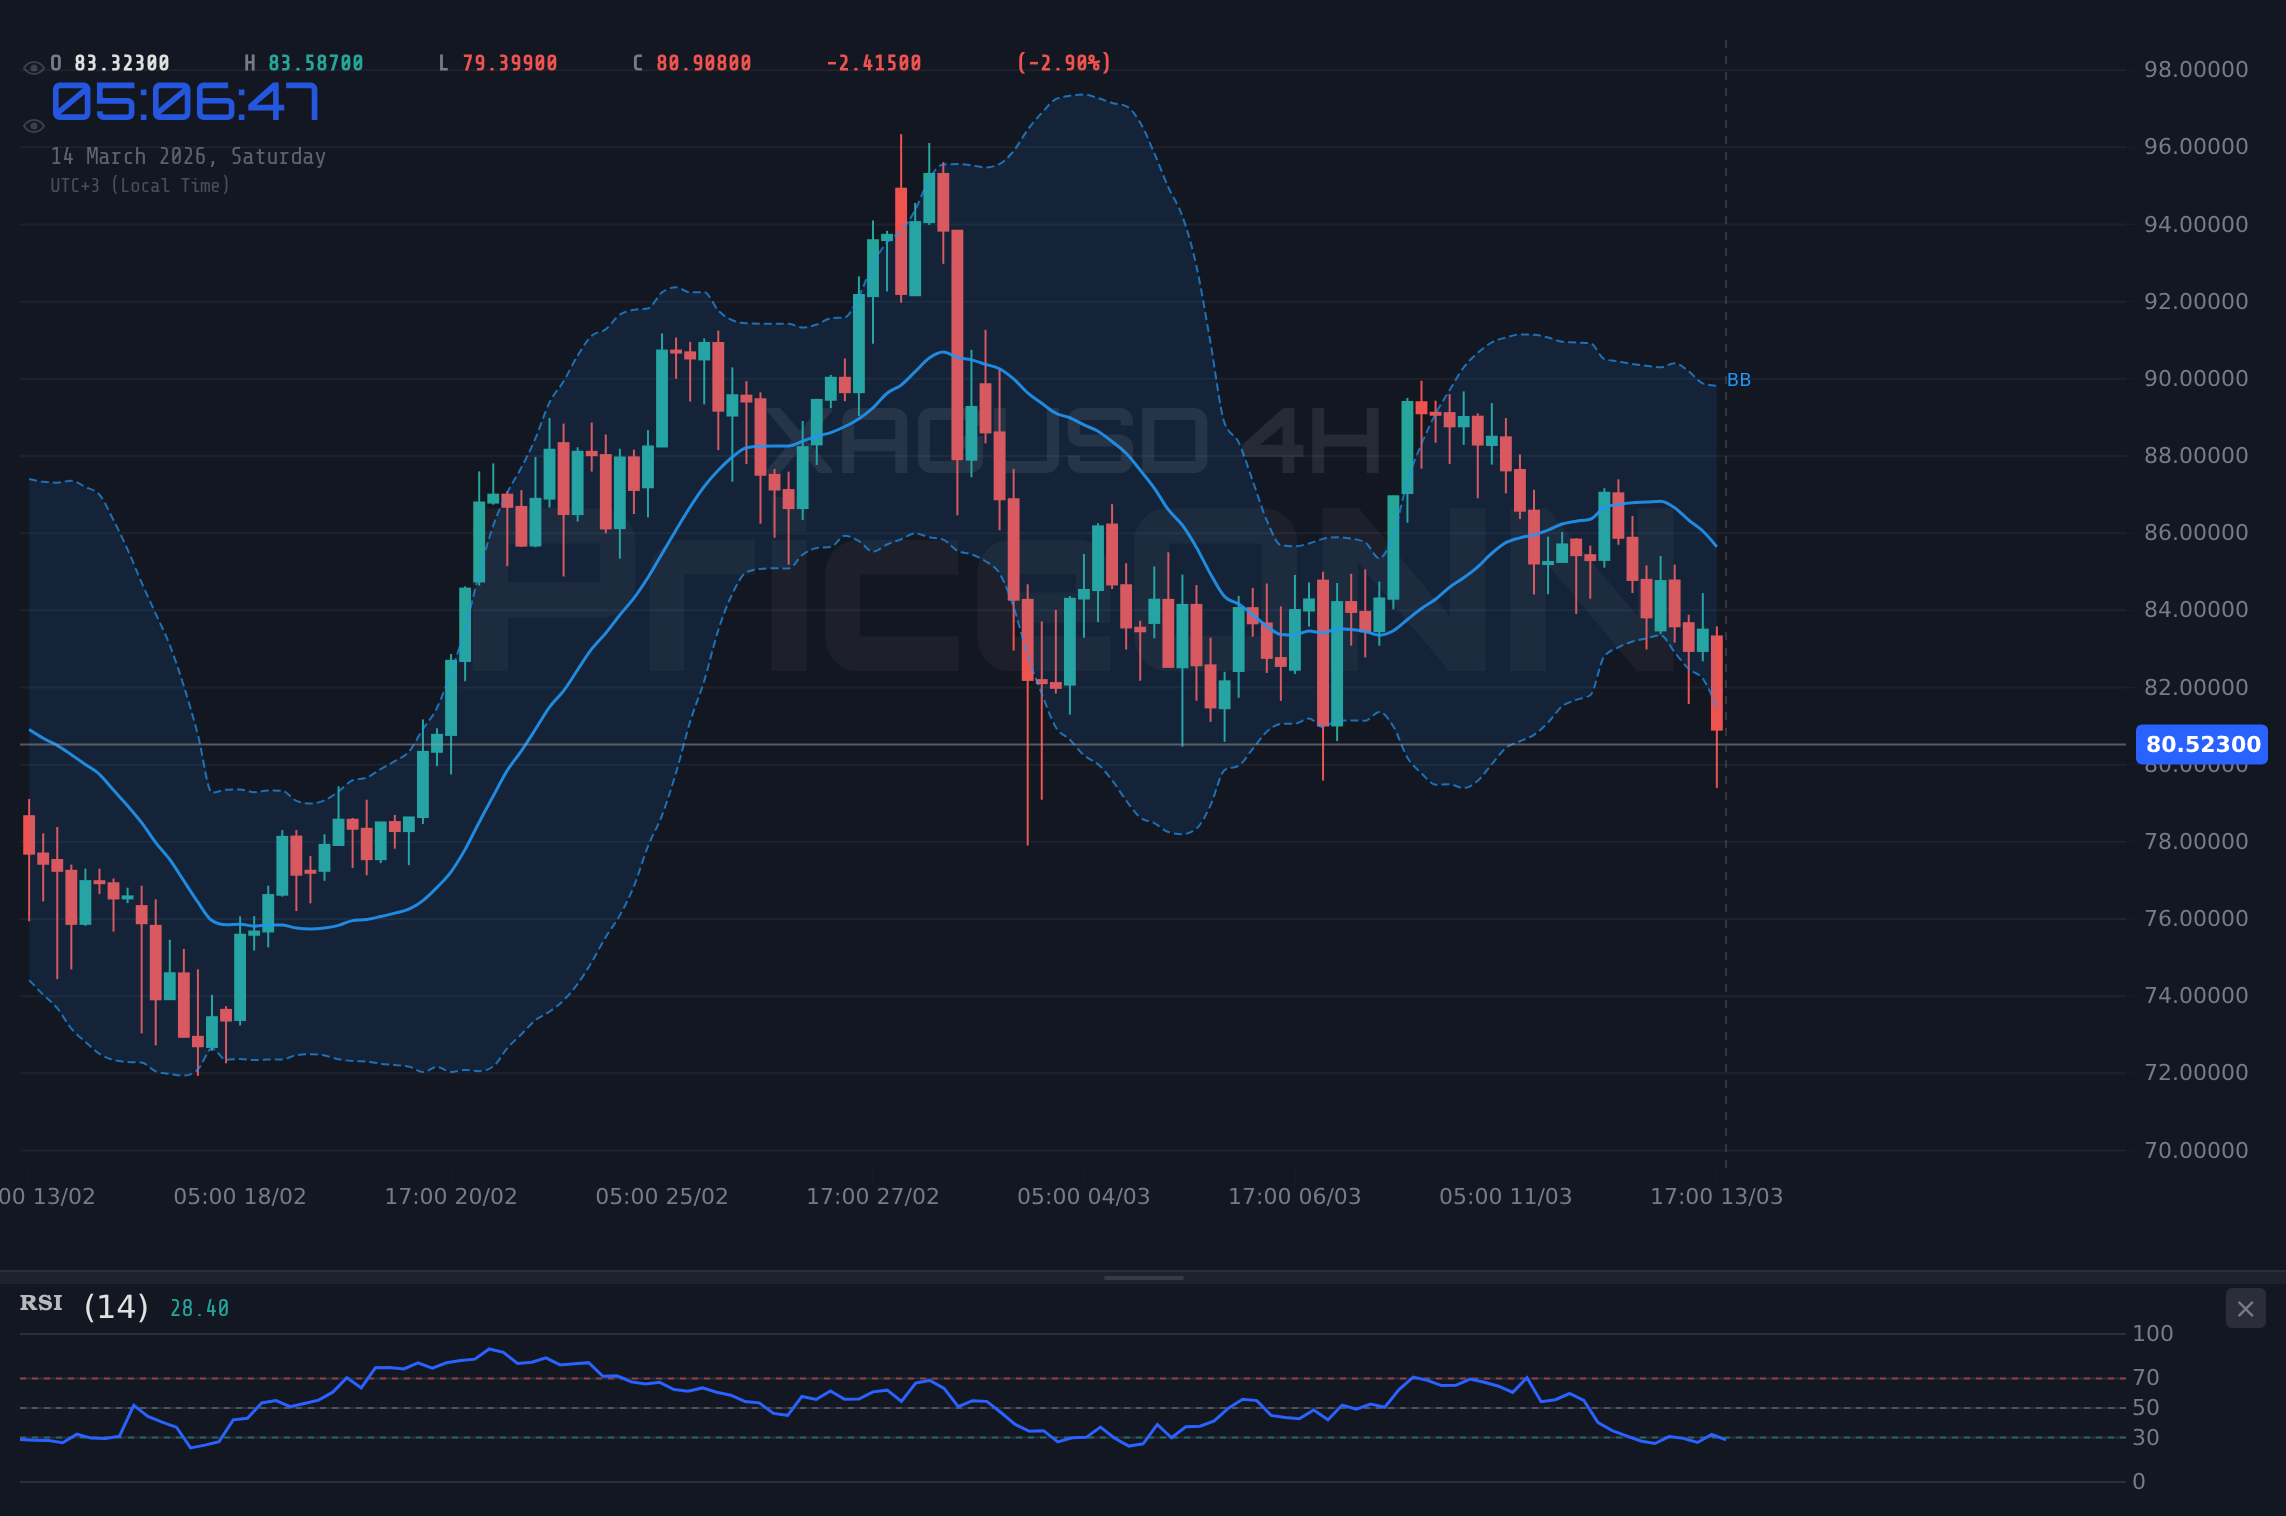
From a technical perspective, XAGUSD's decline below $81 has confirmed a bearish breakout, opening the door for further losses. The 1-hour chart shows a strong downtrend, with the price trading below the 200-period moving average. The ADX indicator at 40.31 suggests that the downtrend is strong, further reinforcing the bearish bias. While the RSI at 33.11 indicates that the market is approaching oversold conditions, this may only lead to a temporary bounce rather than a sustained recovery.
Key Events and Developments from Last Week
Last week was marked by a series of events that contributed to the current bearish outlook for XAGUSD. The initial trigger was the release of stronger-than-expected US employment data, which dampened expectations of an imminent Fed rate cut. This led to a surge in the dollar and a corresponding sell-off in silver. The subsequent escalation of geopolitical tensions in the Middle East further exacerbated the situation, as investors sought refuge in the dollar rather than precious metals. Silver prices are under pressure, falling below $81 as the U.S. Dollar Index reaches a four-month high. Traders are watching closely.
According to PriceONN market news, silver slides below $81 as US Dollar Index hits a nearly four-month high. This headline encapsulates the key driver behind the recent weakness in silver prices. The inverse correlation between the dollar and silver has been particularly strong in recent weeks, with any gains in the greenback translating into losses for the precious metal. Silver's volatile run continues.
Also, silver defended $85 as traders eye US Economic Data. However, the support was not strong enough. Last Friday, XAGUSD closed near $80.58.
The daily chart also confirms the bearish trend, with the Stochastic indicator (K=31.46, D=39.41) signaling further downside momentum. The MACD histogram is also negative, indicating that selling pressure is intensifying.
Technical Levels Broken or Held This Week
Throughout the week, XAGUSD broke several key support levels, confirming the bearish trend. The initial breach was below the $82.07 support, which triggered a wave of selling. The price then tested the $80.32 level, which is now acting as immediate support. A break below this level could lead to a further decline towards the $77.66 support. On the upside, the $86.48 level is now acting as a strong resistance, and any attempt to rally above this level is likely to be met with selling pressure.
The 4H chart shows that the price is trading below the lower Bollinger Band, indicating that the market is oversold. The RSI indicator is at 33.84, suggesting that the market is approaching oversold conditions. However, the ADX indicator is at 29.13, indicating that the downtrend is still strong. This suggests that any attempt to rally is likely to be short-lived. The 1H chart shows RSI at 33.11.
The current silver price xag/usd reflects the current environment. The falling silver price extends its volatile run.
Next Week Expectations, Key Events, and Levels to Watch
Looking ahead, next week will be crucial for XAGUSD as several key economic data releases are scheduled, including the US CPI data. A stronger-than-expected CPI reading could further bolster the dollar and exacerbate the downward pressure on silver. Conversely, a weaker-than-expected reading could trigger a relief rally in silver. However, the overall trend is likely to remain bearish as long as the dollar remains strong and geopolitical tensions persist.
The key levels to watch next week are the $80.32 support and the $86.48 resistance. A break below the support could lead to a further decline towards the $77.66 level, while a break above the resistance could trigger a rally towards the $89.14 level. Traders should also pay close attention to the DXY, as any further gains in the dollar are likely to weigh on silver. The general signal for XAGUSD is currently a sell.
According to recent breaking news, the Dollar Index Nears 10-Month Highs as Middle East Conflict Intensifies. This is a key factor to watch as the DXY has an inverse correlation with silver. With the DXY at 100.2, XAGUSD is under pressure. The current silver price xagusd march 2 2026 is likely to be impacted by the events next week.
On March 13 (Friday), several USD events were released, which have impacted the current price of XAGUSD. Next week, the EUR and USD events are scheduled for March 11 (Wednesday).
The general signal for XAGUSD on the 1H, 4H and 1D timeframes is a sell. Silver slides below $81 as dollar strength persists.
Frequently Asked Questions: XAGUSD Analysis
What happens if XAGUSD breaks below $80.32 support?
If XAGUSD breaks below the $80.32 support, it could trigger further selling pressure, potentially leading to a decline towards the $77.66 level. This scenario is supported by the strong downtrend observed on the 1-hour chart and the negative MACD histogram.
Should I sell XAGUSD at current levels of $80.58 given the rising DXY?
Given the rising DXY and the bearish technical outlook, selling XAGUSD at current levels could be a viable strategy. However, traders should exercise caution and implement appropriate risk management measures, such as setting a stop-loss order above the $86.48 resistance level.
Is the RSI at 33.11 on the 1-hour chart a buy signal for XAGUSD right now?
While the RSI at 33.11 on the 1-hour chart indicates that XAGUSD is approaching oversold conditions, it is not necessarily a buy signal. The overall trend remains bearish, and any potential rally is likely to be short-lived. Traders should wait for further confirmation before initiating a long position.
How will the US CPI data next week affect XAGUSD?
The US CPI data next week could have a significant impact on XAGUSD. A stronger-than-expected reading could further bolster the dollar and exacerbate the downward pressure on silver, while a weaker-than-expected reading could trigger a relief rally in silver. Traders should closely monitor the data release and adjust their positions accordingly.
Technical Outlook Summary
| Indicator | Value | Signal |
|---|---|---|
| RSI (14) | 33.11 | Neutral |
| MACD Histogram | Negative | Bearish |
| Stochastic | 28.08/24.91 | Bullish |
| ADX | 40.31 | Strong Downtrend |
| Bollinger | Middle Band | Bearish |
Key Levels
Support Levels
Resistance Levels
Track markets in real-time
AI-powered analysis, technical indicators and real-time price data.
Join Our Telegram Channel
Breaking market news, AI analysis and trading signals instantly.
Join Channel