WTI Rallies to $99.18 Amid Supply Concerns; CPI Data Looms
WTI crude oil reaches $99.18 as Middle East tensions and Saudi Arabia's output cut fuel supply concerns. Investors await key CPI data for further direction.
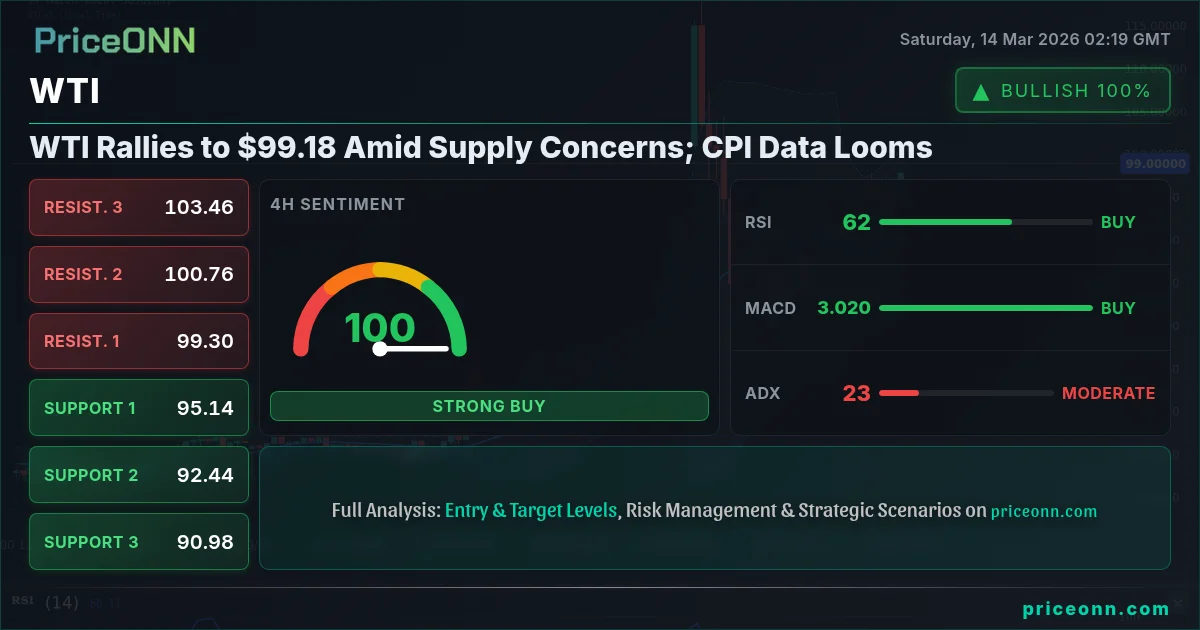
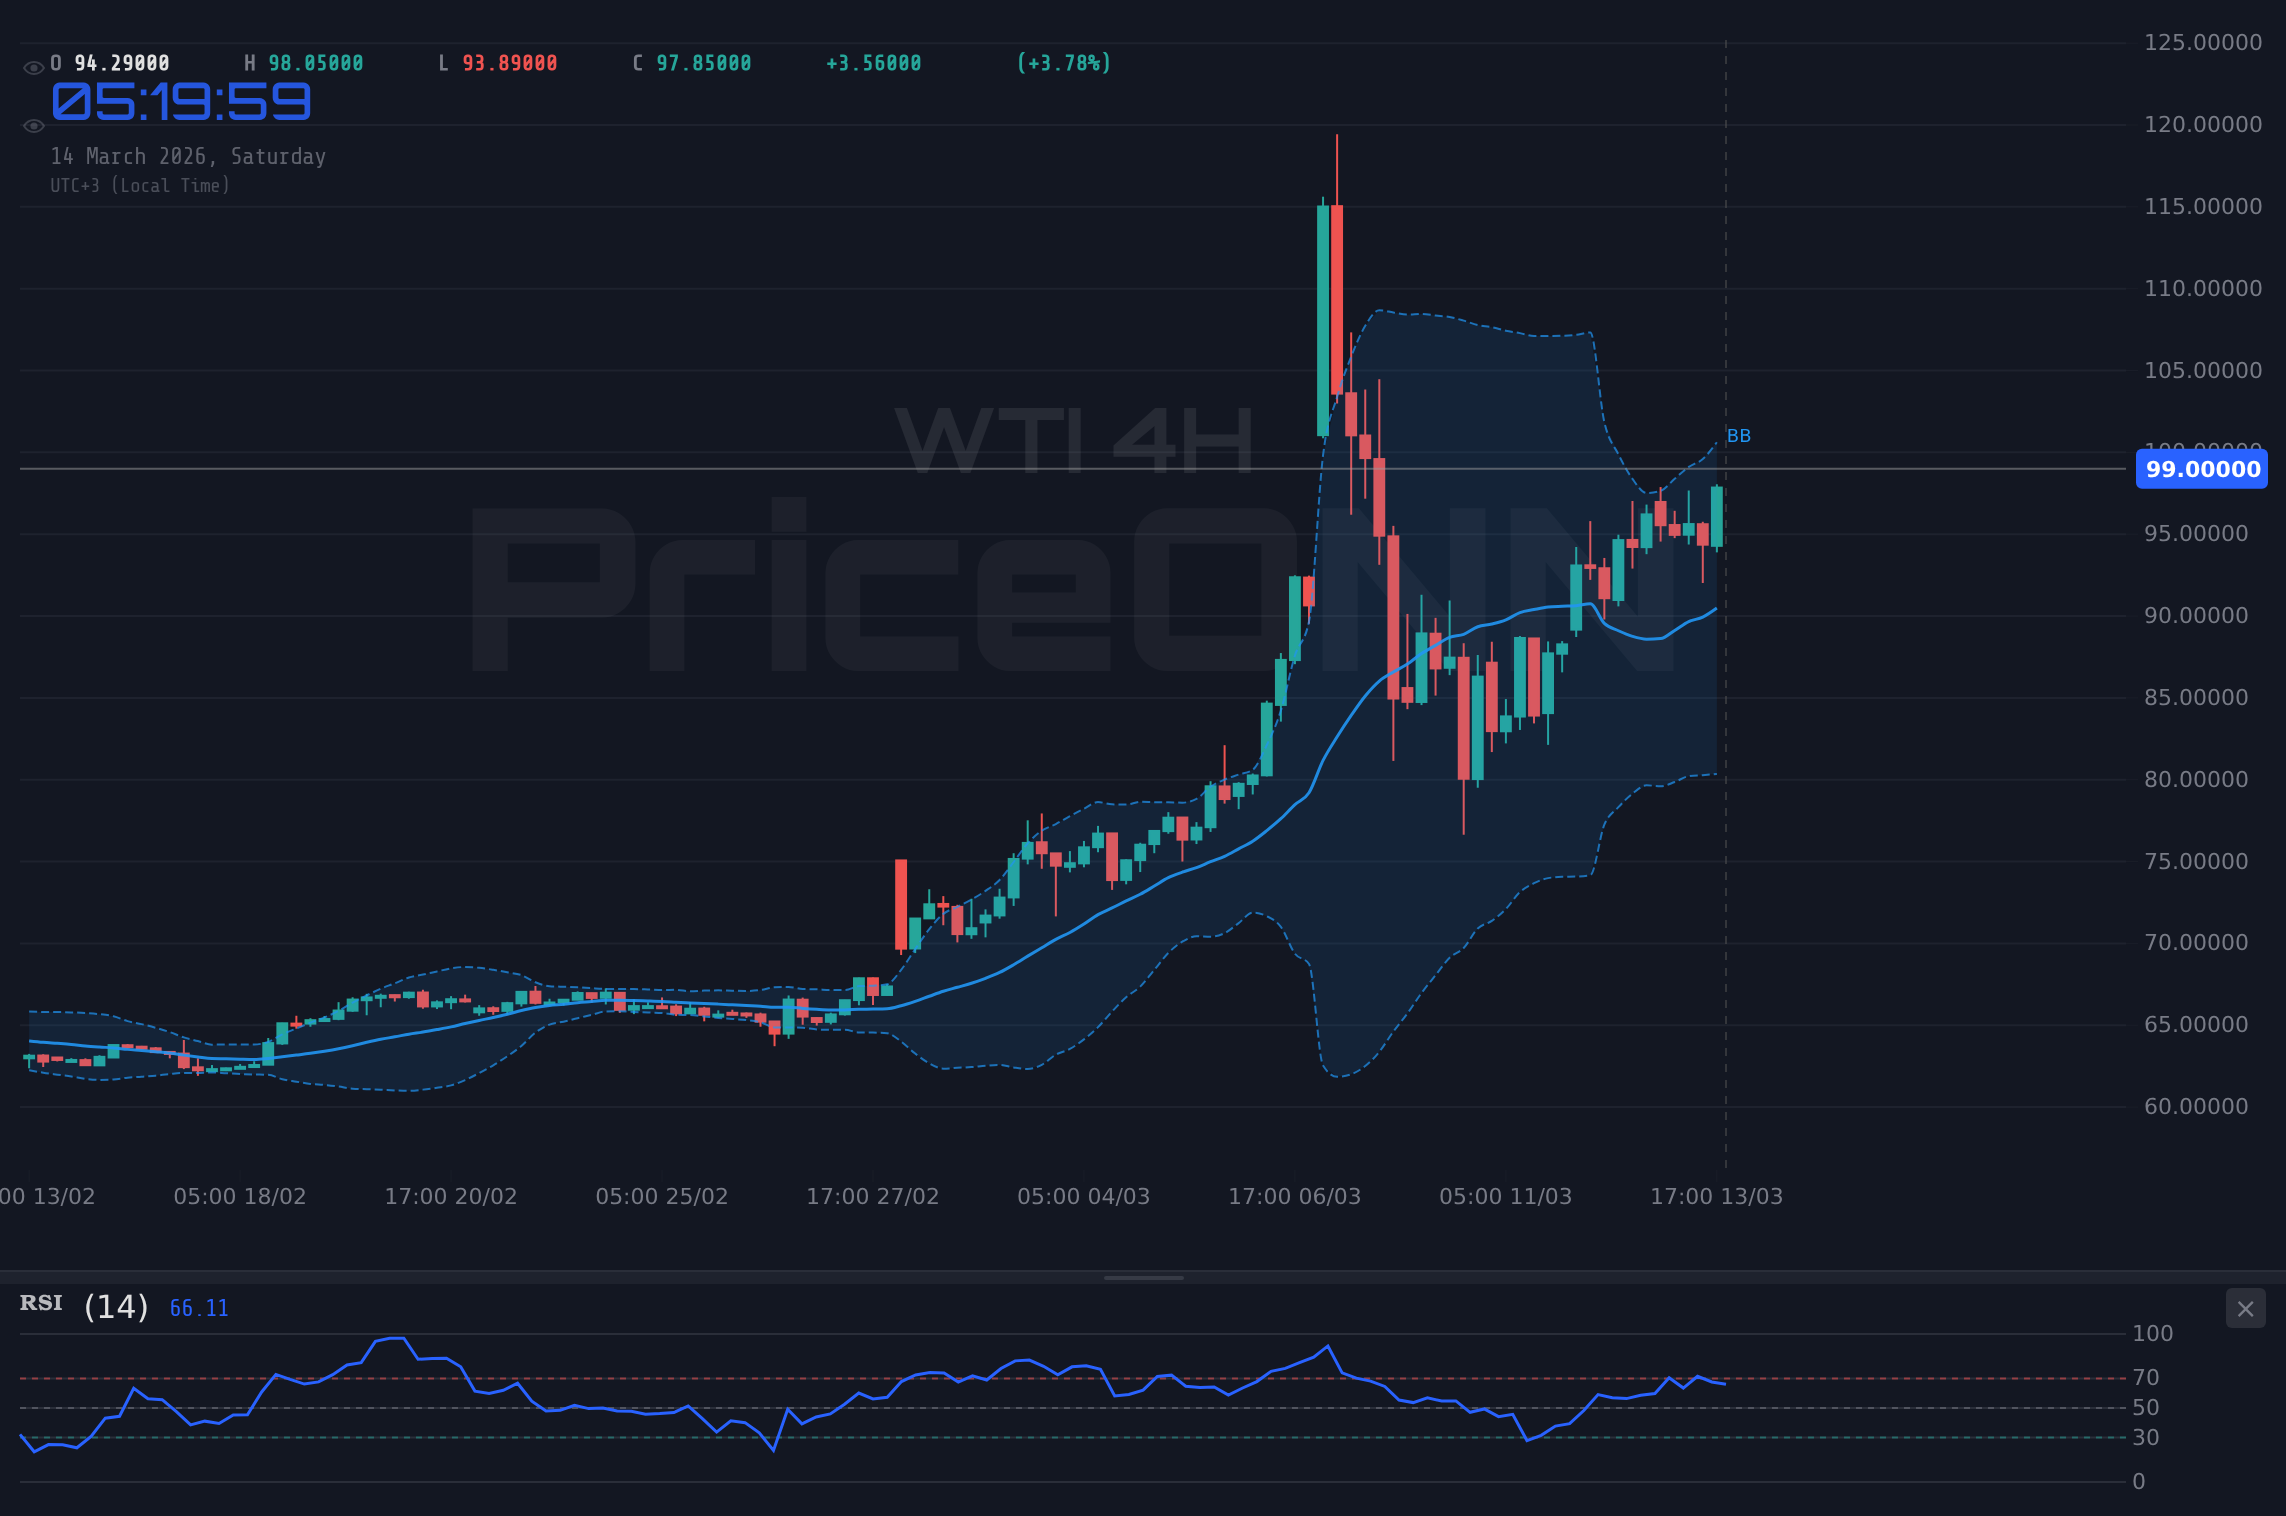
WTI crude oil has been on a bullish run, closing last Friday at $99.18, fueled by escalating geopolitical tensions and a significant supply disruption. The market is now bracing for the upcoming CPI data, which could either reinforce the bullish momentum or trigger a sharp reversal. The current environment is a complex interplay of fundamental factors and technical signals, demanding a nuanced approach from traders.
- WTI crude oil closed last Friday at $99.18, driven by supply concerns and geopolitical tensions.
- The 1-day RSI at 82.87 suggests overbought conditions, potentially leading to a pullback.
- Strong support sits at $90.94, while resistance is tested at $99.25.
- Upcoming CPI data could significantly impact WTI's trajectory, influencing inflation expectations.
Geopolitical Risks and Supply Dynamics
The recent surge in WTI prices can be largely attributed to escalating tensions in the Middle East. As PriceONN reported on March 13, Brent crude is nearing $100 a barrel amid rising tensions in the Strait of Hormuz. These tensions have raised concerns about potential disruptions to oil supply, particularly given the strategic importance of the Strait of Hormuz as a major transit route for oil tankers. The market is highly sensitive to any news that could further destabilize the region, as highlighted by the recent Saudi Arabia production cut. According to news reports from March 13, Saudi Arabia slashed production by 20% due to ongoing conflict in the Persian Gulf, further exacerbating supply concerns. This move, coupled with existing geopolitical uncertainties, has created a perfect storm for higher oil prices.
Economic Data and Inflation Expectations
The upcoming CPI data is a critical factor that could significantly influence WTI's direction. As the global economy grapples with inflationary pressures, oil prices play a crucial role in shaping overall inflation expectations. A higher-than-expected CPI reading could reinforce concerns about persistent inflation, potentially leading to a more hawkish stance from central banks, particularly the Federal Reserve. Wednesday's EUR and USD high-impact events will provide more clues about the global economy. This, in turn, could strengthen the dollar, putting downward pressure on WTI prices. Conversely, a weaker-than-expected CPI could ease inflation concerns, potentially leading to a more dovish outlook from central banks and supporting higher oil prices. Traders need to closely monitor the CPI data and its implications for monetary policy.
Technical Analysis: Approaching Overbought Territory
From a technical perspective, WTI is approaching overbought territory, signaling a potential pullback. On the 1-day timeframe, the RSI is at 82.87, indicating that the market may be overextended. Historically, when the RSI reaches these levels, WTI has often experienced a period of consolidation or a corrective decline. However, it's crucial to consider the underlying trend strength. The ADX on the 1-day chart is at 49.88, reflecting the strong bullish trend that has been in place. This suggests that any pullback may be temporary, with buyers likely to step in at lower levels. The stochastic K at 51.72 and D at 58.99 present a bearish signal, further suggesting a possible cool-off in the near term.
Key Support and Resistance Levels
Identifying key support and resistance levels is crucial for managing risk and identifying potential trading opportunities. On the downside, immediate support can be found at $97.31, followed by $92.95 and $90.72. These levels represent potential areas where buyers may step in to defend the bullish trend. Conversely, on the upside, immediate resistance is at $99.25, followed by $102.30 and $107.56. A breakout above $99.25 could pave the way for further gains, while a failure to overcome this level could lead to a deeper correction. Traders should pay close attention to these levels and adjust their positions accordingly.
USD/JPY Eyes 160.00 as Geopolitical Risks Fuel Dollar Demand
The current market environment is characterized by a strengthening US dollar. According to PriceONN news, USD/JPY is approaching the key 160.00 level as the US Dollar strengthens amid rising geopolitical tensions in the Middle East. The DXY (Dollar Index) is at 100.2 and is showing a strong bullish trend. When the dollar strengthens, it often puts downward pressure on commodity prices, including WTI. This is because commodities are typically priced in dollars, so a stronger dollar makes them more expensive for foreign buyers. However, in the case of WTI, the geopolitical risks and supply concerns may be offsetting the negative impact of a stronger dollar. The oil price is also affected by CAD/JPY, as the CAD is correlated to the oil price.
CAD JPY News Bank of Canada Bank of Japan Oil Prices
CAD/JPY is another important factor to consider when analyzing WTI prices. As PriceONN keyword intelligence points out, "cad jpy news bank of canada bank of japan oil prices" is a rising star search term, indicating a strong interest in the relationship between the Canadian dollar, the Japanese yen, and oil prices. The Bank of Canada and the Bank of Japan's monetary policies can significantly impact their respective currencies, which in turn can influence commodity prices. For example, if the Bank of Canada were to adopt a more hawkish stance, it could strengthen the Canadian dollar, potentially putting downward pressure on WTI prices. Conversely, if the Bank of Japan were to maintain its ultra-loose monetary policy, it could weaken the Japanese yen, potentially supporting higher oil prices. On the 1-hour chart, WTI has a relatively low ADX trend of 19.71, which indicates that the market is in a relatively weak trend, and may move sideways.
Risk Management and Trading Strategies
Given the complex interplay of factors influencing WTI prices, it's crucial to adopt a sound risk management strategy. Traders should carefully assess their risk tolerance and adjust their position sizes accordingly. Setting stop-loss orders is essential to limit potential losses in case of unexpected market movements. Diversifying portfolios across different asset classes can also help mitigate risk. For scalpers, the 1-hour timeframe may offer opportunities to profit from short-term price fluctuations. Swing traders may prefer the 4-hour timeframe, while long-term investors may focus on the daily or weekly charts. The 4-hour chart has an ADX of 23.08, indicating a weak trend, so traders should be cautious about long-term trends.
The Influence of IEA Reserve Release
On March 13, PriceONN reported that WTI crude oil defended $95 as the IEA reserve release balances geopolitical tensions. The International Energy Agency's (IEA) decision to release strategic oil reserves was aimed at easing supply concerns and stabilizing prices. While the release initially put downward pressure on WTI prices, the impact was short-lived, as the market quickly refocused on the escalating geopolitical tensions and the Saudi Arabia production cut. This highlights the importance of considering both supply and demand factors when analyzing oil prices. While the IEA reserve release can provide temporary relief, it's unlikely to have a lasting impact if the underlying supply concerns persist. It is also important to watch the SP500 and Nasdaq, as the direction of those indexes can affect WTI prices.
Dow Jones 30 Declines Amid WTI and Economic Uncertainty
The Dow Jones 30 is showing a decline of 0.48% and is at 46502.5. The RSI is at 27.44, which is considered oversold and may result in a buy. This decline is also affecting the price of WTI, as it is affected by the overall economic uncertainty. The DOW is showing a strong downward trend on the 1-day chart with an ADX of 34.71. The close correlation between the Dow Jones 30 and WTI can result in similar patterns. The Stochastic K is at 19.19 and D at 28.41 which is a bearish signal.
Frequently Asked Questions: WTI Analysis
What happens if WTI breaks above $99.25 resistance?
A break above $99.25 resistance could trigger further gains, potentially targeting $102.30 and $107.56. This scenario could be fueled by escalating geopolitical tensions or a weaker-than-expected CPI reading.
Should I buy WTI at current $99.18 levels given RSI at 82.87?
Given the overbought RSI of 82.87, caution is warranted. A more prudent approach would be to wait for a pullback towards support levels before considering long positions. Manage your risk and wait for the market to give a second chance.
Is RSI at 82.87 a sell signal for WTI right now?
While an RSI of 82.87 indicates overbought conditions, it's not a definitive sell signal. A break below $97.31 support would provide stronger confirmation of a potential trend reversal.
How will the upcoming CPI data affect WTI this week?
The upcoming CPI data could significantly impact WTI. A higher-than-expected reading could strengthen the dollar, putting downward pressure on oil prices, while a weaker-than-expected reading could support higher prices.
The WTI market is at a critical juncture, influenced by a complex interplay of geopolitical risks, economic data, and technical signals. Traders need to carefully monitor these factors and adopt a disciplined approach to risk management. While the market is at an all-time high, patient investors always find opportunities - the key is waiting for the right moment.
Track markets in real-time
AI-powered analysis, technical indicators and real-time price data.
Join Our Telegram Channel
Breaking market news, AI analysis and trading signals instantly.
Join Channel