DXY Tests $99.5 Support as Fed Rate Hike Fears Recede
The Dollar Index (DXY) is probing key support near $99.50. With Fed rate hike expectations cooling, can the dollar hold its ground against broader market shifts?
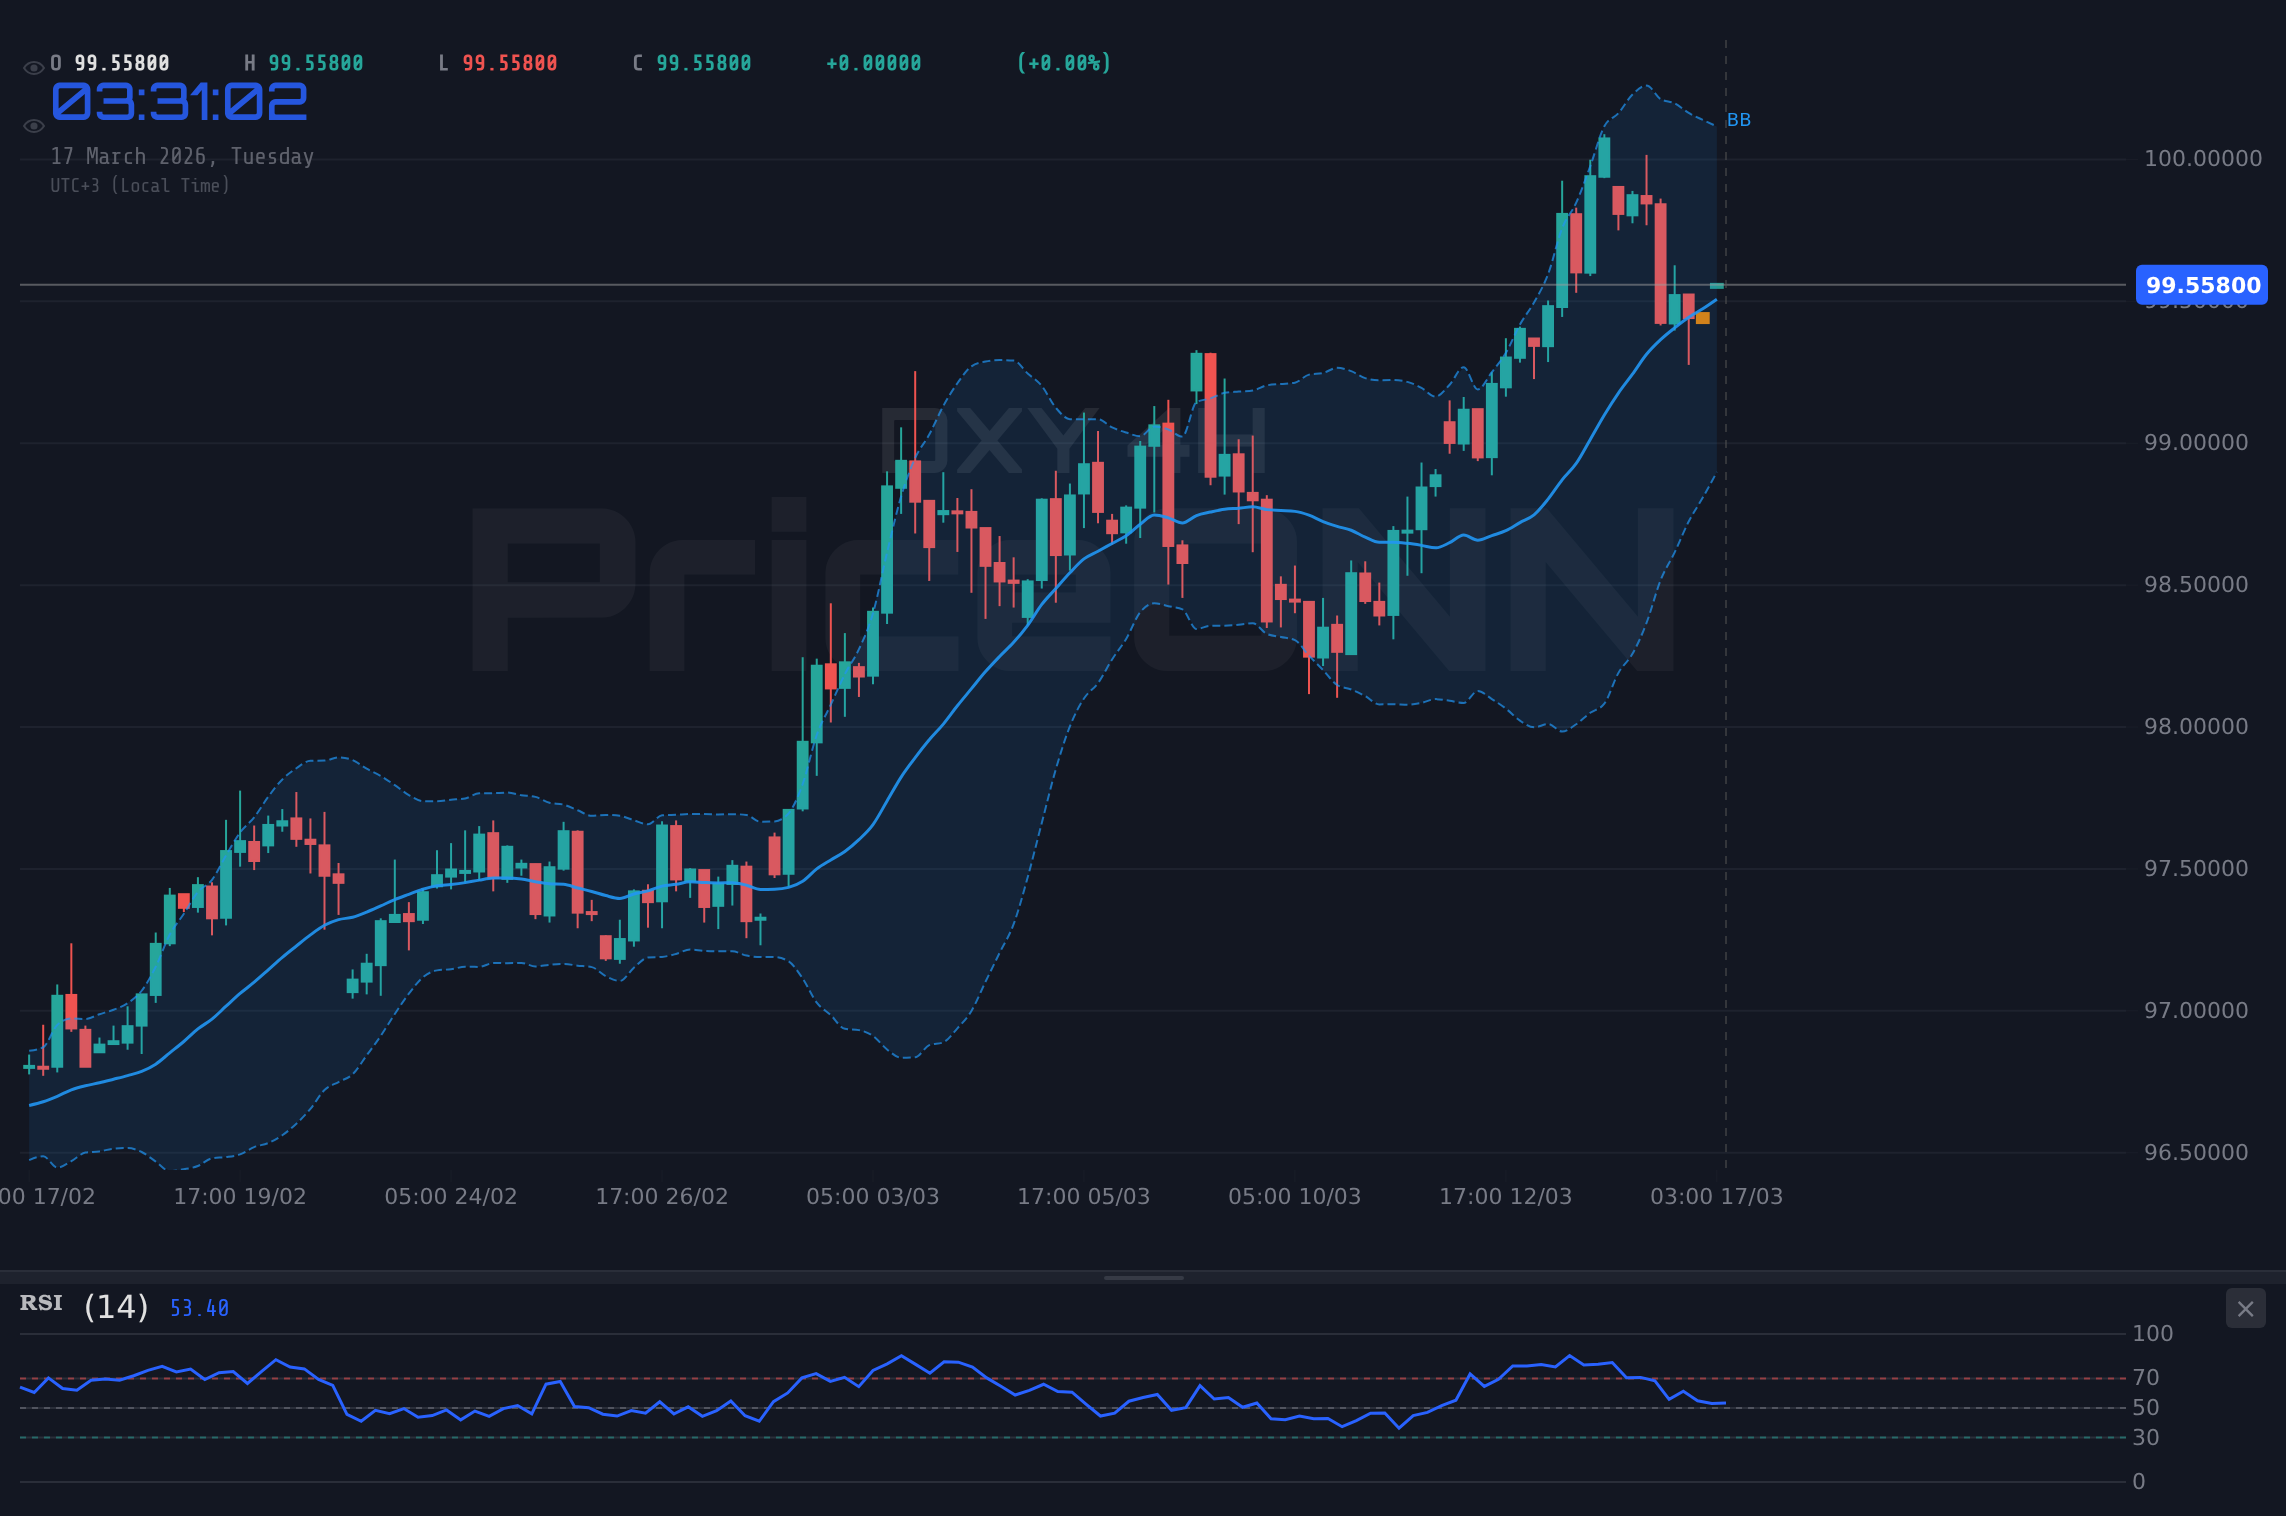
The Dollar Index (DXY) is currently trading at $99.69, hovering precariously near a critical support level at $99.50. This juncture is particularly important as market participants digest shifting expectations surrounding the Federal Reserve's monetary policy path. While recent economic data has painted a mixed picture, the receding fear of aggressive rate hikes is beginning to weigh on the dollar's strength, creating a complex landscape for traders. Understanding the interplay between Fed policy, inflation data, and broader market sentiment is crucial for navigating the DXY's next move.
- DXY is testing support at $99.50, currently trading at $99.69.
- RSI at 52.72 signals neutral momentum on the 1H chart, with a slight upward bias.
- ADX at 25.25 indicates a strong downtrend is present on the 1H chart, despite current price action.
- The 4-hour trend is neutral, but the daily trend shows strength at 96% in favor of a rise.
- Key resistance levels to watch are $99.86 and $100.37, while support lies at $99.40 and $99.17.
The Shifting Sands of Fed Policy and DXY's Reaction
The narrative surrounding the Federal Reserve has been the dominant driver for the US Dollar Index (DXY) in recent months. Initially, soaring inflation figures and hawkish rhetoric from Fed officials fueled expectations of aggressive interest rate hikes throughout the year. This anticipation propelled the DXY to higher grounds, as higher rates typically attract capital seeking better yields. However, the tide appears to be turning. Recent economic indicators, while still elevated, have shown signs of moderating inflation, coupled with a slight cooling in the labor market. This has led traders to re-evaluate the Fed's trajectory, pushing back the timeline for the first rate hike and tempering the magnitude of subsequent increases. The CME FedWatch tool, though not explicitly provided in the data, generally reflects these shifts, and market participants are now pricing in a less hawkish path than previously anticipated. This recalibration is directly impacting the DXY's price action, causing it to pull back from its recent highs as the premium for higher yields diminishes.
On the 4-hour chart, the DXY exhibits a neutral trend with a 50% power reading, suggesting indecision among market participants. However, the daily chart paints a different picture, showing a strong bullish trend with 96% power. This divergence highlights the immediate uncertainty versus the longer-term outlook. The RSI(14) on the 1H chart stands at 52.72, indicating a neutral stance with a slight upward bias, suggesting that while sellers are not in full control, there isn't overwhelming buying pressure either. The MACD on the same timeframe is showing negative momentum, with the MACD line below its signal line, indicating a potential for further downside in the short term. Conversely, the ADX at 25.25 on the 1H chart signals a strong downtrend is present, which contradicts the neutral RSI reading. This conflict in indicators suggests a period of consolidation or a potential breakout is imminent, with the direction yet to be decisively determined.
Navigating the Technical Landscape: Support and Resistance Levels
From a technical perspective, the DXY is currently finding itself at a critical crossroads. The immediate support level on the 1-hour chart is identified at $99.40. A decisive break below this level could trigger further selling pressure, potentially driving the index towards the next support at $99.29, and subsequently to $99.17. These levels represent areas where buying interest has historically emerged, and their defense will be crucial for any DXY recovery. On the resistance side, the immediate hurdle is at $99.63, followed by $99.75 and $99.86. A sustained move above these resistance points would signal a potential shift in short-term momentum and could pave the way for a more significant rally.
The 4-hour chart presents stronger support levels at $99.40, $99.29, and $99.17, reinforcing the significance of the $99.50 area as a key battleground. Resistance on this timeframe is seen at $99.63, $99.75, and $99.86. The daily chart, however, suggests a more robust upward potential, with support identified at $99.50, $98.93, and $98.64. The resistance levels on the daily chart are considerably higher, starting at $100.37 and extending to $100.66 and $101.23. This broader timeframe analysis suggests that while short-term fluctuations may favor a dip, the longer-term trend remains tilted towards dollar strength, contingent on underlying economic fundamentals and Fed policy.
The Bullish Case: Can DXY Reclaim $100?
The bullish scenario for the DXY hinges on several factors aligning favorably. Firstly, a sustained close above the $99.86 resistance level on the 1-hour chart is paramount. This would signal a confirmation of short-term buying interest and could pave the way for a test of the $100.37 resistance on the daily chart. For this bullish thesis to gain significant traction, we would need to see a continued moderation in inflation data, perhaps a CPI reading that comes in below expectations in the coming weeks. This would solidify the market's belief that the Fed is nearing the end of its tightening cycle, or perhaps even contemplating rate cuts later in the year. Additionally, a risk-off sentiment in global equity markets, such as a significant pullback in the S&P 500 (currently at 6686.95) or Nasdaq (24603.27), could drive safe-haven flows into the US dollar, bolstering the DXY. If these conditions materialize, the DXY could not only reclaim the $100 psychological level but also challenge the higher resistance points around $100.66 and potentially $101.23 within the next month. The strong daily trend strength (96%) supports this outlook, suggesting that the underlying momentum is still geared towards dollar appreciation, provided the fundamental catalysts remain supportive.
On the technical front, a bullish scenario would likely involve the RSI moving out of the neutral zone and towards the 60-70 level, indicating strengthening momentum. The MACD histogram would need to turn positive, crossing above its signal line, to confirm the shift in momentum. The Stochastic oscillator, currently showing a mixed picture across timeframes, would ideally cross bullishly and remain in overbought territory (above 80) for an extended period, though this would also signal caution for potential pullbacks. The ADX on the 1H chart, currently at 25.25 indicating a strong downtrend, would need to significantly weaken or reverse for a sustained bullish move. However, the ADX on the daily chart is only 12.68, suggesting a weak trend, which could allow for upward movement without strong trend confirmation. The key trigger for this bullish scenario would be a decisive break and hold above $99.86, confirmed by increasing volume and positive shifts in momentum indicators. This setup, if confirmed, could target the $100.37 and $100.66 levels in the short to medium term.
The Bearish Case: Can Support Hold at $99.50?
Conversely, the bearish scenario for the DXY centers on the failure to hold the critical support at $99.50. If the dollar index closes decisively below this level, it would likely signal a resumption of the downtrend, potentially driven by a reassessment of Fed policy or persistent inflation concerns that force the Fed to remain hawkish despite moderating data. A breakdown below $99.50 could see the DXY rapidly test the $99.40 and $99.29 support levels on the 1H and 4H charts. If these levels also give way, the next significant psychological barrier would be the $99.00 handle, with further downside targeting the $98.93 and $98.64 support levels identified on the daily chart. This scenario becomes more probable if upcoming economic data, such as Non-Farm Payrolls or CPI, surprises to the downside, prompting a significant shift in market expectations about the Fed's next move. Geopolitical tensions, while currently contributing to safe-haven demand in some assets, could also indirectly pressure the dollar if they lead to a broader global economic slowdown that forces the Fed to adopt a more dovish stance to support growth.
Technically, a bearish breakdown would be confirmed by the RSI falling below 50 and heading towards oversold territory (below 30). The MACD would likely remain in negative territory or cross further below its signal line, reinforcing the bearish momentum. Stochastic oscillators across timeframes would need to show consistent bearish signals, with the %K line remaining below the %D line and ideally moving into oversold territory. The ADX, currently indicating a strong downtrend on the 1H chart, would remain elevated, confirming the downward pressure. A key trigger for this bearish scenario would be a close below $99.40 on the 4-hour chart, indicating a loss of immediate buying interest. If this occurs, traders should watch for potential retests of this broken support level as new resistance before a further move lower. The current general signal for DXY across multiple timeframes is leaning towards 'SELL', which lends credence to this bearish outlook if the $99.50 support fails.
Scenario A: Bullish Breakout
45% ProbabilityScenario B: Bearish Breakdown
50% ProbabilityScenario C: Range-Bound Consolidation
5% ProbabilityThe Most Likely Path and What to Watch
Given the conflicting signals across different timeframes and indicators, the most probable scenario for the DXY in the immediate short term appears to be a continuation of the bearish pressure, targeting the $99.50 support. The daily trend strength of 96% in favor of a rise is a significant counter-argument, suggesting that any dip might be a buying opportunity for longer-term players. However, the immediate technical picture on the 1-hour and 4-hour charts, with their 'SELL' signals and bearish momentum indicators, suggests a higher probability (around 50%) for a move towards the lower support levels. The bullish scenario, while supported by the long-term trend, requires clearer confirmation of a dovish Fed pivot and a break above immediate resistance, giving it a slightly lower probability (45%) in the very short term. The range-bound scenario remains unlikely, given the strong ADX readings suggesting trend presence, albeit in conflicting directions across timeframes.
What will sway this balance? Upcoming economic data releases are paramount. A key event to watch is the release of the Producer Price Index (PPI) next Tuesday. If PPI shows a significant slowdown in inflation, it could reinforce the narrative of a Fed nearing the end of its tightening cycle, potentially accelerating the bearish case for the DXY in the short term, pushing it towards $99.17. Conversely, any signs of sticky inflation or unexpectedly strong labor market data could reignite hawkish Fed expectations, providing a strong tailwind for the DXY and pushing it back towards $100.37. Geopolitical developments also remain a wildcard; any escalation in Middle East tensions, for instance, could trigger a flight to safety, benefiting the dollar. However, the recent news regarding easing Hormuz tensions suggests this immediate catalyst might be receding, potentially reducing the safe-haven demand for the dollar in the very short term. Traders should closely monitor the $99.40 to $99.86 range as the immediate battleground, with a decisive break in either direction likely to dictate the DXY's path for the coming week.
| Indicator | Value | Signal | Interpretation |
|---|---|---|---|
| RSI (14) | 52.72 | Neutral | Suggests consolidation, slight upward bias on 1H. |
| MACD | Negative Momentum | Bearish | Indicates potential for short-term downside. |
| Stochastic | K=48.74, D=25.76 | Bullish | Shows potential for upward movement, but needs confirmation. |
| ADX | 25.25 | Strong Downtrend | Confirms trend presence on 1H, contradicting other indicators. |
| Bollinger Bands | Mid Band Breach | Bearish | Price below middle band suggests downward pressure. |
What I'm Watching This Week
This week, my focus is squarely on the $99.40 to $99.86 price range for the DXY. A confirmed close below $99.40 would be my primary signal for a bearish continuation, targeting $99.17 and potentially $98.93. This would likely be driven by softer economic data or continued dovish signals from the Fed. On the flip side, a strong close above $99.86, especially on increased volume, would invalidate the immediate bearish outlook and suggest a move towards the $100.37 resistance. The key economic catalyst to watch will be the upcoming PPI data; a significant miss to the downside would amplify the bearish case, while a hotter-than-expected reading could quickly shift sentiment back in favor of the dollar.
Frequently Asked Questions: DXY Analysis
What happens if DXY breaks below $99.40 support?
A decisive close below $99.40 on the 1-hour or 4-hour chart would signal a bearish continuation. This could lead to a test of the $99.17 support level, followed by a more significant move towards the $98.93 daily support if selling pressure intensifies. This scenario becomes more likely if upcoming economic data disappoints.
Should I buy DXY at current levels of $99.69 given the conflicting signals?
Caution is advised at current levels of $99.69 due to conflicting indicator signals and the proximity to key support at $99.50. A confirmed break above $99.86 resistance would offer a higher-probability bullish setup, while a break below $99.40 support would signal a bearish entry. Patience is key here.
Is the RSI at 52.72 a sell signal for DXY right now?
An RSI reading of 52.72 on the 1-hour chart is considered neutral, leaning slightly bullish. It does not, in itself, represent a sell signal. However, when viewed alongside negative MACD momentum and a strong ADX downtrend reading, it highlights the current indecision and potential for a directional move.
How will upcoming PPI data affect DXY this week?
If the upcoming PPI data shows a significant slowdown in inflation, it would likely reinforce the market's expectation of a less hawkish Fed. This could increase selling pressure on the DXY, pushing it towards $99.17. Conversely, hotter-than-expected inflation could revive hawkish Fed expectations and support a move back towards $100.37 resistance.
Track markets in real-time
AI-powered analysis, technical indicators and real-time price data.
Join Our Telegram Channel
Breaking market news, AI analysis and trading signals instantly.
Join Channel