Brent Crude Trades Near $101.16: Rally or Reversal?
Brent crude hovers around $101.16 amid conflicting signals. Explore the bull and bear cases, key technicals, and geopolitical factors driving this volatile energy market.
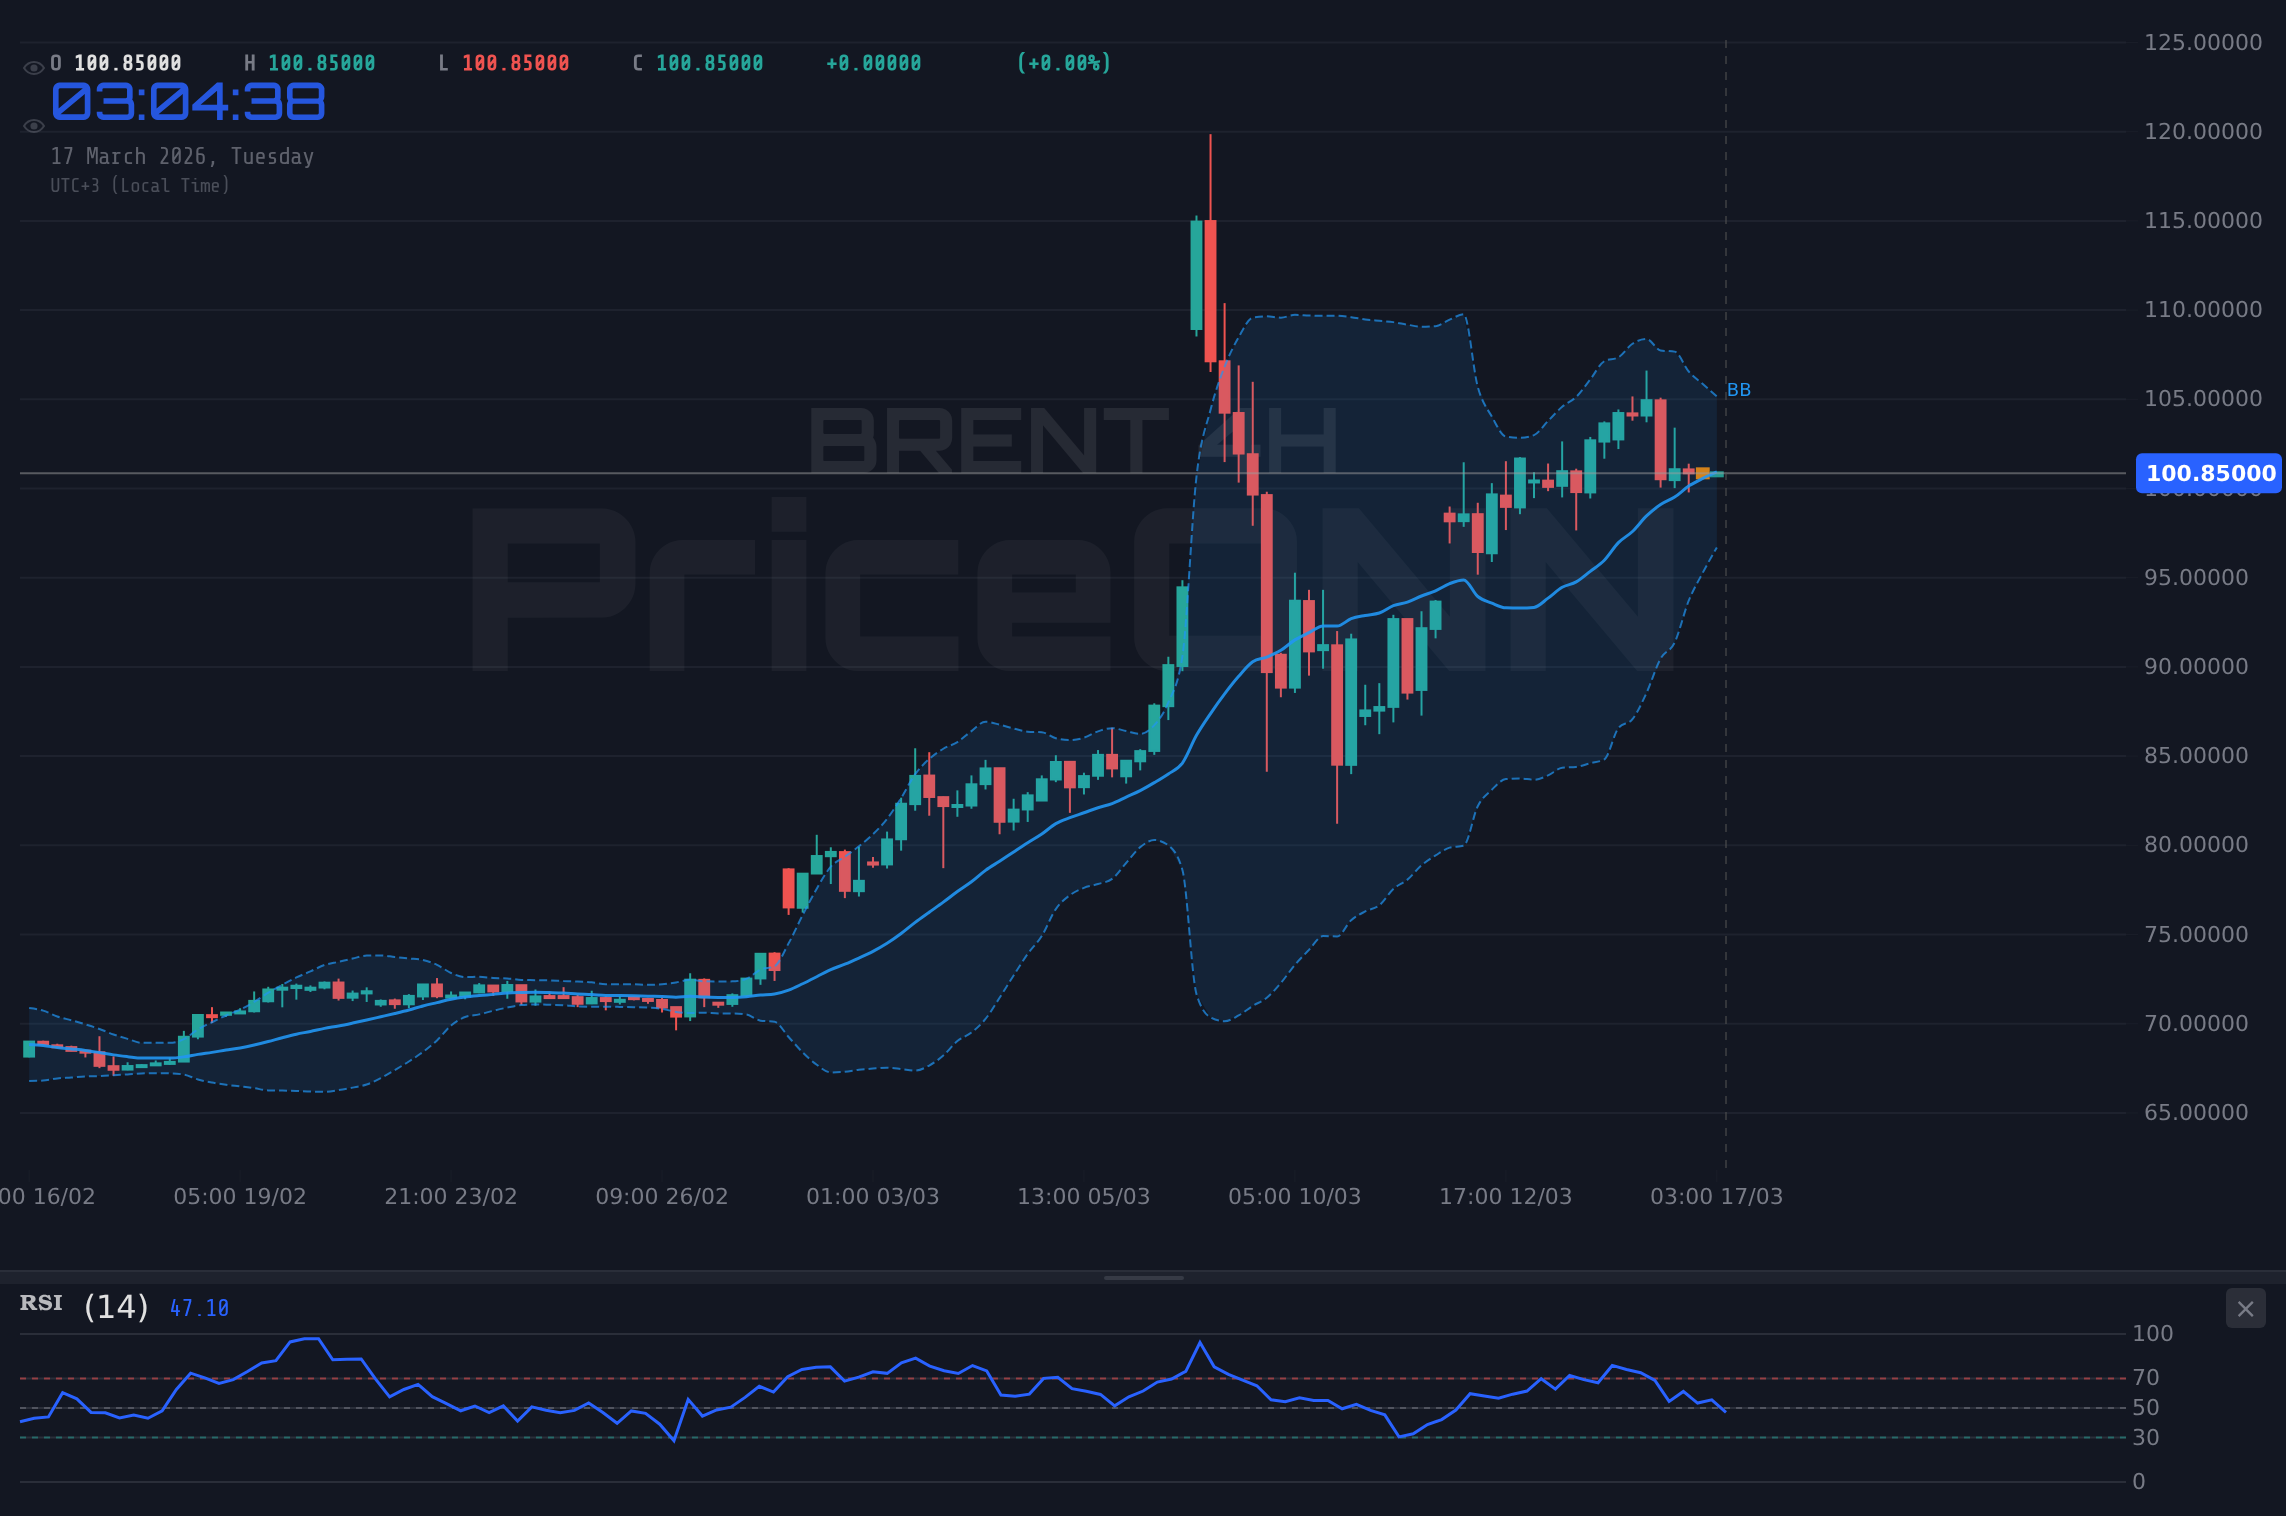
Brent crude is currently locked in a tense battleground, trading precariously near the $101.16 mark. This critical juncture isn't just another price point; it's a battleground where the bulls and bears are fighting for control, and the outcome will dictate the short-to-medium term direction for global oil markets. With the price hovering around $101.16, the question on every trader's mind is whether this represents a temporary pause before a renewed rally or the precursor to a significant reversal. The recent volatility, marked by a sharp drop to $99.78 followed by a rebound, underscores the delicate balance of supply, demand, and geopolitical risk that defines the current oil landscape.
- Brent crude is trading at $101.16, with key support at $99.61 and resistance at $105.72.
- RSI at 46 on the 1H chart signals bearish momentum, while the 1D RSI at 80.75 indicates overbought conditions potentially leading to a pullback.
- Geopolitical tensions in the Middle East continue to underpin prices, though recent easing in the Strait of Hormuz has introduced some downside pressure.
- The market is awaiting key economic data releases and further clarity on OPEC+ production policy to determine the next directional move.
The narrative around Brent crude is complex, a mosaic of competing forces. On one hand, the sheer strength of the daily trend, with an ADX reading of 57.88 suggesting a very strong uptrend, points towards underlying bullish momentum. The daily RSI at 80.75 is firmly in overbought territory, a classic sign that the market has potentially run too far, too fast, and a correction is due. However, the 1-hour chart paints a murkier picture, with an RSI of 46 and a neutral ADX of 23.2, indicating a lack of clear direction in the immediate term. This divergence across timeframes is precisely what creates the current indecision around the $101.16 level.
The Bull Case: Why Brent Could Push Higher
Underlying Supply Deficits and Geopolitical Premiums
Let's start with the argument for the bulls. The most significant factor underpinning Brent prices remains the structural tightness in global oil supply. OPEC+ has consistently signaled its commitment to managing the market, and voluntary production cuts, particularly from Saudi Arabia, continue to keep a floor under prices. The data suggests that with Saudi Arabia's voluntary cuts, the market is facing a deficit of roughly 1 million barrels per day. This persistent supply overhang, coupled with robust demand from emerging economies, creates a fertile ground for prices to climb higher, especially if geopolitical risks re-emerge.
The news flow from the Middle East, despite recent easing in some areas, remains a constant underlying threat. Events like the closure of the Strait of Hormuz, even if temporary, send shockwaves through the market, reminding participants of the fragility of global oil flows. Japan's decision to tap strategic reserves, as reported, highlights the sensitivity to supply disruptions. Any escalation of tensions in the region could quickly reignite fears of supply shortages, pushing Brent prices back towards the higher end of their recent range, potentially challenging resistance levels around $105.72 and even $107.80.
Strong Daily Trend and Momentum Indicators
Technically, the daily chart still presents a compelling bullish picture, despite the current pullback. The ADX at 57.88 is exceptionally high, indicating a powerful, established trend. While this can sometimes signal an overextended market, it also means that underlying momentum is strong. The MACD on the daily timeframe is showing positive momentum, with the MACD line above the signal line, reinforcing the idea that the larger trend remains upward. The Stochastic Oscillator, with K at 57.14 and D at 55.93, also suggests a bullish continuation, even if it's not in extreme overbought territory yet.
Furthermore, the Bollinger Bands on the daily chart are expanding and price is trading above the middle band, indicating an upward bias. This suggests that the recent dip might be a healthy consolidation within a larger uptrend, rather than the start of a significant reversal. The ability of Brent to hold above the $99.61 support level is crucial for maintaining this bullish outlook. If buyers step in strongly at these levels, we could see a swift move back towards the recent highs near $106.61.
The Bear Case: Why a Reversal is Possible
Overbought Conditions and Pullback Signals
However, the argument for the bears is equally potent, primarily rooted in the extreme overbought conditions indicated by several key indicators. The daily RSI at 80.75 is a flashing red light. Readings above 70 typically signal that an asset is overbought and due for a correction. While strong uptrends can sustain high RSI values for extended periods, this level often marks a point where profit-taking accelerates and momentum begins to wane. The fact that the price has pulled back from its recent highs, despite the strong daily trend, suggests that sellers are indeed starting to emerge.
The 1-hour chart provides further evidence for a bearish short-term outlook. With an RSI of 46 and a MACD histogram indicating negative momentum, the immediate trend appears to be down. The Stochastic Oscillator on the 1-hour chart, with K at 18.83 and D at 22.79, is signaling a bearish continuation and is still some distance from oversold territory, suggesting room for further downside. The ADX at 23.2 on this timeframe indicates a moderate trend, but it's the bearish momentum that is more telling for short-term traders. A break below the immediate support at $99.61 would confirm this bearish short-term bias.
Demand-Side Weaknesses and Macroeconomic Headwinds
Beyond the technicals, fundamental concerns about global demand are also weighing on oil prices. China's economic recovery, while showing signs of life, has been more gradual than initially hoped. A slower-than-expected rebound in Chinese oil consumption could significantly dampen global demand projections. Similarly, the ongoing energy crisis in Europe, despite efforts to secure alternative supplies, continues to cast a shadow over economic activity and, consequently, oil demand in the region. The recent news about Japan tapping strategic reserves, while a response to supply fears, also hints at underlying concerns about demand sustainability.
Furthermore, the broader macroeconomic environment presents challenges. Sticky inflation figures and the prospect of higher-for-longer interest rates from major central banks, including the Federal Reserve, could dampen global economic growth. A slowdown in economic activity typically translates to lower oil demand. The correlation between oil prices and global growth is well-established, and any indication of weakening economic momentum globally would be a bearish signal for Brent crude. The strengthening dollar, as indicated by the DXY index at 99.64, can also put pressure on dollar-denominated commodities like oil, making them more expensive for holders of other currencies.
Conflicting Signals Across Timeframes
Perhaps the most crucial element supporting the bear case is the conflicting technical signals across different timeframes. While the daily chart exhibits a powerful uptrend (ADX 57.88, RSI 80.75), the shorter-term charts (1H, 4H) are painting a more cautious, even bearish, picture. The 1-hour chart shows bearish momentum (MACD negative, RSI 46), and the 4-hour chart, while showing a neutral trend strength (ADX 21.47), has a bearish MACD signal and a falling RSI at 53.95. This divergence suggests that the short-term selling pressure might be more dominant than the long-term trend implies, potentially leading to a deeper correction before any renewed upside movement.
The current price of $101.16 sits right between the 1-hour support at $99.61 and resistance at $101.13. A close below $99.61 on the 1-hour chart would likely trigger further selling, targeting the next support at $98.95. Conversely, holding above $101.13 and pushing towards $102.01 would negate the immediate bearish outlook, but the overbought daily RSI would still loom large as a potential ceiling.
Navigating the $101.16 Crossroads
The Importance of Key Levels: Support at $99.61, Resistance at $101.13
The $101.16 price point is more than just a number; it's a critical pivot zone. On the immediate 1-hour chart, resistance is seen at $101.13, with immediate support at $99.61. A decisive break below $99.61 would likely confirm the short-term bearish bias, potentially opening the door for a move towards $98.95 and the next significant support at $98.07. This would signal that the recent rally has failed and sellers are taking control, at least temporarily.
Conversely, if Brent can decisively break and hold above the $101.13 resistance, it would invalidate the immediate bearish setup. The next significant resistance level to watch would be $102.01, followed by $102.66. However, even a move above these levels might face stiff opposition due to the daily overbought conditions. The ultimate test for the bulls would be challenging the $105.72 resistance, a move that would require a significant shift in market sentiment or a renewed geopolitical catalyst.
Economic Calendar and OPEC+ Policy: The Next Catalysts
Looking ahead, the market will be keenly focused on upcoming economic data releases that could influence both demand projections and central bank policy. Key inflation reports (CPI, PCE) and employment figures (NFP) will provide crucial insights into the health of major economies. Stronger-than-expected data could reignite inflation concerns and push interest rates higher, potentially dampening oil demand. Conversely, weaker data might lead to expectations of central bank easing, which could stimulate economic activity and support oil prices.
The actions and statements from OPEC+ will remain paramount. Any hints about future production adjustments, whether tightening or loosening, will have an immediate impact on supply expectations. Investors will be watching closely for any signs of dissent within the group or increased pressure from major producers to adjust output in response to market conditions. The market's reaction to these policy signals, combined with the economic data, will likely determine whether Brent can sustain its upward trajectory or succumbs to bearish pressures.
Correlations to Watch: DXY and Equities
The interplay between Brent crude, the US Dollar Index (DXY), and equity markets is also critical. Currently, the DXY is at 99.64, showing a recent downward trend but still holding significant strength on the daily chart (ADX 31.72, RSI 66.72). A strengthening dollar typically puts downward pressure on oil prices, as it makes oil more expensive for buyers using other currencies. Conversely, a weakening dollar can provide a tailwind for crude. Traders should monitor the DXY's direction closely; a sustained move below 99.50 could offer some relief to oil prices.
Equity markets, represented by the S&P 500 (6692) and Nasdaq (24620.5), are showing mixed signals on shorter timeframes but a strong bearish trend on the daily charts. The S&P 500's daily ADX at 39.23 and RSI at 40.21 suggest a downtrend, while the Nasdaq shows similar weakness. A significant risk-off sentiment in equities, triggered by negative economic news or geopolitical events, could spill over into the oil market, increasing selling pressure on Brent as investors shed riskier assets.
Verdict: A Precarious Balance at $101.16
The current technical picture for Brent crude at $101.16 is one of significant tension and conflicting signals. The powerful daily uptrend, evidenced by the high ADX and RSI approaching overbought territory, suggests that the underlying strength may persist. However, the immediate bearish momentum on the 1-hour chart, coupled with demand-side concerns and potential macroeconomic headwinds, creates a substantial risk of a near-term pullback. The market is at a critical juncture, and the $101.16 level serves as a fulcrum.
My assessment leans towards caution in the immediate short term. While the long-term bullish fundamentals remain intact, the extreme overbought condition on the daily RSI (80.75) combined with bearish signals on shorter timeframes suggests that a correction is likely before any sustained move higher. A break below $99.61 would likely confirm this, opening the door for a test of $98.07. Bulls need to see prices decisively reclaim and hold above $101.13, ideally breaking through $102.01, to invalidate the immediate downside risk. Until then, traders should be wary of chasing upside momentum and look for confirmation of a sustained bullish trend resumption.
Frequently Asked Questions: BRENT Analysis
What happens if BRENT breaks below $99.61 support?
If BRENT closes decisively below the $99.61 support level on the 1-hour chart, it would likely signal a short-term bearish reversal. This could lead to a further decline towards the next support at $98.95, and potentially test the $98.07 level as sellers gain control.
Should I buy BRENT at current levels of $101.16 given the daily RSI at 80.75?
Buying at $101.16 is risky due to the daily RSI at 80.75 indicating overbought conditions. While the long-term trend is bullish, a pullback is probable. A more prudent approach might be to wait for a confirmed break above $101.13 resistance or a dip towards key support levels like $99.61, ideally with clearer bullish signals on shorter timeframes.
Is the daily RSI at 80.75 a sell signal for BRENT?
An RSI reading of 80.75 is a strong indicator of overbought conditions, suggesting that the asset has risen too quickly and may be due for a price correction. While not an immediate sell signal in isolation, especially in a strong uptrend, it warrants caution and increases the probability of a pullback or consolidation.
How will upcoming economic data affect BRENT's price around $101.16?
Upcoming economic data, particularly inflation and employment reports, will influence global growth expectations and central bank policy. Stronger data might support oil demand but could also lead to tighter monetary policy, potentially capping prices. Weaker data might signal economic slowdown, pressuring prices, but could also increase expectations for stimulus, offering some support.
The battle for control at $101.16 highlights the delicate equilibrium in the oil market. While fundamental supply constraints and geopolitical risks provide a bullish undercurrent, the technical overbought conditions on longer timeframes and bearish signals on shorter ones introduce significant downside risk. For now, patience appears to be the best strategy. Traders should wait for a clear break of either the $99.61 support or the $101.13 resistance zone to gain conviction. The market is offering signals, but they are currently mixed, demanding a disciplined approach focused on risk management rather than chasing speculative moves.
Technical Outlook Summary
| Indicator | Value | Signal | Interpretation |
|---|---|---|---|
| RSI (14) | 46.00 | Bearish | Below 50, falling momentum on 1H. Daily RSI at 80.75 is overbought. |
| MACD | Negative | Bearish | Negative momentum on 1H chart. |
| Stochastic | K=18.83, D=22.79 | Bearish | Bearish crossover and continuation on 1H. |
| ADX | 23.20 | Neutral | Moderate trend strength on 1H, suggesting consolidation. |
| Bollinger Bands | Middle Band | Bearish | Price below middle band on 1H, indicating downward pressure. |
Key Levels
Support Levels
Resistance Levels
Track markets in real-time
AI-powered analysis, technical indicators and real-time price data.
Join Our Telegram Channel
Breaking market news, AI analysis and trading signals instantly.
Join Channel