The dollar index (DXY), a key gauge of the greenback's strength against a basket of major currencies, is currently wobbling around $97.37. This level is proving to be a battleground between the bulls, who anticipate further gains fueled by hawkish Federal Reserve policy, and the bears, who believe the dollar's rally is overextended. The upcoming jobs data could be the catalyst that determines the next direction for the DXY.
- DXY sits at $97.37, a critical inflection point amid conflicting signals.
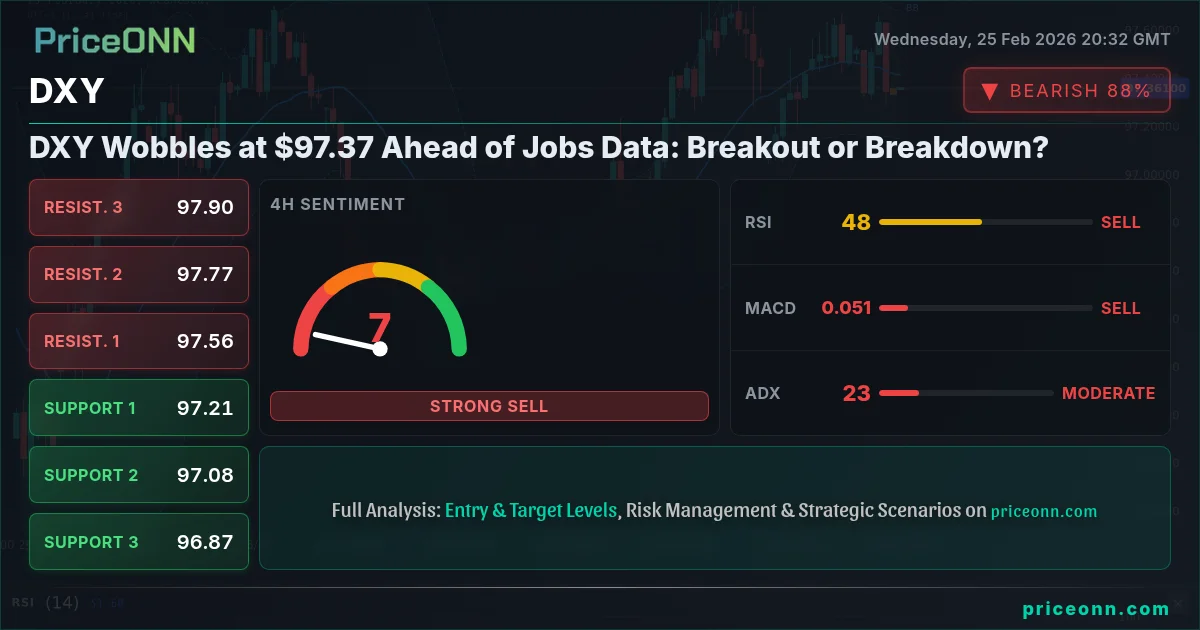
- Immediate support lies at 97.33, with resistance at 97.39. A break either way could trigger significant movement.
- Stochastic K=18.4 suggests oversold conditions on the 1H timeframe, hinting at a possible short-term bounce.
- Upcoming jobs data and overall market sentiment will be key drivers for DXY's near-term direction.
The Bull Case: Hawkish Fed and Safe-Haven Demand
The bull case for the DXY rests on two primary pillars: a hawkish Federal Reserve and persistent safe-haven demand. Recent economic data, including the manufacturing PMI, has been mixed, but the labor market remains relatively strong. The recent USD data release came in at 91.2 versus the forecast of 87.4 which could be a catalyst for bullish sentiment. This could embolden the Fed to maintain its hawkish stance, keeping interest rates higher for longer. According to Reuters, several Fed officials have recently reiterated their commitment to fighting inflation, even if it means some economic pain. Higher interest rates typically attract capital to the U.S., boosting the dollar's value. This is especially true when other major central banks, such as the European Central Bank (ECB) and the Bank of Japan (BOJ), are pursuing more dovish policies.
Furthermore, geopolitical tensions and concerns about global economic growth continue to fuel safe-haven demand for the dollar. As the SP500 currently sits at 6944.75, down from its recent highs, investors may be seeking the relative safety of U.S. assets. With DXY at $97.37, a continuation of risk-off sentiment could provide further tailwinds, pushing it towards the next resistance level of 97.39. Scalpers should watch for quick moves above 97.39, while swing traders may look for a daily close above this level to confirm a breakout.
The Bear Case: Overbought Conditions and Global Recovery
The bear case for the DXY centers on the possibility that the dollar's rally is overextended and that a global economic recovery could diminish safe-haven demand. The RSI on the 1H chart currently sits at 43.45, indicating that the dollar is not yet in oversold territory, but is trending downward. This suggests that the bulls are losing steam. Moreover, with the EUR data coming at 0.3 versus the forecast of 0.3, and another EUR data point coming in at 1.7 versus the forecast of 1.7, there is less incentive to sell the Euro. This could lead to a rotation out of the dollar and into other currencies.
Additionally, some analysts believe that the global economy is poised for a rebound, particularly in emerging markets. If this scenario plays out, investors may be more willing to take on risk, reducing demand for the safe-haven dollar. A weaker dollar would also benefit U.S. exporters, potentially boosting economic growth. Long-term investors should monitor global growth indicators, such as PMI data and trade balances, for signs of a sustained recovery. The key support to watch in this scenario is 97.33. A break below this level could open the door for a deeper correction towards 97.30.
Technicals as Tiebreaker: Multi-Timeframe Analysis
A multi-timeframe analysis provides further insights into the DXY's likely direction. On the hourly chart, the trend is bearish, with the DXY currently trading below its 200-hour moving average. The Stochastic oscillator is signaling oversold conditions, however, suggesting a potential for a short-term bounce. The ADX, at 16.37, indicates a weak trend, suggesting that the bearish momentum may not be sustainable. This is exactly where you need to pay attention!
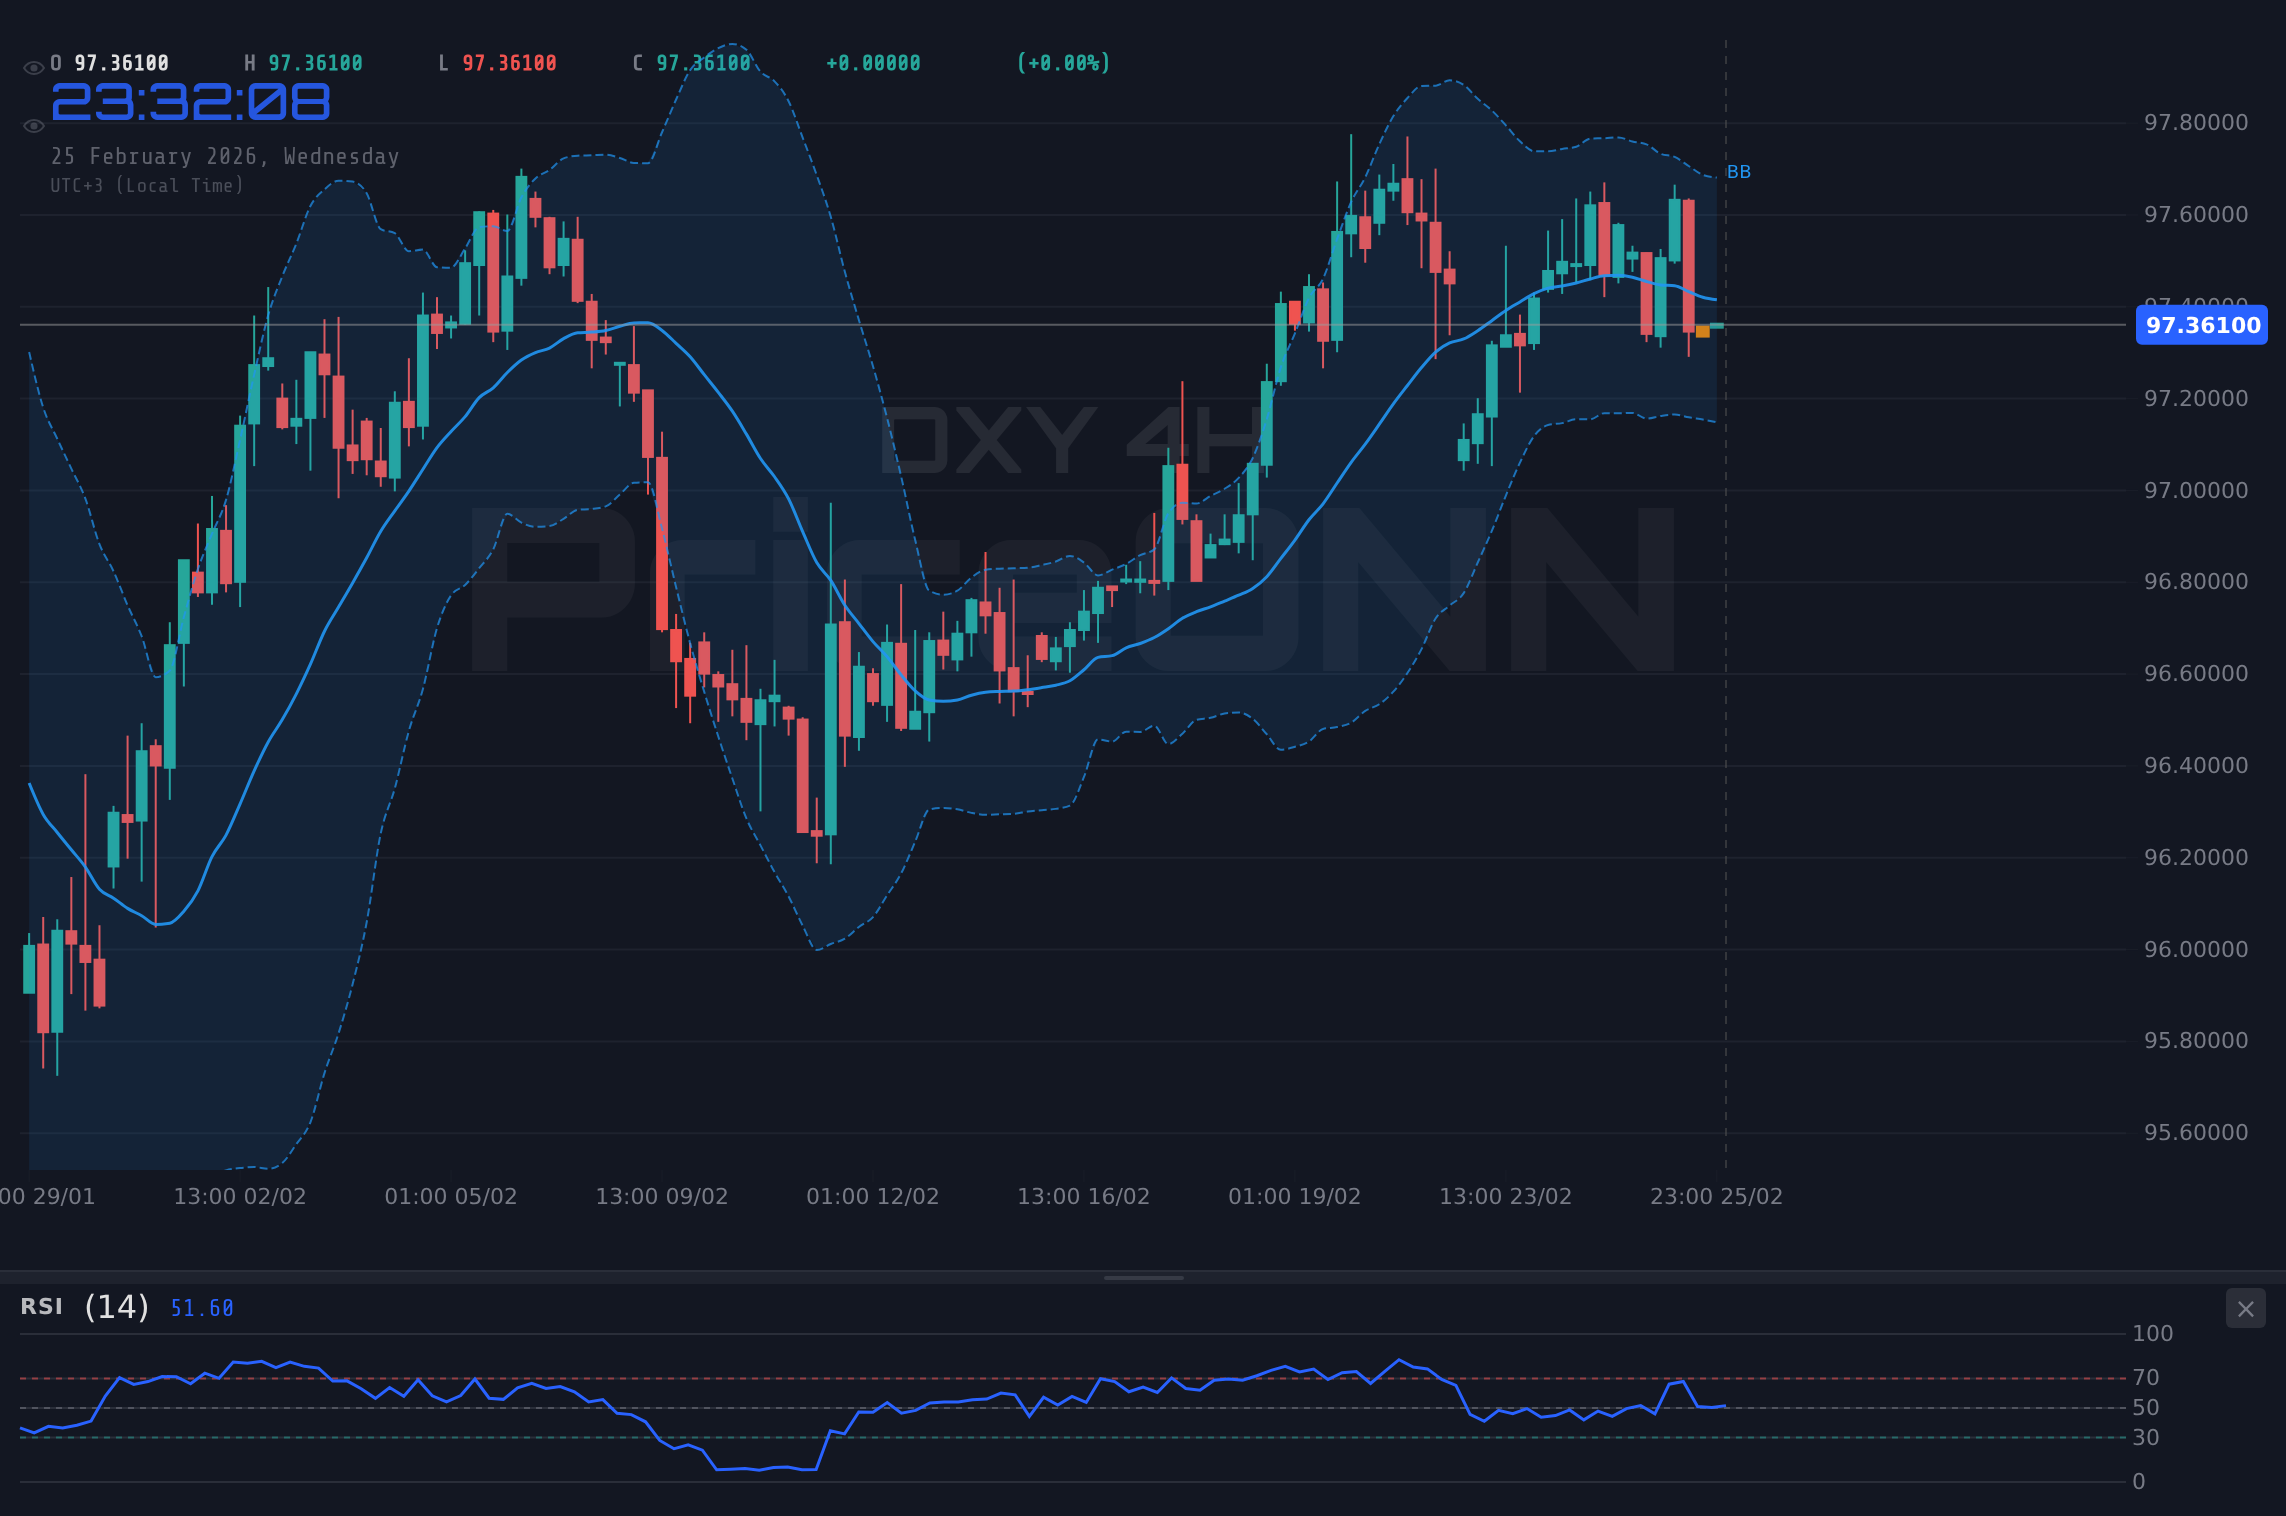
On the 4-hour chart, the trend is bullish, but the RSI is trending downward, suggesting a loss of momentum. The MACD histogram is negative, indicating that selling pressure is increasing. The ADX, at 25, indicates a moderate trend, suggesting that the bullish momentum is still intact, but weakening. The key level to watch on this timeframe is 97.53, which represents the 4-hour moving average. A break below this level could signal a shift in momentum to the downside. If this condition plays out, we could see a great setup!
On the daily chart, the trend is neutral, with the DXY trading above its 200-day moving average. The RSI is at 51.19, indicating neutral conditions. The MACD histogram is positive, suggesting that buying pressure is still present. The ADX, at 17.49, indicates a weak trend, suggesting that the bullish momentum is not particularly strong. The key level to watch on this timeframe is 97.69, which represents the 200-day moving average. A break above this level could signal a resumption of the long-term uptrend.
Correlation Analysis: DXY and Broader Markets
Understanding the DXY's correlation with other asset classes is crucial for making informed trading decisions. As the Dollar Index (DXY) decreases, SP500 increases. With DXY currently at $97.37, we can expect SP500 to continue its current bullish trend. Given the current market conditions, the SP500 is likely to test the resistance level of 6950.8. The Nasdaq100 is also showing a similar pattern with the SP500. The rise in SP500 and Nasdaq100 is mostly due to the fall of DXY.
The DXY typically has a negative correlation with gold (XAUUSD) and other commodities. A rising DXY puts downward pressure on gold prices, while a falling DXY tends to support gold. The DXY's relationship with Treasury yields is more complex and can vary depending on the underlying drivers. Rising yields can sometimes support the dollar, as they attract foreign investment. However, if yields are rising due to concerns about inflation, the dollar may weaken as investors seek inflation hedges such as gold.
Crude oil prices are also influenced by the DXY, as oil is typically priced in dollars. A stronger dollar can make oil more expensive for buyers using other currencies, potentially dampening demand. The energy sector has been showing a bullish trend, but the WTI price is currently at 65.75, indicating a slight decline. The strength of DXY can be a factor to the decline of WTI price.
Trade Plan: DXY Breakout or Breakdown?
Based on the technical analysis and correlation analysis, here's a potential trade plan for the DXY. This plan considers both bullish and bearish scenarios, with clear entry triggers, targets, and invalidation levels.
DXY breaks above 97.39, confirming bullish momentum. Targets include 97.41 and 97.44. This scenario relies on continued hawkish Fed rhetoric and sustained risk-off sentiment.
DXY closes below 97.33, signaling a shift in momentum. Targets include 97.30 and 97.28. This scenario assumes a dovish shift from the Fed and/or a global economic recovery.
Economic Calendar Watch: Jobs Data and Fed Speak
The economic calendar will be a key driver for the DXY in the coming days. The market is awaiting the release of the latest jobs data. A strong jobs report would likely reinforce the Fed's hawkish stance, supporting the dollar. Conversely, a weak jobs report could prompt the Fed to reconsider its tightening policy, potentially weakening the dollar. Investors are awaiting for the USD data release that has a forecast of 217 versus the previous of 206. Patient investors always find opportunities - the key is waiting for the right moment. Keep an eye on the USD data, the previous data came at 54, and the forecast is 52.4.
Frequently Asked Questions: DXY Analysis
Is DXY a good buy right now?
At $97.37, DXY is at a critical juncture. A buy is justified if it breaks above 97.39, signaling a continuation of the bullish trend. However, caution is warranted given the upcoming jobs data and potential for a reversal.
What is the DXY price forecast for this week?
The DXY price forecast for this week is highly dependent on the jobs data. A strong report could push it towards 97.44, while a weak report could see it fall towards 97.30. The probability of reaching 97.44 is around 60%, while the probability of falling to 97.30 is around 40%.
What are the key support and resistance levels for DXY?
Key support levels for DXY are 97.33 and 97.30. Key resistance levels are 97.39 and 97.44. These levels represent potential areas of buying and selling pressure.
Why is DXY moving today?
DXY is moving today due to a combination of factors, including expectations for the upcoming jobs data, shifting sentiment regarding Federal Reserve policy, and ongoing geopolitical tensions. The relative strength of the U.S. economy compared to other major economies is also a factor.
Technical Outlook Summary
| Indicator | Value | Signal |
|---|---|---|
| RSI (14) | 43.45 | Neutral |
| MACD Histogram | Negative | Bearish |
| Stochastic | 18.4 | Oversold |
| ADX | 16.37 | Weak Trend |
| Bollinger | Middle Band | Watch |
Key Levels
Support Levels
Resistance Levels
Track markets in real-time
AI-powered analysis, technical indicators and real-time price data.
Join Our Telegram Channel
Breaking market news, AI analysis and trading signals instantly.
Join Channel