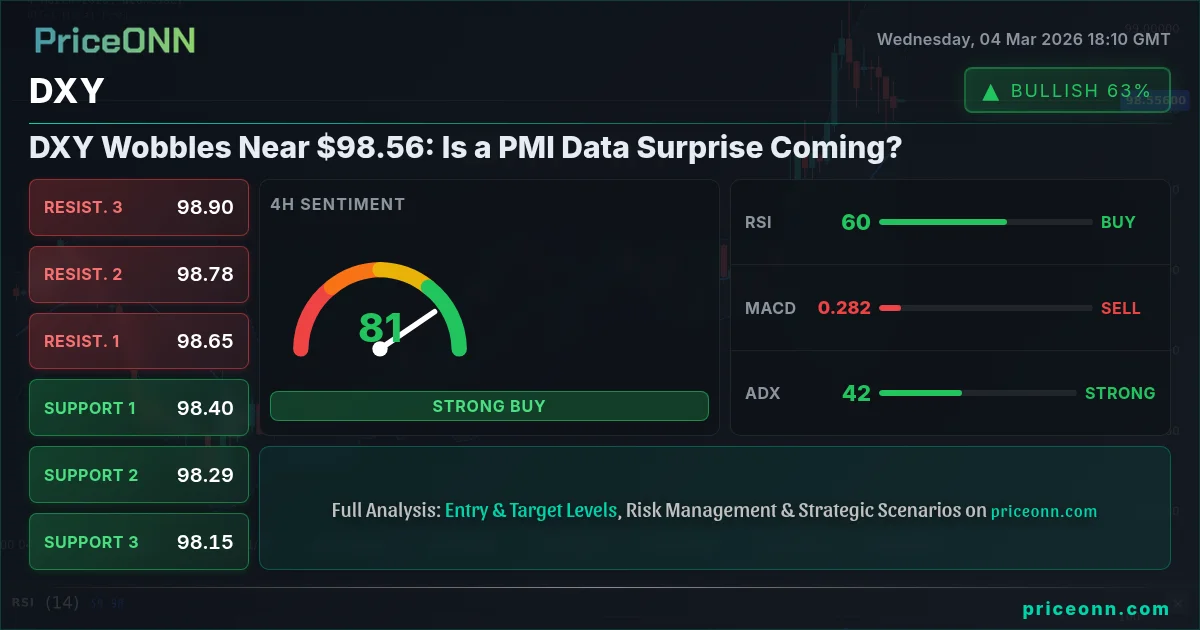
With the DXY currently trading near $98.56, it feels like the market is holding its breath. Will the upcoming PMI data be the catalyst for a breakout, or will it trigger a deeper pullback? That's the million-dollar question on every trader's mind right now.
- RSI at 49.28 suggests neutral momentum, leaving room for either bullish or bearish moves.
- Immediate resistance looms at 98.55, a level bulls need to breach for further upside.
- A daily close below 98.42 could signal a deeper correction, targeting the 98.29 level.
- Geopolitical tensions and fluctuating risk appetite are adding complexity to DXY's outlook.
Is the Dollar About to Break or Break Down?
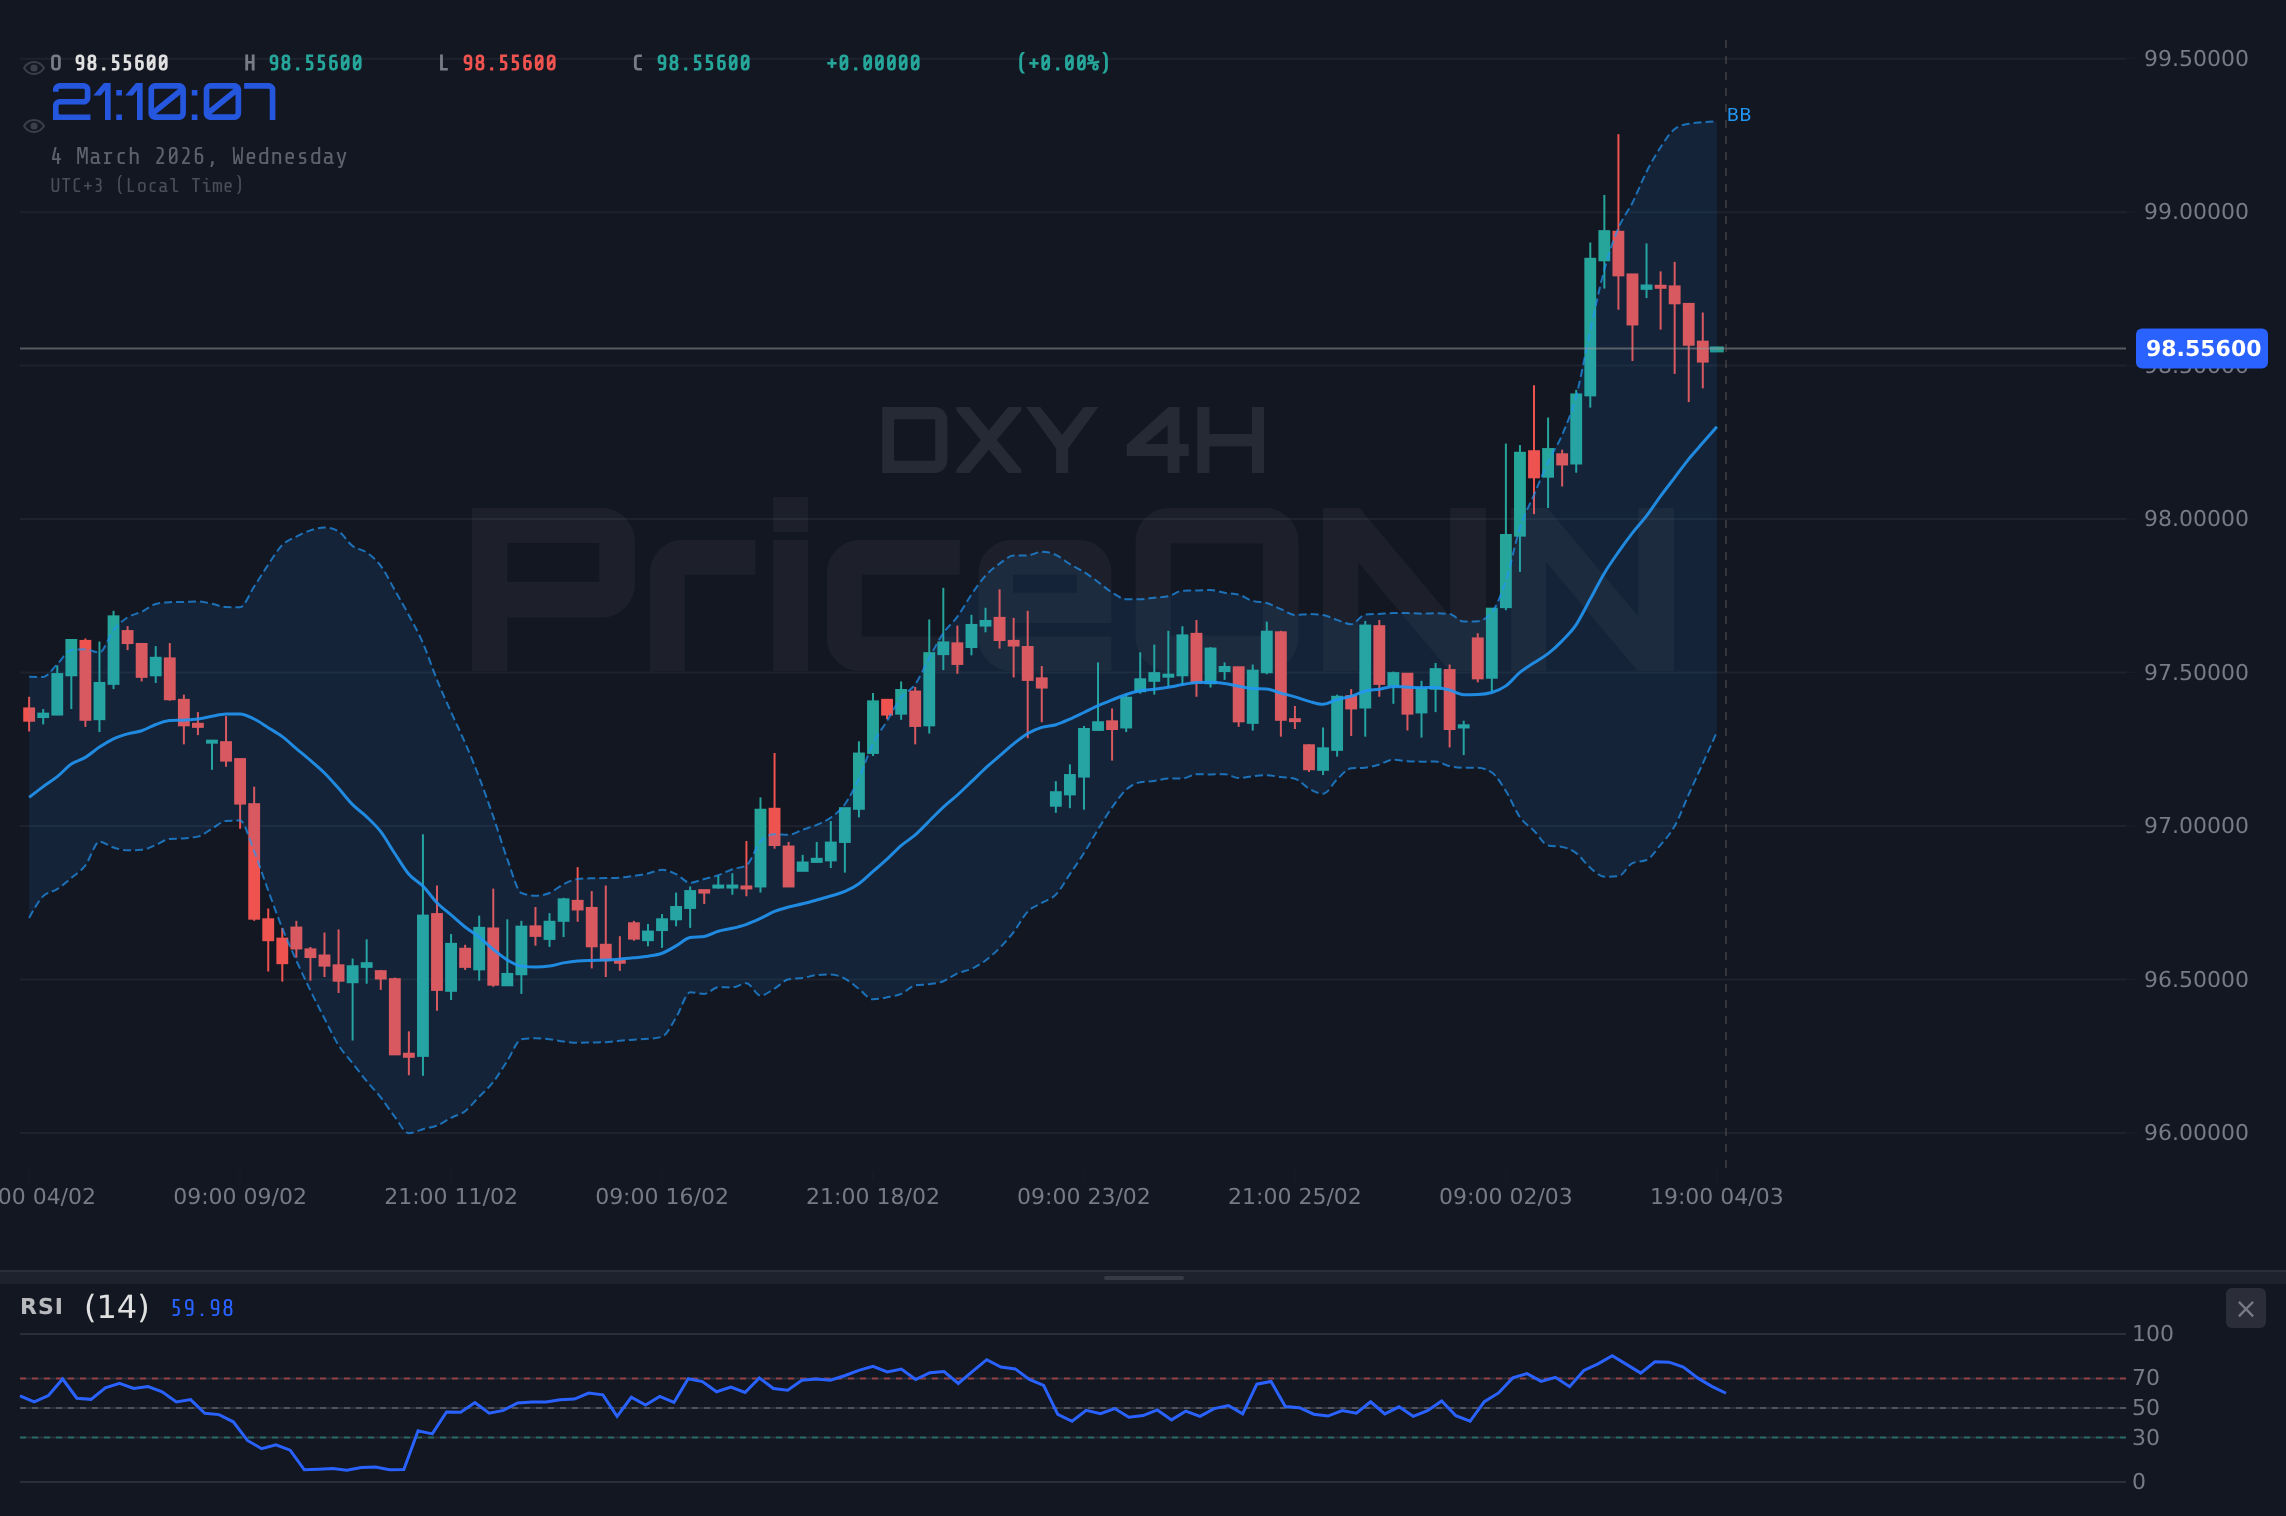
The DXY's current position around $98.56 is a battleground. On one hand, the 4H chart shows an ADX of 42.25, signaling a strong uptrend, but the 1H chart displays an RSI of 49.28, indicating indecision. This contradiction is exactly where traders need to stay nimble. Are we seeing a consolidation before the next leg up, or is this a distribution phase before a sell-off? The answer likely hinges on the upcoming PMI data.
Technical Signals: A Mixed Bag
Digging deeper into the technicals, the daily chart paints a picture of a market in flux. The Stochastic K at 28.23 and D at 36.61 on the 1H timeframe signal a potential short-term pullback. However, the 4H timeframe shows the RSI at 61.42, suggesting that the bulls still have some fight left in them. The MACD histogram on the 4H is positive, further complicating the outlook. It’s a tug-of-war between short-term bearish signals and medium-term bullish indicators. The key is to watch for confirmation signals that align across multiple timeframes.
The PMI Data Wildcard
The economic calendar is throwing a curveball with the upcoming PMI data. The previous reading was 52.7, and any significant deviation from the forecast could trigger a violent reaction in the DXY. Remember, the market is forward-looking, so it's not just the headline number that matters. Traders will be scrutinizing the underlying components for clues about future inflation and growth. A stronger-than-expected PMI could fuel further dollar strength, while a weaker reading could trigger a risk-on rally, sending the DXY tumbling. Monday's manufacturing data came in below expectations - a worrying sign. Traders will be keen to see if Wednesday's data confirms the trend.
Key Levels to Watch: A Trader's Roadmap
For the bulls, reclaiming 98.55 is the first hurdle. A sustained break above this level could open the door to higher targets, with the next resistance levels at 98.61 and 98.67. On the flip side, bears will be eyeing a break below 98.42 as a signal to press their advantage. If this level gives way, the next support levels to watch are 98.36 and 98.29. These levels aren't just arbitrary lines on a chart; they represent key areas where buyers and sellers have historically clashed.
Decoding DXY Correlations
With the DXY at $98.56, it's crucial to understand its impact on other assets. As the DXY strengthens, we often see pressure on gold and major currency pairs. For instance, EURUSD is currently at 1.16287, and further dollar strength could push it lower. Conversely, a weaker DXY could provide a tailwind for risk assets like equities and commodities. Keep a close eye on the SP500 and Nasdaq 100 – their performance can offer valuable clues about overall market sentiment.
News-Driven Volatility: Iran War Fears and Mining Stock Recovery
Recent news has added another layer of complexity to the DXY's outlook. According to Reuters, escalating tensions in the Middle East, particularly involving Iran, initially triggered a commodity sell-off. However, mining stocks have since recovered, suggesting that the market is reassessing the risk. These geopolitical factors can have a significant impact on safe-haven demand, which in turn can influence the DXY. The USD/JPY pair is gaining momentum amid geopolitical tensions and shifting Fed expectations, while gold experiences a dip below $5,100 amid Iran war fears, WTI crude eyes $80.
The Fed Factor: Rate Cut Expectations and Market Repricing
The Federal Reserve's policy outlook remains a key driver for the DXY. Markets are closely watching Fed rate cut expectations, and any shift in these expectations can trigger significant volatility in the dollar. As Bloomberg data shows, markets are repricing Federal Reserve rate cut expectations amid rising oil prices. The next Fed meeting will be crucial in providing clarity on the central bank's intentions. Until then, expect the DXY to remain sensitive to any hints about the Fed's future policy moves.
Manage your risk, wait for your setup - the market always gives a second chance. Patience looks like it will be rewarded here.
Potential Scenarios and Trade Considerations
Given the mixed signals, it's crucial to have a well-defined trading plan. A bullish scenario would involve a break above 98.55, followed by sustained momentum towards 98.61 and 98.67. A stop-loss could be placed below 98.42 to protect against downside risk. Alternatively, a bearish scenario would unfold if the DXY fails to hold above 98.42, opening the door to further declines towards 98.36 and 98.29. In this case, a stop-loss could be placed above 98.55 to limit potential losses.
A break above 98.55 would likely trigger further upside, targeting 98.61 and potentially 98.67. This scenario is supported by the positive MACD histogram on the 4H chart and rising oil prices.
Failure to hold above 98.42 could lead to a deeper pullback, targeting 98.36 and potentially 98.29. This scenario is supported by the negative Stochastic K at 28.23 on the 1H chart.
Frequently Asked Questions: DXY Analysis
Is DXY a good buy right now?
Given the current price of $98.56 and mixed signals, it's not a straightforward buy. A break above 98.55 could signal further upside, but caution is warranted until the PMI data is released.
What is the DXY price forecast for this week?
The DXY price forecast for this week is highly dependent on the upcoming PMI data. A strong reading could push the DXY towards 98.67, while a weak reading could trigger a pullback towards 98.29.
What are the key support and resistance levels for DXY?
Key support levels for the DXY are 98.42, 98.36, and 98.29. Key resistance levels are 98.55, 98.61, and 98.67, all derived from the provided market data.
Why is DXY moving today?
DXY is moving today due to a combination of factors, including fluctuating risk appetite, geopolitical tensions, and anticipation of the upcoming PMI data release, all impacting market sentiment and dollar demand.
The DXY is at a critical juncture near $98.56. The upcoming PMI data will likely determine its next move. Traders should remain nimble and be prepared to react to any surprises. Patience looks like it will be rewarded here.
Track markets in real-time
AI-powered analysis, technical indicators and real-time price data.
Join Our Telegram Channel
Breaking market news, AI analysis and trading signals instantly.
Join Channel