
Ethereum (ETH) is battling between bullish momentum and bearish resistance around the $1,892.28 price level. The question on every trader's mind: is this a genuine reversal, or a well-orchestrated bear trap?
- RSI at 58.89 suggests room for upside, but not yet overbought.
- Critical resistance looms at $1,943.51; a break above could signal further gains.
- The 4H MACD indicates positive momentum, supporting a bullish outlook in the short term.
- Overall, ETHUSD remains range-bound, requiring a decisive breakout to confirm a clear trend.
ETH Bull Case: A Technical Reversal in the Making
The bullish argument for ETH centers around the potential for a technical reversal. Examining the 1-hour chart, the RSI stands at 58.89, indicating that there's room for further upside before ETH enters overbought territory. This suggests that the recent rally has legs, and the bulls could push ETH higher. The MACD also supports this view, with the signal line showing positive momentum. This suggests that buying pressure is building and could lead to a sustained move higher.
Furthermore, the Stochastic K=43.54, D=60.37 indicates that the market is not overbought, suggesting that the current upward trend has more room to run. The ADX at 26.59 suggests that the market is currently experiencing a strong uptrend, which could lead to further gains for ETH. If ETH can break above the immediate resistance at $1,890.4, it could target the next resistance level at $1,943.51.
The broader market context also lends support to the bullish case. The SP500 is currently trading at 6891.8, indicating a positive risk sentiment in the market. This could spill over into the crypto market, benefiting ETH. Additionally, the DXY (Dollar Index) is trading at 97.4, and a weaker dollar could provide a tailwind for ETH.
ETH Bear Case: A Classic Bear Trap
The bearish argument for ETH is that the recent rally is nothing more than a bear trap designed to lure in unsuspecting bulls before a further decline. The 1-day chart shows that ETH is currently trading in a downtrend, with the ADX at 56.46 indicating a very strong downtrend. The RSI at 34.52 suggests that the market is not oversold, suggesting that there is room for further declines. The MACD is also negative, indicating that selling pressure is still present in the market.
The Stochastic K=24.71, D=26.3 also supports the bearish case, with the signal line showing that the market is not oversold and that there is room for further declines. The broader market context also lends support to the bearish case. The DXY is currently trading at 97.4, and a stronger dollar could put pressure on ETH.
Furthermore, the upcoming high-impact economic data releases from the US could trigger a risk-off sentiment in the market, benefiting the dollar and putting pressure on ETH. If ETH fails to break above the immediate resistance at $1,890.4, it could target the next support level at $1,879.13. A break below this level could trigger a sharp sell-off.
Technicals as the Tiebreaker: Multi-Timeframe Analysis
The technical picture for ETH is mixed, with different timeframes painting different stories. The 1-hour chart suggests a potential bullish reversal, while the 1-day chart indicates a strong downtrend. This highlights the importance of multi-timeframe analysis in determining the overall trend.
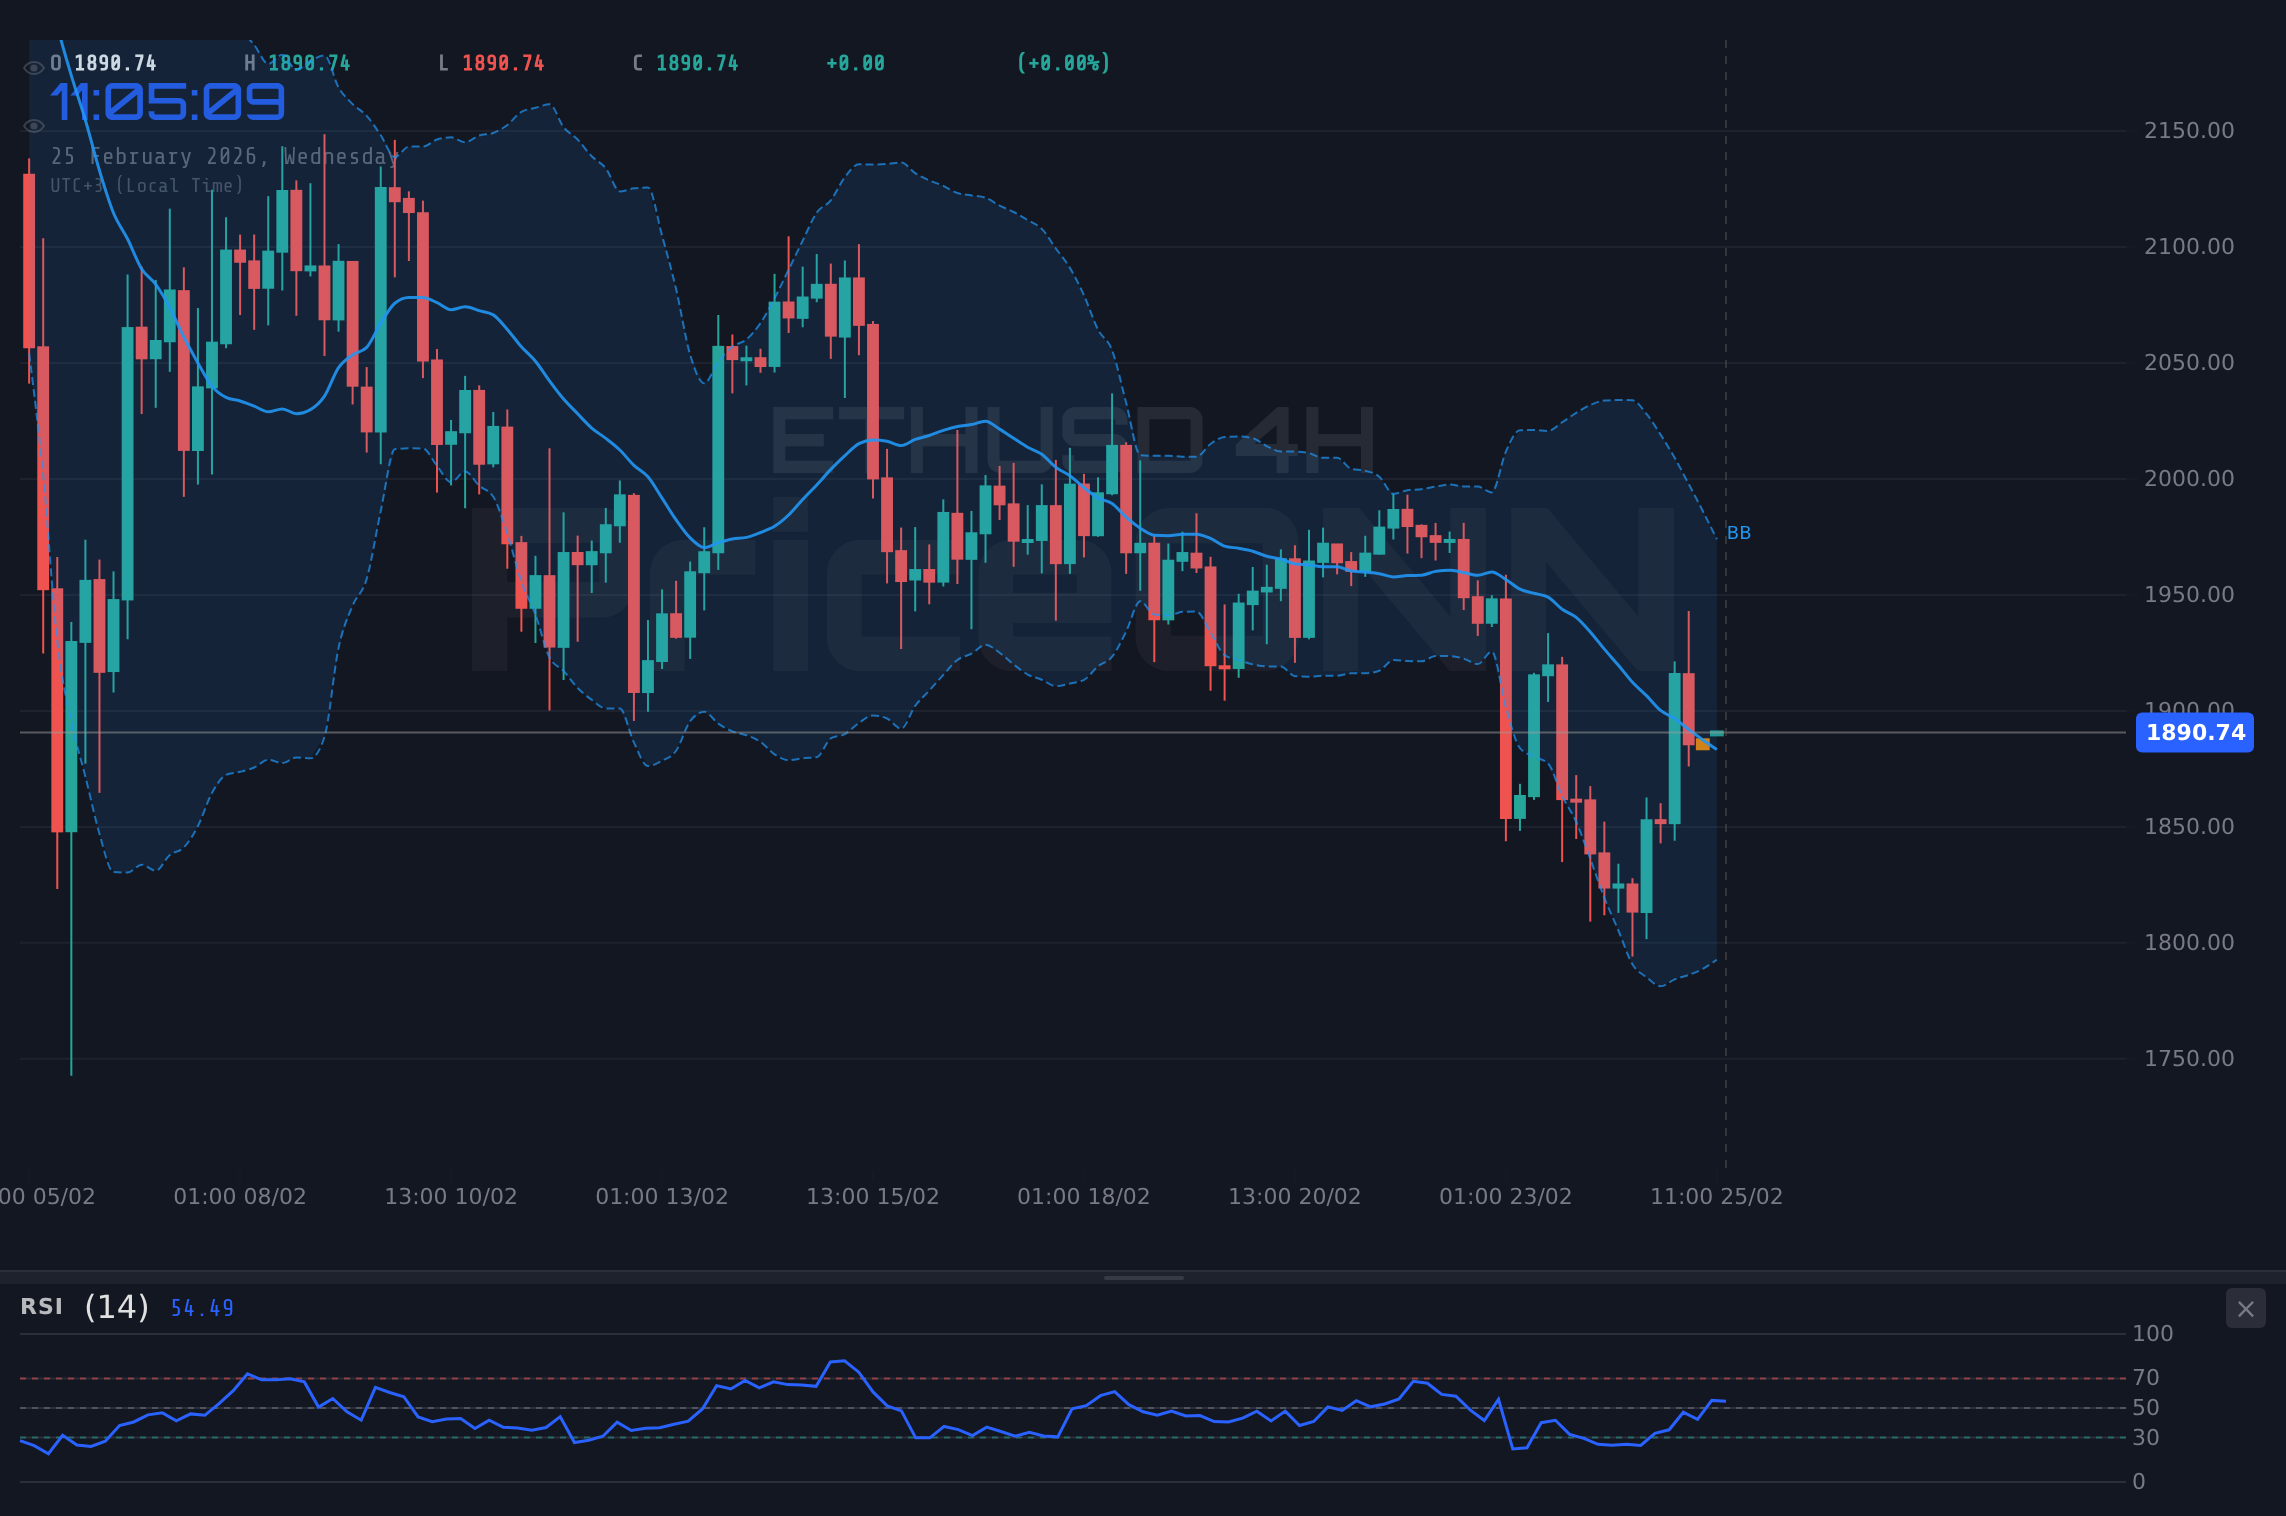
The 4-hour chart provides a more balanced view, with the RSI at 48.72 indicating that the market is neither overbought nor oversold. The MACD is positive, but the Stochastic K=67.15, D=34.32 suggests that the market is not overbought and that there is room for further gains. The ADX at 30.07 indicates a strong uptrend, which could lead to further gains for ETH. If ETH can break above the immediate resistance at $1,943.51, it could target the next resistance level at $1,971.09.
The DowJones30 is showing a neutral trend on the 1D chart, while the SP500 is showing a downtrend, which could indicate some mixed signals in the broader market. With WTI showing an uptrend on the 1D chart and Brent showing an uptrend, this further supports the bullish outlook on ETH.
Trade Plan: Navigating the Uncertainty
Given the conflicting signals, a cautious approach is warranted. While a decisive break above $1,943.51 could signal a sustained move higher, the risk of a bear trap cannot be ignored.
ETH breaks above $1,943.51, targeting $1,971.09 and potentially $2,020.83. This scenario is supported by the positive momentum on the 4H chart and the overall risk-on sentiment in the market.
ETH fails to break above $1,943.51 and retraces towards $1,879.13, potentially breaking lower towards $1,866.19. This scenario is supported by the strong downtrend on the 1D chart and the risk of a stronger dollar.
Navigating the ETHUSD Landscape
The market is currently exhibiting a range-bound pattern, requiring traders to exercise patience and wait for clear signals before committing to a direction. Monitoring the DXY, SP500, and upcoming economic data releases is essential to get a broader understanding of the market. A strong dollar or a risk-off sentiment could trigger a sharp sell-off in ETH, while a weaker dollar or a risk-on sentiment could provide a tailwind for ETH.
Frequently Asked Questions: ETHUSD Analysis
Is ETHUSD a good buy right now?
ETHUSD presents a mixed picture. At $1,892.28, it's testing resistance. A break above $1,943.51 could signal a buy, but caution is warranted due to bearish signals on the daily chart.
What is the ETHUSD price forecast for this week?
The ETHUSD price forecast hinges on breaking $1,943.51 for upside potential to $1,971.09. Failure to break could lead to a test of $1,879.13 support. The probability is 60% bullish, 40% bearish.
What are the key support and resistance levels for ETHUSD?
Key support levels for ETHUSD are at $1,879.13 and $1,866.19. Resistance levels to watch are $1,943.51 and $1,971.09. These levels will dictate short-term price action.
Why is ETHUSD moving today?
ETHUSD's movement today is influenced by a combination of technical factors and broader market sentiment. Positive momentum on the 4H chart, with the market reacting to key resistance levels. The DXY is also a key factor.
Technical Outlook Summary
| Indicator | Value | Signal |
|---|---|---|
| RSI (14) | 58.89 | Neutral |
| MACD Histogram | Positive | Bullish |
| Stochastic | 43.54/60.37 | Bearish |
| ADX | 26.59 | Strong Trend |
| Bollinger | Upper Band | Watch |
Track markets in real-time
AI-powered analysis, technical indicators and real-time price data.
Join Our Telegram Channel
Breaking market news, AI analysis and trading signals instantly.
Join Channel