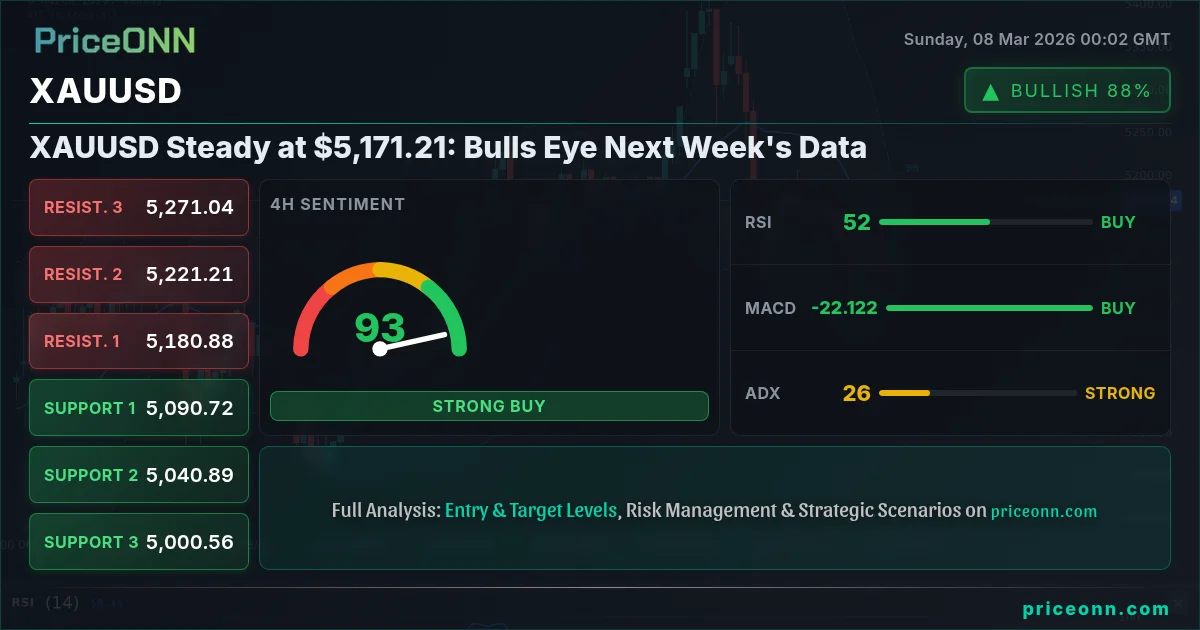
The battle between bulls and bears is intensifying around XAUUSD, currently trading at $5,171.21. The precious metal is showing resilience despite a strengthening dollar, with traders keenly awaiting next week's economic data releases for a definitive directional cue. The tug-of-war is evident in the mixed technical signals, creating uncertainty for both short-term scalpers and long-term investors. A clear breakout above resistance or a breakdown below support will likely dictate the next significant move.
- XAUUSD is trading at a crucial juncture around $5,171.21, with mixed technical signals.
- Key support lies at $5,152.68, tested multiple times this week, while resistance looms at $5,170.44.
- MACD histogram shows positive momentum on the 1H and 4H charts, but negative momentum on the 1D chart, indicating mixed signals across timeframes.
- Fed rate expectations, as reflected in DXY movements, are a key driver of XAUUSD's current volatility.
The Bullish Case for XAUUSD: Safe Haven Demand & Middle East Tensions
The bullish argument for XAUUSD rests on several pillars, primarily its status as a safe-haven asset amid escalating geopolitical tensions. The recent surge in crude oil prices, driven by conflict in the Middle East as reported by PriceONN market news, has injected a dose of uncertainty into the global economic outlook. This uncertainty, in turn, fuels demand for safe-haven assets like gold. Furthermore, the U.S. job market's weakening, as indicated by the latest jobs report, could prompt the Federal Reserve to adopt a more dovish stance on interest rates. Lower interest rates typically weaken the dollar, providing a tailwind for gold. The 1H and 4H charts both show positive MACD momentum, suggesting short to medium term buying pressure. Key support level to watch is $5,152.68, a hold above this level would signal continued bullish momentum.
Looking at the technical indicators, the Relative Strength Index (RSI) on the 1-hour chart is at 65.99, indicating a neutral to slightly bullish sentiment. While not yet in overbought territory, it suggests that buyers are maintaining control. The Stochastic oscillator on the same timeframe shows K=91.42 and D=78.63, which is overbought, signaling a potential short-term pullback. However, the overall trend remains upward as long as gold stays above the 50-period moving average. From a historical perspective, similar geopolitical scenarios have often led to significant rallies in gold prices. In 2022, the onset of the Russia-Ukraine conflict saw gold prices surge to multi-year highs, highlighting its role as a hedge against global instability. Scalpers should watch for breakouts above the immediate resistance at $5,170.44, while swing traders can look for entries near the $5,152.68 support level.
The Bearish Counter-Argument: Dollar Strength & Rising Yields
Conversely, the bearish case for XAUUSD hinges on the strength of the U.S. dollar and rising Treasury yields. The DXY (Dollar Index) currently sits at 98.57, showing signs of resilience despite the weak jobs data. A stronger dollar makes gold more expensive for international buyers, dampening demand. The 1D chart shows negative MACD momentum, indicating that the longer-term trend may still be bearish. The ADX on the 1D chart is at 14.64, indicating a weak trend, but the overall bias is downward. Key resistance level to watch is $5,170.44, a failure to break above this level would signal continued bearish momentum. Furthermore, if the Federal Reserve maintains its hawkish stance despite the recent economic data, Treasury yields could continue to rise, further pressuring gold prices.
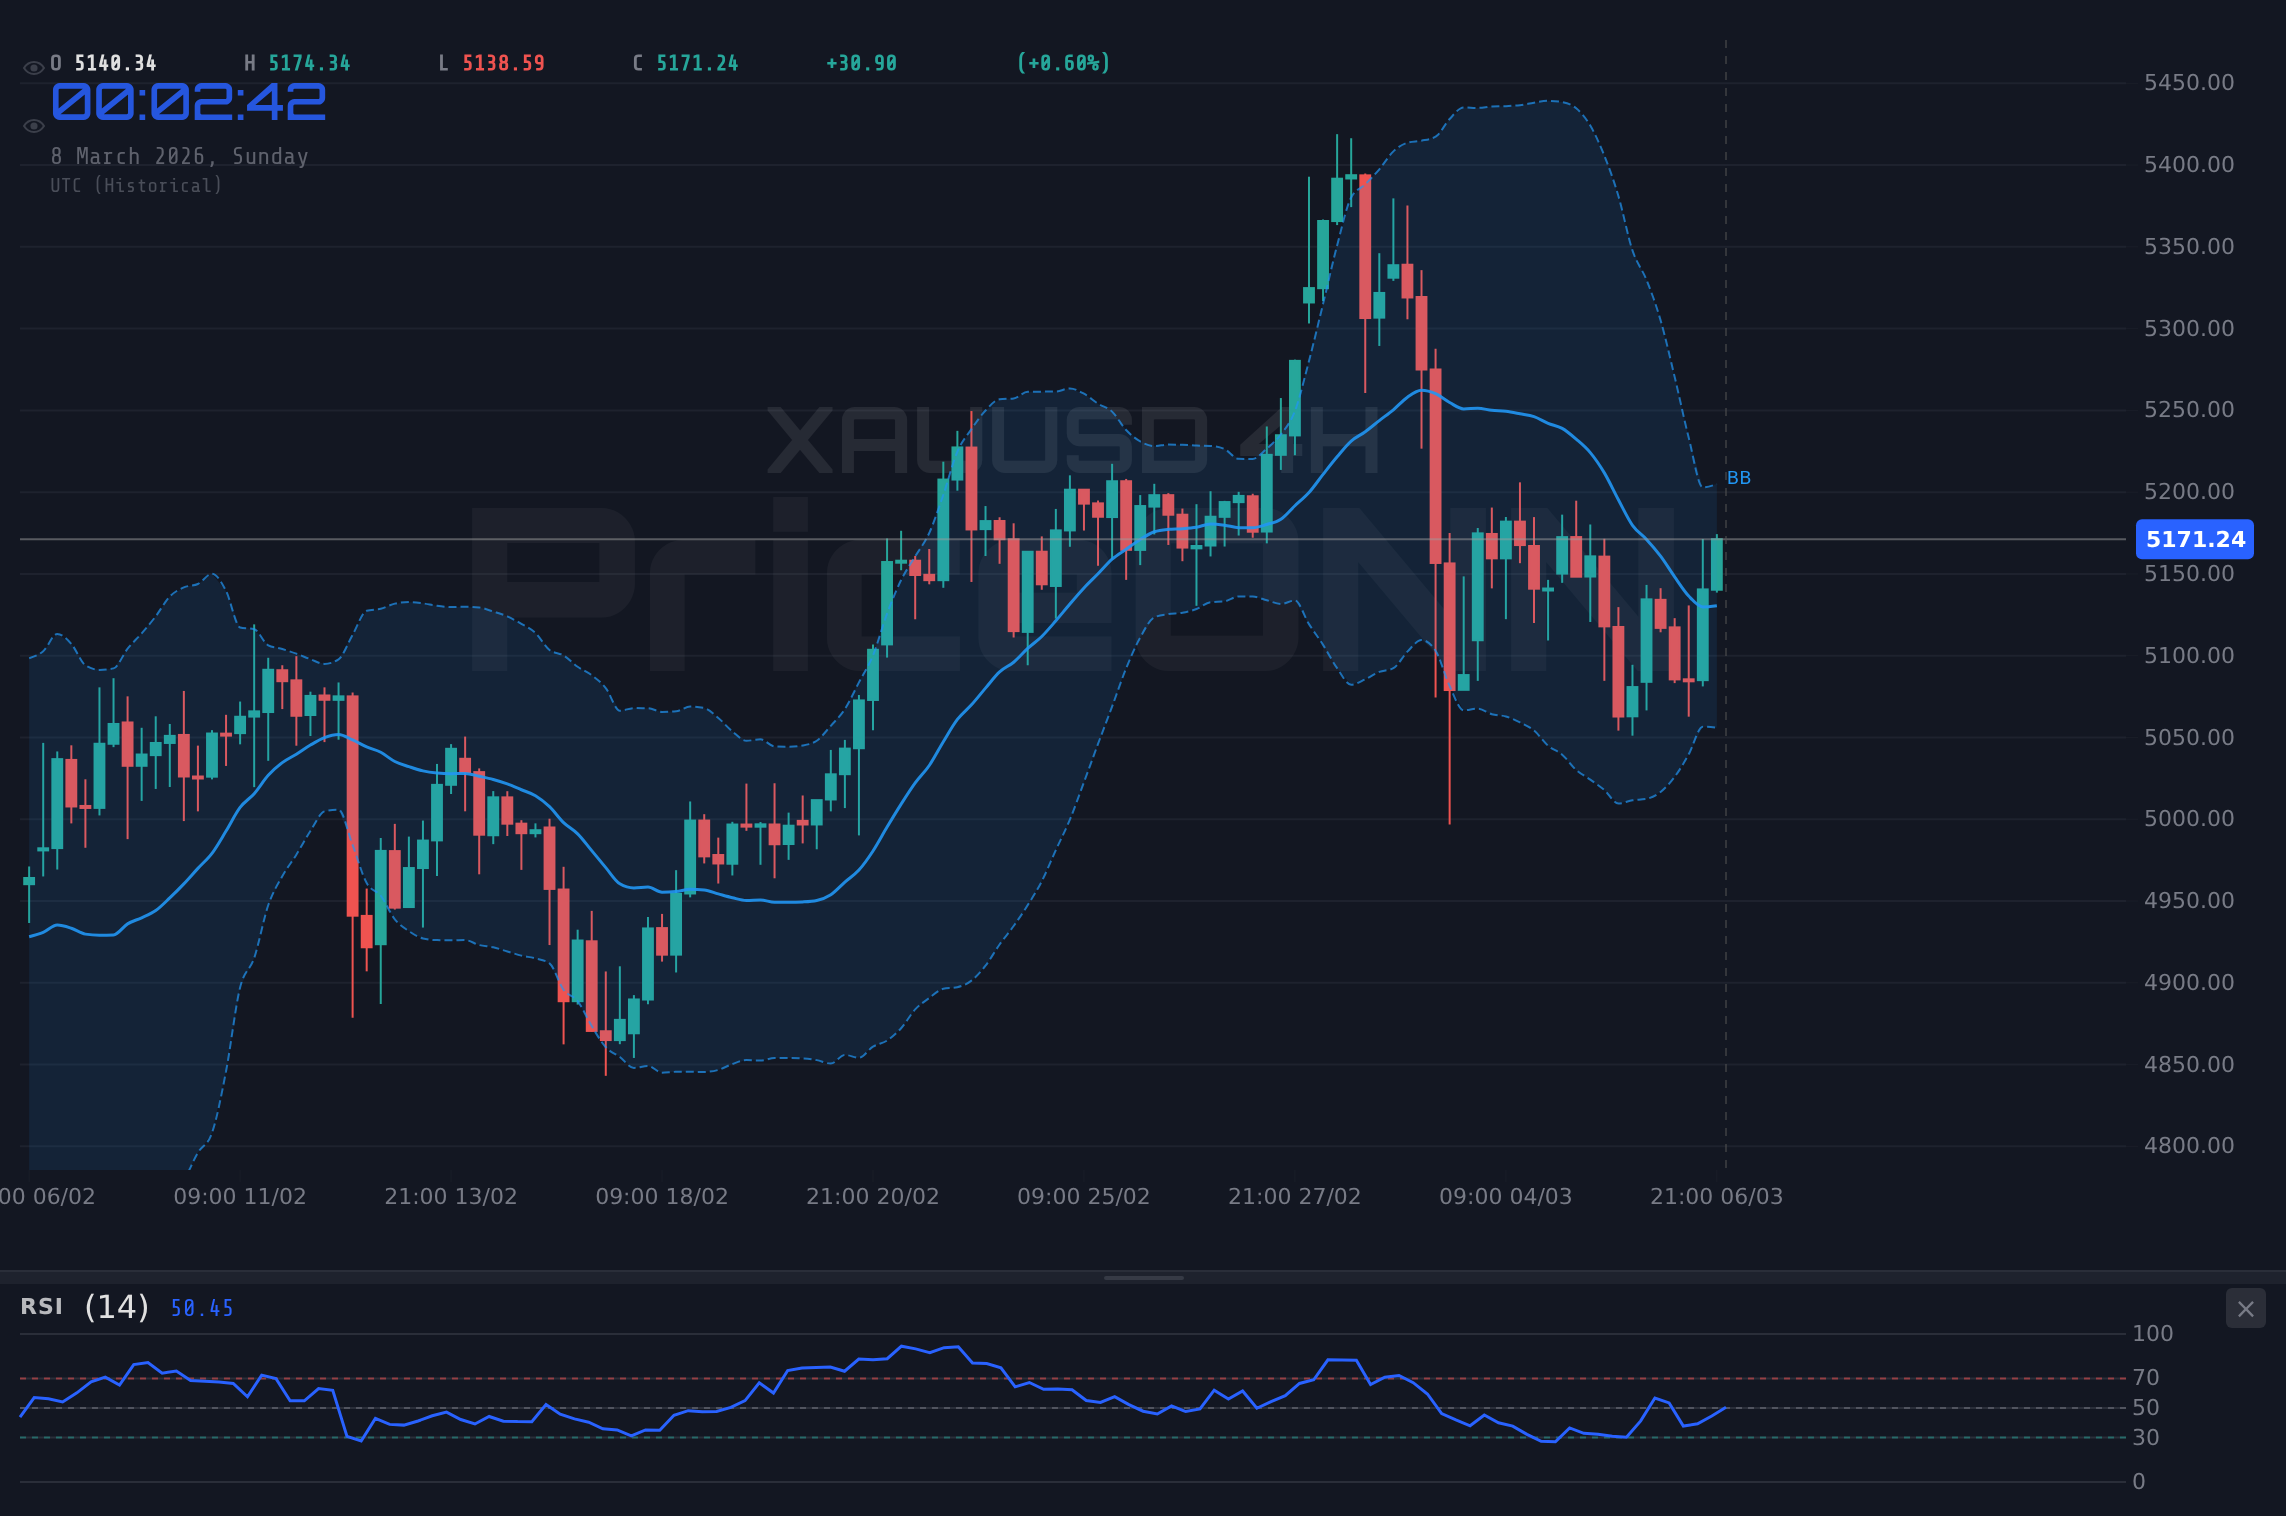
The 4-hour chart presents a mixed picture, with the RSI at 51.86, hovering in neutral territory, and the ADX at 26.87 indicating a strong downward trend. The Stochastic oscillator on the 4H chart shows K=46.85 and D=34.45, suggesting a potential short-term bounce. However, the overall trend remains bearish as long as gold stays below the 200-period moving average. Historically, periods of rising interest rates and a strong dollar have often coincided with periods of underperformance for gold. In the late 1990s, for instance, a strong U.S. economy and rising interest rates led to a prolonged bear market for gold. Swing traders should watch for breakdowns below the immediate support at $5,152.68, while long-term investors may consider hedging their positions if gold fails to hold above the $5,054.88 level.
Technical Tiebreaker: Key Levels and Indicator Alignment
The technical picture for XAUUSD is currently muddled, with conflicting signals across different timeframes. The 1-hour chart suggests short-term bullish momentum, while the 4-hour and daily charts lean bearish. The key level to watch is $5,170.44. A sustained break above this level would signal a potential shift in sentiment, while a failure to break above it would reinforce the bearish bias. The DXY's movement will also be crucial. If the dollar index continues to strengthen, it will likely put downward pressure on gold prices. Conversely, if the DXY weakens, it could provide a boost to XAUUSD.
Looking at the correlation with other asset classes, the SP500 is currently down by 1.07%, indicating a risk-off environment. This could potentially support gold prices as investors seek safe-haven assets. However, Brent crude oil is up by 1.96%, suggesting that inflationary pressures remain elevated. Higher inflation could prompt the Federal Reserve to maintain its hawkish stance, which would be negative for gold. The mixed signals highlight the importance of careful risk management and waiting for clear confirmation before entering any positions. Scalpers should focus on intraday price action around key support and resistance levels, while swing traders and long-term investors should pay closer attention to the broader macroeconomic picture and central bank policy.
XAUUSD Trade Plan: Navigating the Choppy Waters
Given the conflicting signals, a cautious approach is warranted. However, a potential trade setup can be identified based on the 4H timeframe, which shows a stronger downward trend (ADX: 26.87) while the Stochastic indicator suggests oversold conditions, indicating a possible short-term bounce before further decline. This provides a potential opportunity to short XAUUSD on a retest of resistance.
XAUUSD retraces to $5,170.44 resistance, fails to break higher, and then breaks down below $5,152.68 support, targeting lower levels.
Trade Plan: Short XAUUSD
- Entry Trigger: Short at $5,170.44
- Target 1: $5,145.75
- Target 2: $5,134.92
- Stop/Invalidation: $5,181.27
Correlation Analysis: DXY, SP500, and Oil
Understanding XAUUSD's correlation with other assets is crucial for making informed trading decisions. As mentioned earlier, the DXY (Dollar Index) plays a significant role. A rising DXY, currently at 98.57, typically puts downward pressure on gold as it becomes more expensive for holders of other currencies. The SP500, currently at 6743.17, serves as a barometer for risk appetite. A declining SP500 often leads to increased demand for safe-haven assets like gold. However, this correlation is not always consistent, as other factors can also influence gold prices. For instance, rising oil prices, with Brent crude at $65.73 and WTI at a whopping $90.66, can fuel inflation expectations, which can be both positive and negative for gold. On one hand, gold is often seen as an inflation hedge, but on the other hand, higher inflation could prompt central banks to raise interest rates, which would be negative for gold.
Historically, the relationship between gold and these other assets has varied depending on the prevailing economic conditions. During periods of stagflation, for example, gold has often outperformed both equities and bonds. During periods of strong economic growth and rising interest rates, however, gold has often lagged behind. Therefore, it's essential to consider the broader macroeconomic context when analyzing XAUUSD's correlation with other assets. Furthermore, it's important to remember that correlations are not static and can change over time. Therefore, traders should continuously monitor these relationships and adjust their strategies accordingly.
Economic Calendar Watch: Key Data Releases Next Week
Next week's economic calendar is packed with key data releases that could significantly impact XAUUSD. The most important event to watch is the US employment data on March 10. A strong jobs report could reinforce the Federal Reserve's hawkish stance, putting downward pressure on gold. Conversely, a weak jobs report could prompt the Fed to adopt a more dovish stance, providing a boost to gold. The JPY data release on March 9 will also be important, as it could affect the overall risk sentiment in the market. If the data is weak, it could lead to increased demand for safe-haven assets like gold. The EUR data release on March 11 could also have some impact, as it could affect the relative strength of the dollar. If the data is strong, it could weaken the dollar, providing a tailwind for gold. Similarly, the USD data release on March 11 could also impact the overall market sentiment.
Traders should pay close attention to these data releases and adjust their positions accordingly. It's important to remember that the market's reaction to these data releases is not always predictable, so careful risk management is essential. Furthermore, traders should also be aware of any geopolitical developments that could impact gold prices. The Middle East situation remains volatile, and any escalation of tensions could lead to increased demand for safe-haven assets. Therefore, it's essential to stay informed and be prepared to adjust your strategy as needed.
Frequently Asked Questions: XAUUSD Analysis
Is XAUUSD a good buy right now?
Given the current price of $5,171.21 and the mixed technical signals, XAUUSD is not a clear buy right now. A more conservative approach would be to wait for a clear breakout above $5,170.44 resistance or a breakdown below $5,152.68 support before initiating a position.
What is the XAUUSD price forecast for this week?
The XAUUSD price forecast for this week is highly dependent on the upcoming economic data releases. A strong jobs report could push gold down to $5,134.92, while a weak report could lift it to $5,181.27. The probability of either scenario is roughly equal at this point.
What are the key support and resistance levels for XAUUSD?
Key support levels for XAUUSD are $5,152.68, $5,145.75, and $5,134.92. Key resistance levels are $5,170.44, $5,181.27, and $5,188.2. These levels should be closely monitored for potential breakouts or breakdowns.
Why is XAUUSD moving today?
XAUUSD is primarily moving due to a combination of factors, including geopolitical tensions, dollar strength, and economic data releases. The market is currently weighing these factors to determine the next direction for gold.
Track markets in real-time
AI-powered analysis, technical indicators and real-time price data.
Join Our Telegram Channel
Breaking market news, AI analysis and trading signals instantly.
Join Channel