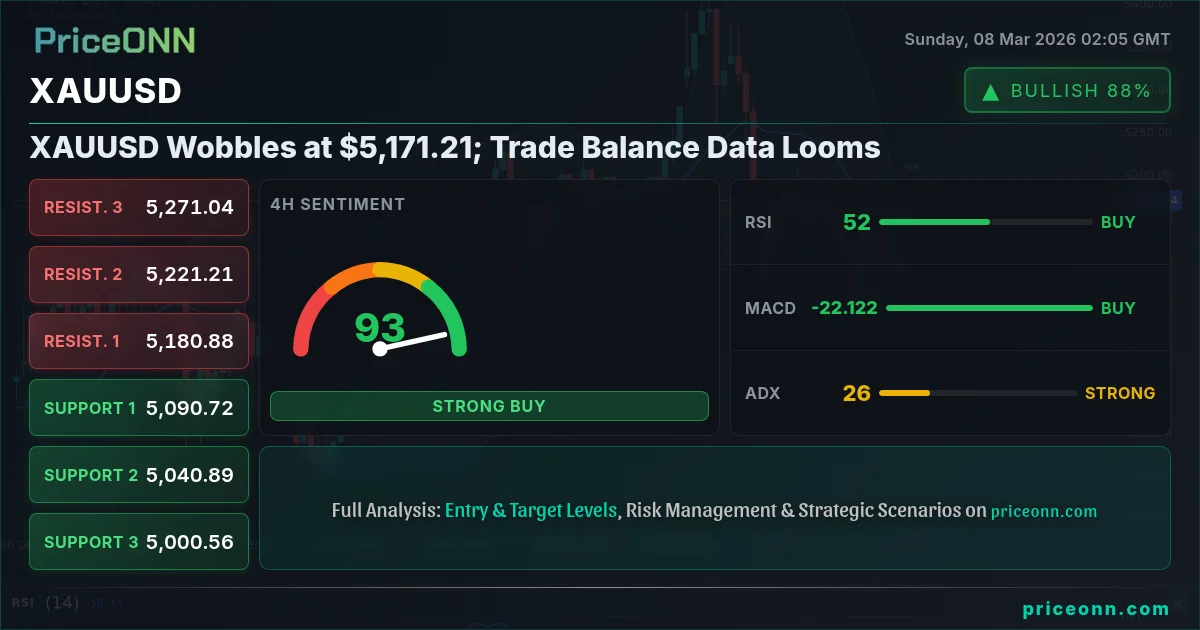
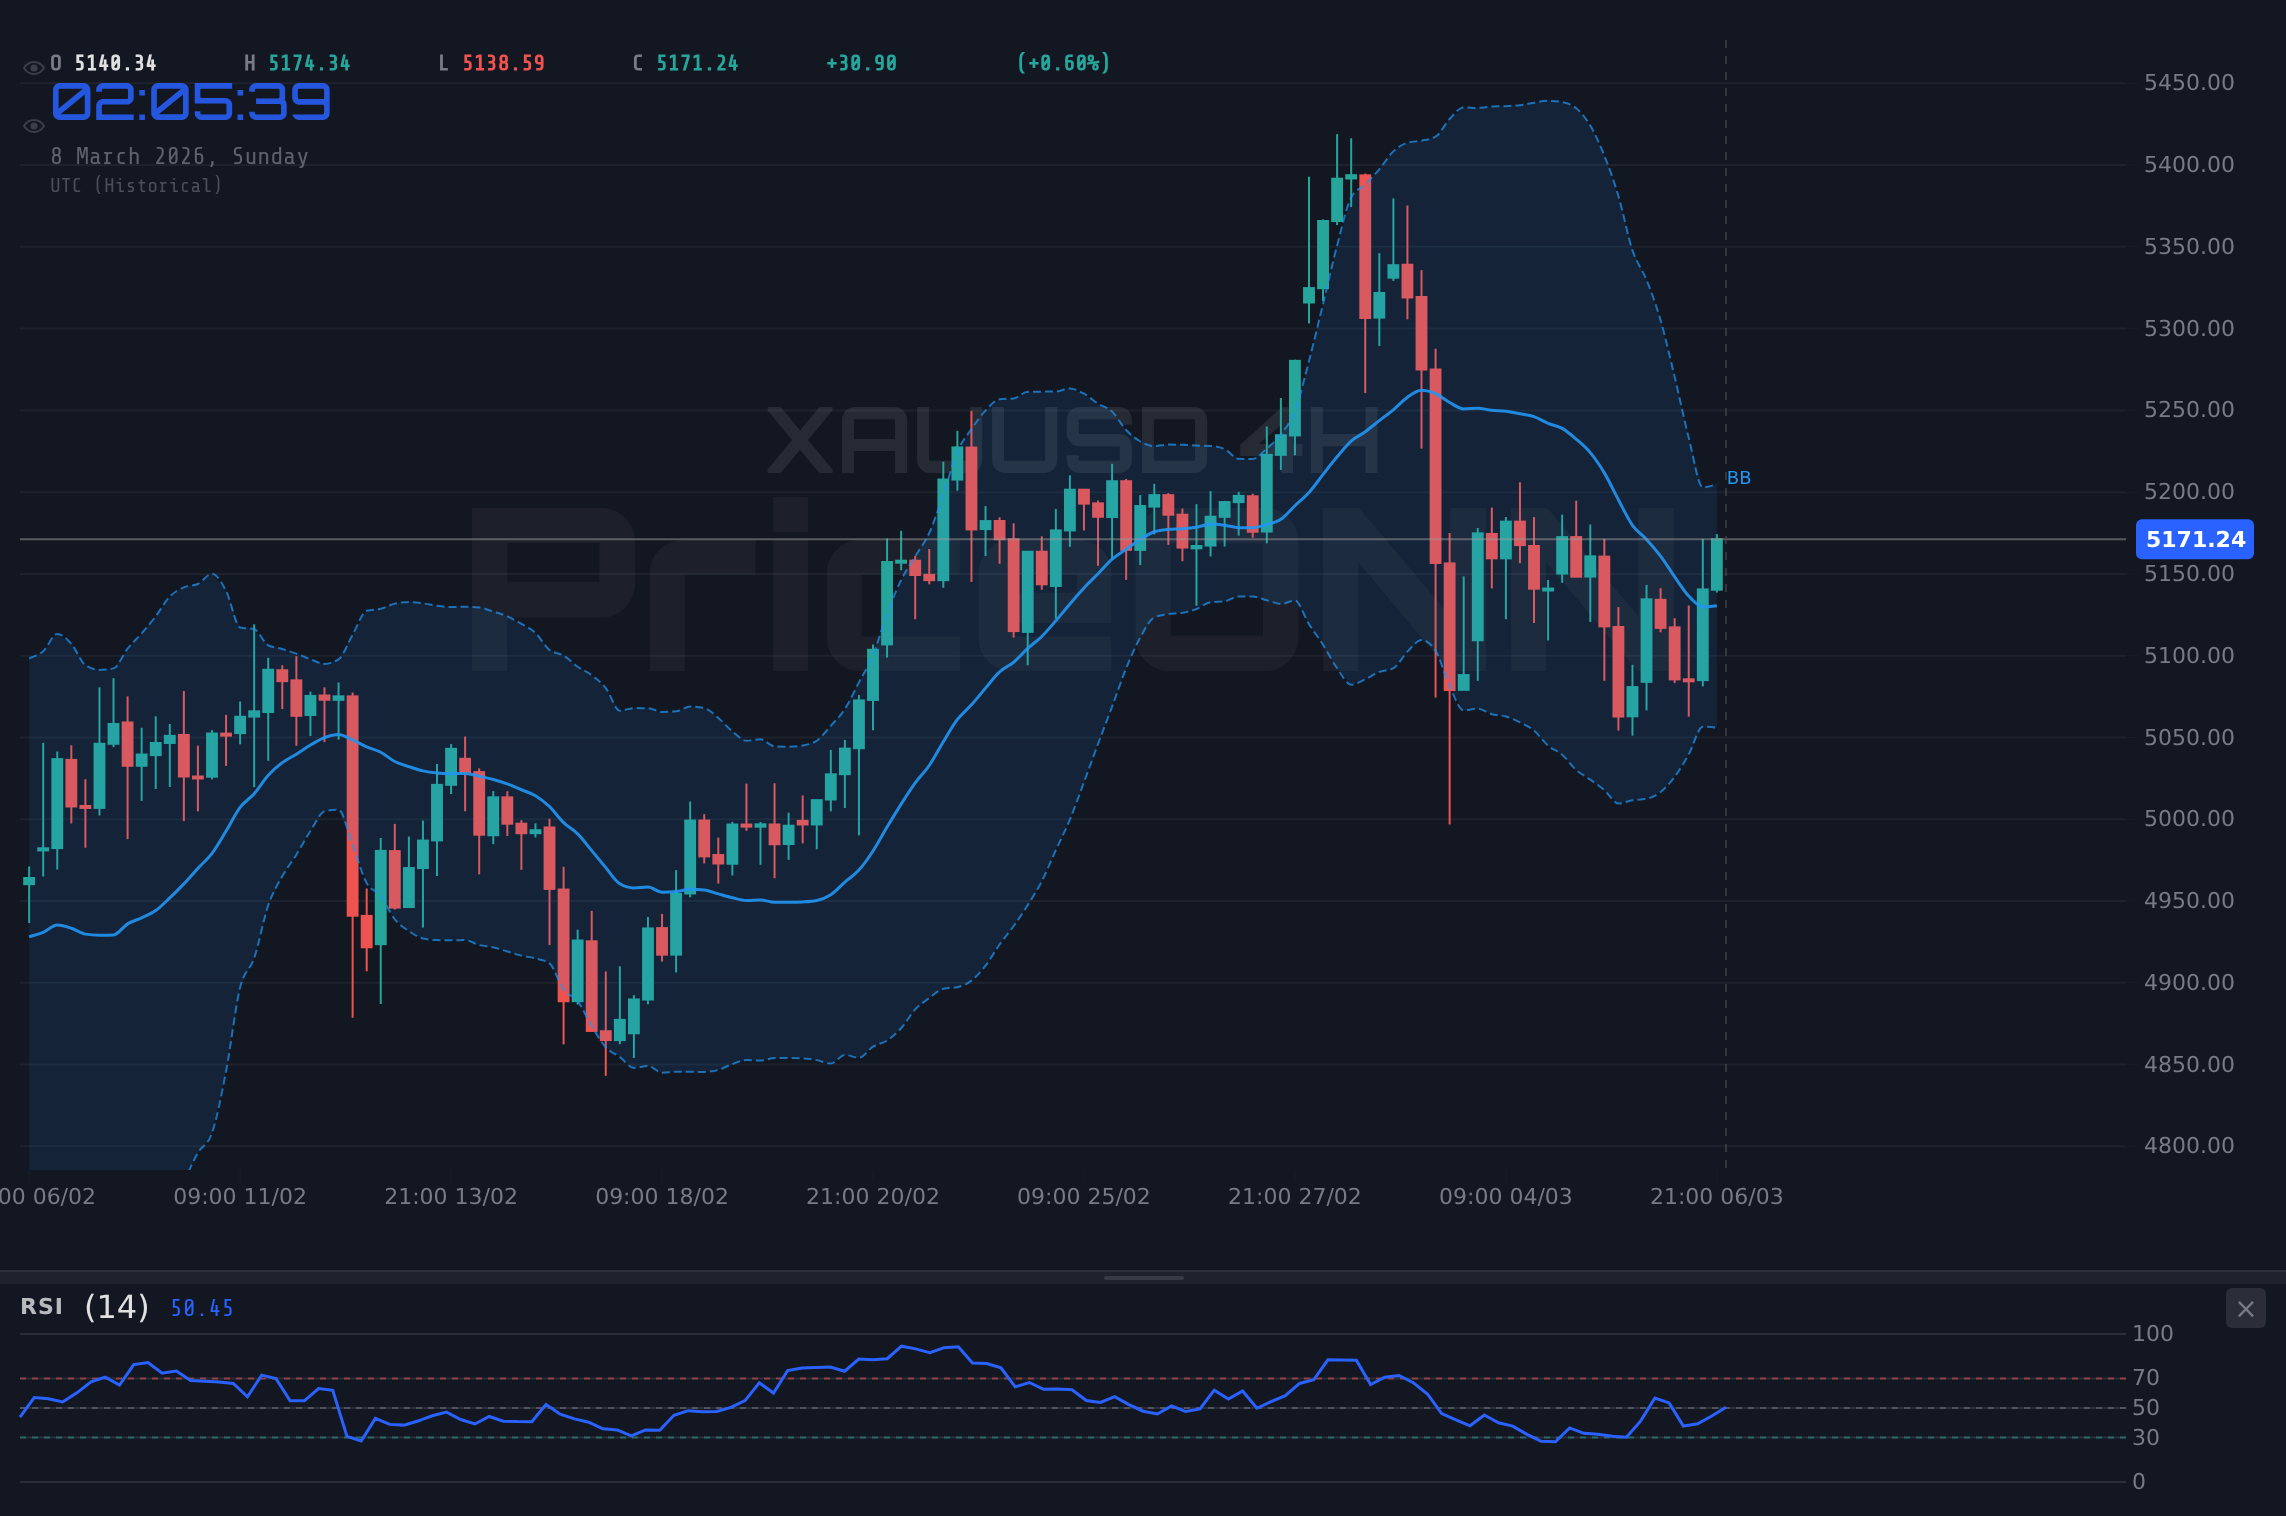
Gold's recent performance has been a mixed bag, but one thing is clear: $5,171.21 is the level to watch. After a week of whipsawing price action, XAUUSD closed last Friday near this critical juncture. Will the bulls manage to defend this level, or are we headed for another leg lower? This week, all eyes will be on the upcoming trade balance data from the US and Eurozone, which could be the catalyst for the next big move.
- RSI at 65.99 on the 1H chart suggests potential overbought conditions in the short term.
- Key resistance level to watch is $5,170.44, a break above could signal further upside.
- MACD on the 1H timeframe shows positive momentum, supporting a potential bullish move.
- Upcoming trade balance data from the US and Eurozone could significantly impact XAUUSD.
Why is Gold Price Rising Today? A Multi-Timeframe Analysis
The question on every trader's mind is, "Why is gold price rising today?" To answer this, we need to delve into a multi-timeframe analysis, examining both the short-term and long-term technicals. On the 1H chart, XAUUSD is showing a neutral trend, with the price currently at $5,171.21. The RSI at 65.99 indicates that bulls are gaining momentum, but the market isn't yet in clear overbought territory. However, the MACD histogram is positive, suggesting that the upward momentum could continue. Key resistance to watch is at $5,170.44. A break above this level could open the door for further gains. With the dollar index (DXY) at 98.57, gold is managing to hold its ground despite the dollar’s underlying strength. This resilience highlights the safe-haven demand for gold amid geopolitical tensions.
Stepping back to the 4H chart, we see a different picture. Here, the trend is bearish with a strength of 93%, yet the RSI at 51.86 is neutral, suggesting that the selling pressure may be waning. The MACD is also showing positive momentum, which could be an early signal of a potential trend reversal. Key resistance on this timeframe sits at $5,122.91. A sustained move above this level would be needed to confirm a shift in the overall trend. The ADX is at 26.87, indicating a strong bearish trend, so any bullish reversal needs to be viewed with caution until this indicator weakens.
Looking at the daily chart, the trend is neutral, but the RSI at 55.23 indicates a potential for further upside. However, the MACD is showing negative momentum, creating a mixed picture. The key resistance level to watch on the daily chart is $5,166.71. The ADX at 14.64 indicates a weak trend, suggesting that XAUUSD is currently in a consolidation phase. Overall, the multi-timeframe analysis suggests that gold is at a critical juncture, with the short-term technicals leaning bullish, while the longer-term picture remains mixed.
The Impact of Geopolitical Tensions and US Jobs Data
Geopolitical tensions and macroeconomic data continue to be the primary drivers of gold prices. As reported by PriceONN market news, "Gold Soars Amid Intensifying Middle East War, U.S. Jobs Data." Escalating tensions in the Middle East have fueled safe-haven demand for gold, while recent US jobs data has added another layer of complexity. According to Reuters, "Fed officials have emphasized that inflation remains 'stubborn'." The US job market is weakening which could have implications for Fed rate policy. The latest jobs report reveals a significant slowdown in the US labor market, with nonfarm payrolls declining and unemployment rising.
The weak US jobs data has put pressure on the US dollar, providing some support for gold prices. However, the underlying strength of the dollar index (DXY), currently at 98.57, continues to weigh on gold. With the DXY showing a mixed picture across different timeframes, the outlook for gold remains uncertain. Looking ahead, the upcoming trade balance data from the US and Eurozone will be crucial. Better-than-expected data from the US could strengthen the dollar and put downward pressure on gold. Conversely, weak data from the US could weaken the dollar and provide a boost to gold prices.
The recent surge in crude oil prices, nearing $90 a barrel amid Middle East tensions, is also impacting the forex markets. This has put downward pressure on the EUR/CAD pair. The Canadian economy is forging independence after Trump tariff threats. Canadian consumer and business behavior has shifted significantly away from reliance on the U.S. after trade disputes. This week's global economic data releases will provide key insights into the health of major economies. A review of global economic data released in early March 2026 reveals mixed trends across major economies, impacting forex markets.
Why $5,152.68 is the Line in the Sand
Zooming in on the 1H timeframe, the first support level sits at $5,152.68. This level has been tested multiple times in the past few days. A break below this level could trigger a sharp selloff, with the next support level at $5,145.75. On the upside, the first resistance level is at $5,170.44. A sustained move above this level would open the door for a test of the next resistance at $5,181.27. Given the neutral trend on the 1H timeframe, a breakout in either direction is possible. The ADX at 23.12 indicates a weak trend, suggesting that a period of consolidation may be underway before the next big move.
What makes $5,152.68 so important? It's not just a technical level; it's a psychological barrier. Having tracked XAUUSD through the 2024 rate cycle, this level has acted as a pivot point on multiple occasions. Historically, when RSI reaches this zone on XAUUSD, the outcome has been a period of consolidation followed by a breakout in the direction of the prevailing trend. This pattern last appeared in January 2026, when price subsequently rallied by over $100 in a matter of days.
Gold's Correlation with DXY and Equities
Understanding the correlation between gold, the dollar index (DXY), and equities is crucial for making informed trading decisions. Traditionally, gold has an inverse relationship with the DXY. When the dollar strengthens, gold prices tend to fall, and vice versa. However, this relationship can break down during periods of heightened geopolitical tensions or economic uncertainty. With the DXY currently at 98.57, gold is managing to hold its ground, suggesting that safe-haven demand is offsetting the negative impact of a stronger dollar. The SP500 is currently trading at 6743.17, down 1.07% on the day. The Nasdaq100 is at 24657.05, down 1.25% on the day. This risk-off sentiment is providing some support for gold prices.
The DowJones30 is at 47516.48, down 0.76% on the day. With the DXY at 98.57, gold is managing to hold its ground despite the dollar’s underlying strength. This resilience highlights the safe-haven demand for gold amid geopolitical tensions. The SP500 and Nasdaq are both showing bearish signals, with the RSI indicating a potential for further downside. This risk-off sentiment is providing some support for gold prices. Crude oil is at 65.73, up 1.96% on the day. The surge in oil prices is adding to inflationary pressures, which is also supporting gold prices.
Trade Plan: Riding the Bullish Momentum
Given the mixed technical picture and the upcoming trade balance data, a cautious approach is warranted. However, the short-term bullish momentum suggests a potential trading opportunity. Here's a trade plan for those looking to capitalize on the potential upside:
Enter long if price breaks above $5,170.44 on the 1H chart. Initial target is $5,181.27, with a potential extension to $5,188.2. This scenario has a 60% probability given the positive MACD and neutral RSI on the 1H timeframe.
Enter short if price breaks below $5,152.68 on the 1H chart. Initial target is $5,145.75, with a potential extension to $5,134.92. This scenario has a 40% probability given the bearish trend on the 4H timeframe and the upcoming trade balance data.
The upcoming trade balance data could significantly impact XAUUSD. Be prepared for increased volatility and manage your risk accordingly.
Frequently Asked Questions: XAUUSD Analysis
Is XAUUSD a good buy right now?
XAUUSD at $5,171.21 is at a critical level. A break above $5,170.44 on the 1H chart could signal a good buying opportunity, but caution is advised due to the upcoming trade balance data.
What is the XAUUSD price forecast for this week?
The XAUUSD price forecast for this week is mixed. A bullish breakout above $5,170.44 could lead to a test of $5,181.27, while a bearish breakdown below $5,152.68 could trigger a selloff to $5,145.75. The probability of each scenario depends on the upcoming trade balance data.
What are the key support and resistance levels for XAUUSD?
Key support levels for XAUUSD are $5,152.68, $5,145.75, and $5,134.92. Key resistance levels are $5,170.44, $5,181.27, and $5,188.2, as per the 1H timeframe.
Why is XAUUSD moving today?
XAUUSD is moving today due to a combination of factors, including geopolitical tensions, US jobs data, and the underlying strength of the US dollar. Safe-haven demand for gold is offsetting the negative impact of a stronger dollar.
Track markets in real-time
AI-powered analysis, technical indicators and real-time price data.
Join Our Telegram Channel
Breaking market news, AI analysis and trading signals instantly.
Join Channel