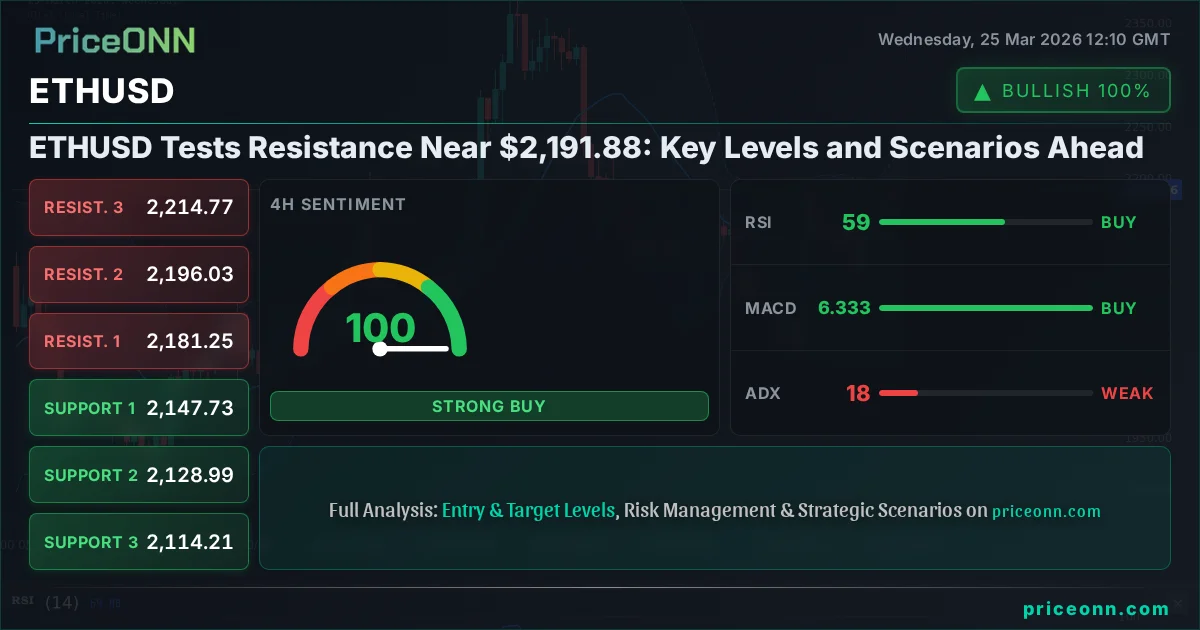
ETHUSD Tests Resistance Near $2,191.88: Key Levels and Scenarios Ahead
ETHUSD trades at $2,191.88, testing resistance. Analysis explores bullish, bearish, and neutral scenarios based on current technicals and market data.
Is ETHUSD poised for a significant move, or will current resistance levels hold firm? At $2,191.88, the second-largest cryptocurrency is testing a crucial price zone, with traders closely watching for a decisive breakout or a sharp reversal. The technical indicators present a mixed picture, highlighting the indecision in the market and the importance of upcoming price action. Understanding the interplay between intraday momentum, broader trends, and potential macroeconomic influences is key to navigating this volatile asset.
- RSI at 68.79 signals growing bullish momentum on the 1H chart, but caution is warranted as it approaches overbought territory.
- Critical resistance sits at $2,193.96 on the 1H chart, a level that must be breached decisively for further upside.
- The ADX at 17.9 on the 4H timeframe suggests a weak trend, indicating potential for ranging or choppy price action.
- The correlation with DXY, currently at 98.98 and showing a mixed signal across timeframes, adds another layer of complexity to ETHUSD's price direction.
The Bull's Roadmap: Breaking Through $2,193.96
Intraday Momentum and Confirmation
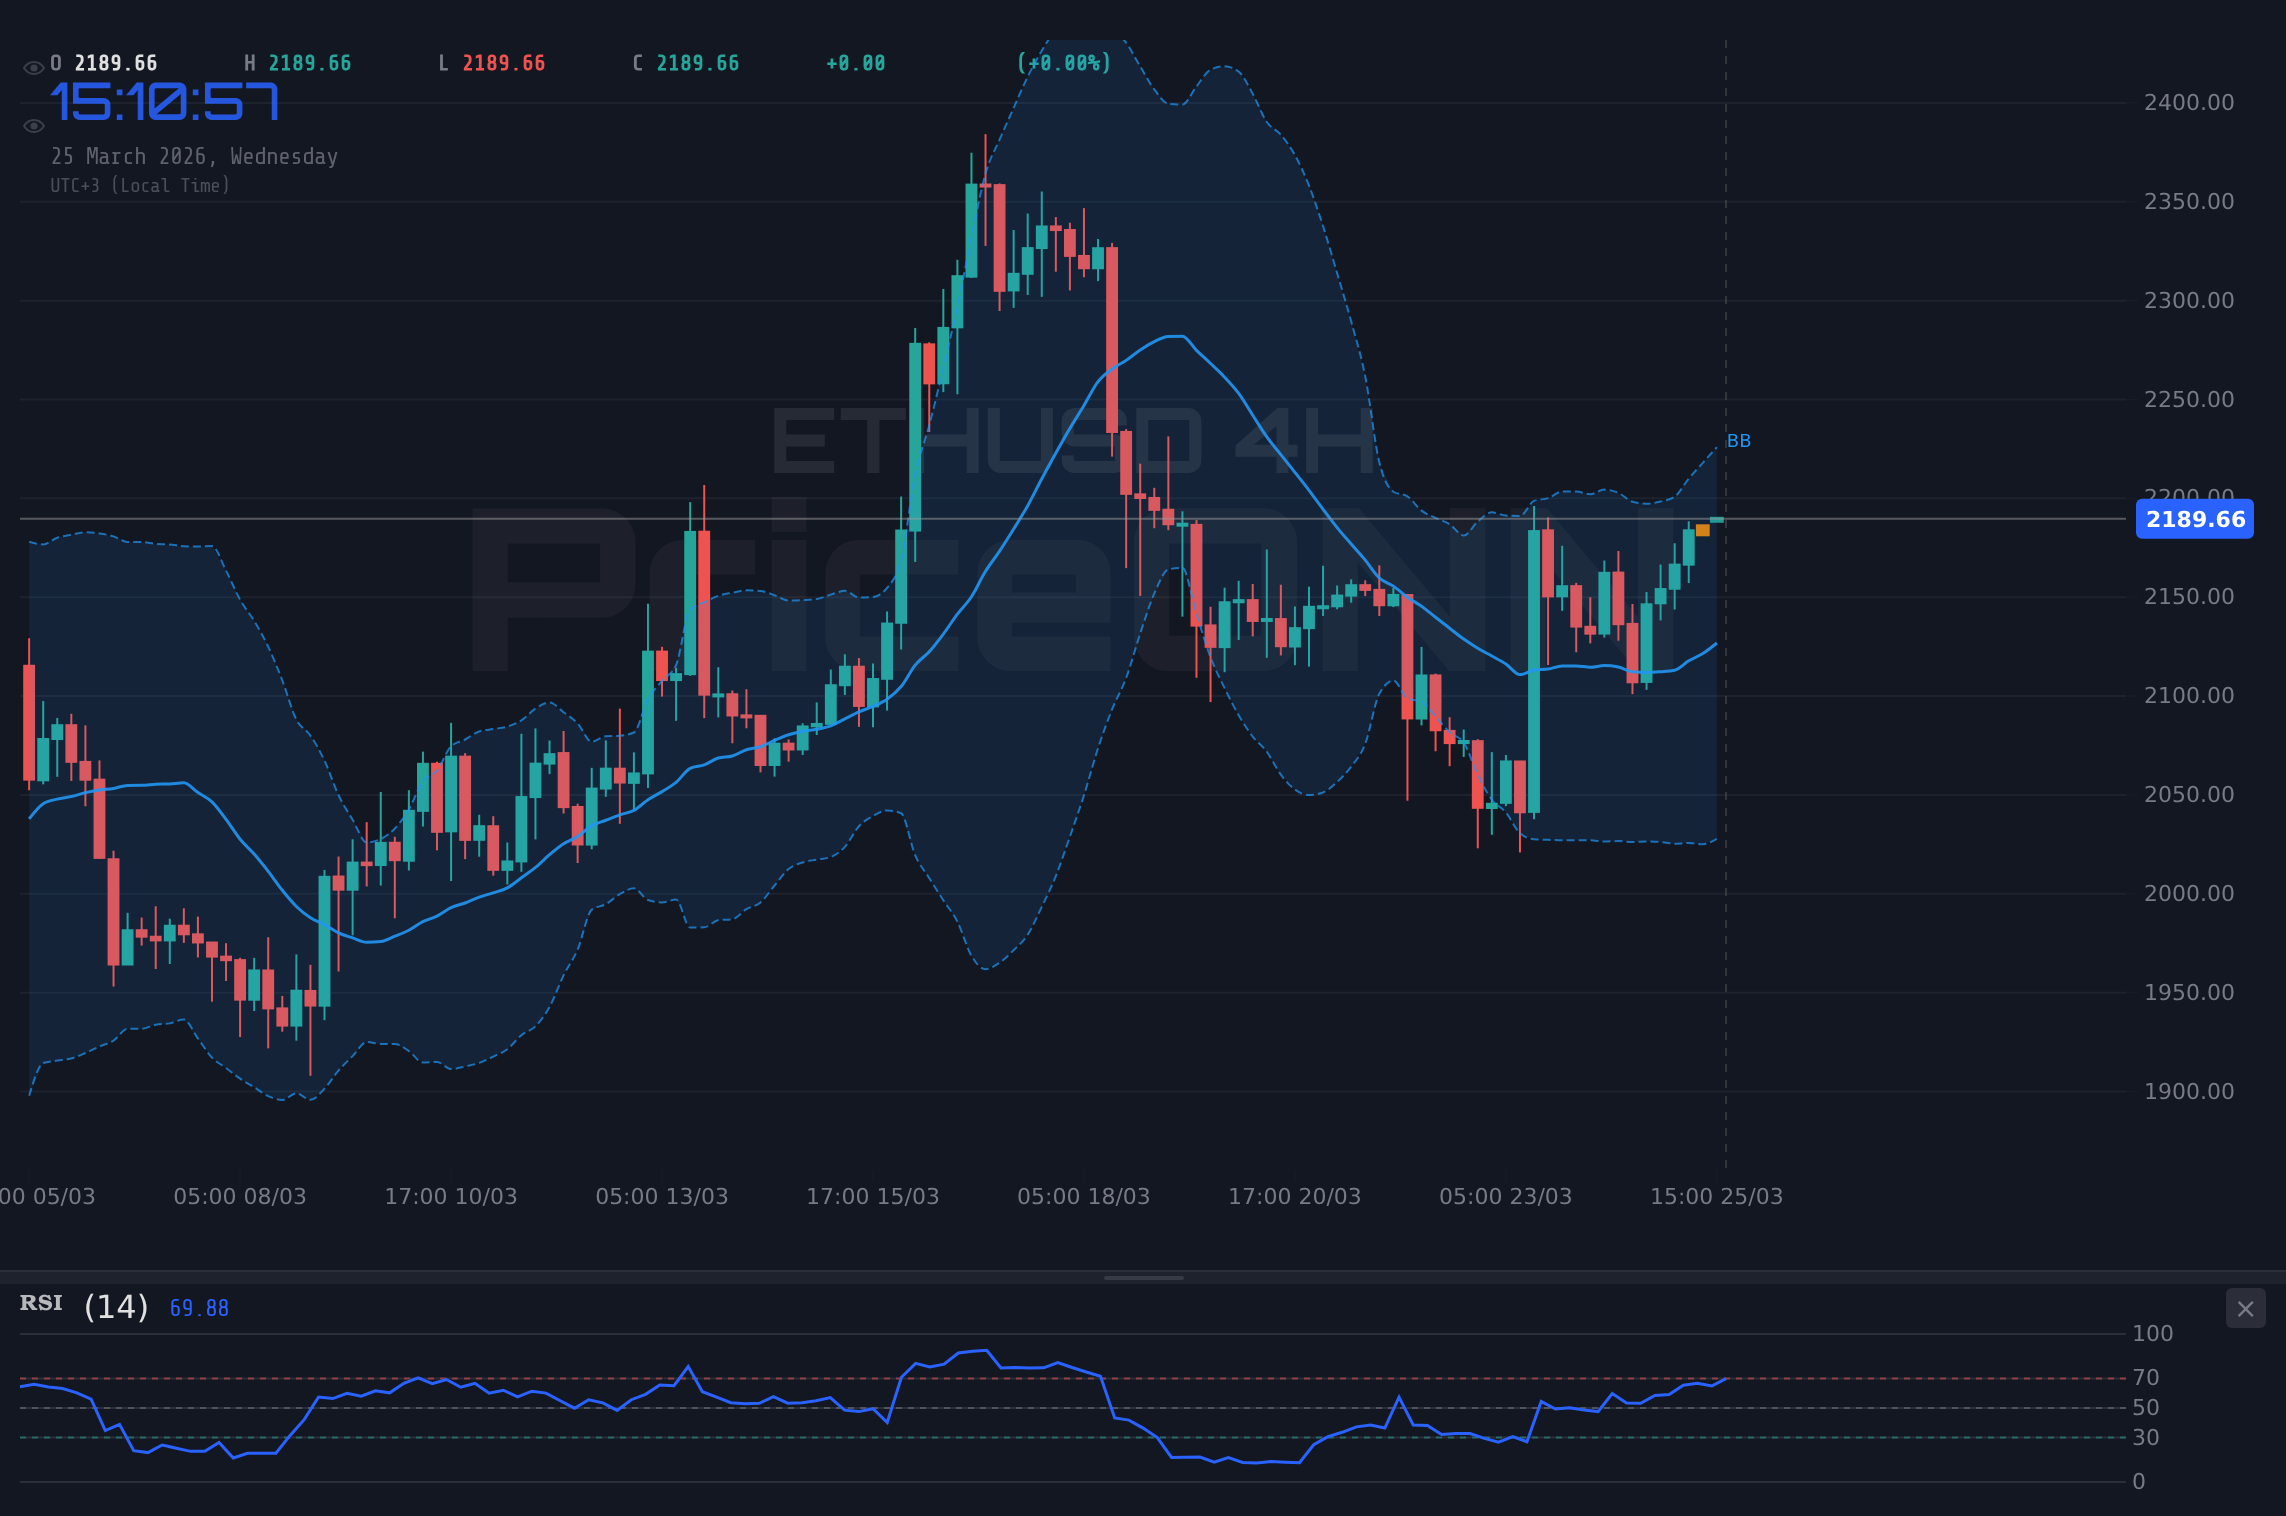
On the 1-hour chart, ETHUSD is showing considerable strength, with the RSI at 68.79 indicating a strong upward momentum. The MACD histogram is positive, and the MACD line is above its signal line, further reinforcing the bullish sentiment in the short term. Stochastic also supports this view, with %K at 89.16 and %D at 73.9, suggesting further upward potential and a bullish crossover. The price is trading above the middle Bollinger Band, hinting at continued upward pressure. The ADX at 21.28, while indicating a moderate trend, is on the rise, suggesting that momentum could be building. For bulls, the immediate objective is to clear the 1-hour resistance at $2,193.96. A sustained push above this level, ideally with increasing volume, could open the door for further gains.
Key Levels for the Bullish Scenario
If ETHUSD successfully breaks and holds above the 1-hour resistance of $2,193.96, the next immediate target would be the 4-hour resistance at $2,196.03. A decisive close above this level could then pave the way for testing the higher 4-hour resistance at $2,214.77. The daily chart, while showing a neutral trend, has a resistance level at $2,179.53, which has already been surpassed, and a higher one at $2,212.64. Therefore, the immediate bullish targets align with the higher resistance levels identified across the shorter timeframes. The overall signal on the 1H and 4H charts leans heavily towards a buy, with 8 buy signals versus zero sell signals on the 1H timeframe, and 8 buy versus 0 sell on the 4H. This short-term strength is a key factor for the bullish case.
Fundamental Undercurrents Supporting Upside
While the immediate price action is driven by technical factors, broader market sentiment can play a crucial role. A weakening US Dollar Index (DXY), currently at 98.98 but showing mixed signals across timeframes, could provide a tailwind for cryptocurrencies like ETHUSD. If the DXY falters, particularly on the daily chart where it shows a potential shift with a Stochastic buy signal, it could reduce the perceived risk in alternative assets. Furthermore, positive news regarding institutional adoption or regulatory clarity, although not explicitly provided in the recent news feed, can always act as catalysts. The current upward move in the Nasdaq 100 (24317.75) and S&P 500 (6628.45) also suggests a generally positive risk appetite, which is generally favorable for riskier assets like ETHUSD. The strength in major equity indices indicates that investors are not shying away from growth assets, potentially allowing ETHUSD to extend its gains.
Where Bears Take Control: Testing Support Below $2,179.53
Signs of Weakness and Divergence
Despite the short-term bullish signals, there are elements that suggest caution. The daily RSI at 54.12, while in neutral territory, shows a slight downward trend, which could indicate waning momentum over the longer term. The MACD on the daily chart is positive but has shown some flattening, and the Stochastic indicator on the daily timeframe, while showing a buy signal (%K at 39.56, %D at 31.51), is still relatively low compared to the overbought levels seen on shorter timeframes. The ADX on the 4H chart at 17.9 indicates a weak trend, which often precedes periods of consolidation or reversal. If the bullish momentum falters, the first line of defense would be the 1H support levels, starting at $2,178.54, followed by $2,174.59, and then $2,170.83. A break below these levels could signal a shift in sentiment.
Critical Levels for a Bearish Reversal
A sustained break below the 1H support at $2,170.83 would be a significant bearish signal. This would then bring the 4H support at $2,147.73 into focus. If selling pressure intensifies, the next key support level on the 4H chart is $2,128.99, and further down, $2,114.21. The daily chart also presents a support level at $2,107.13. A move below these significant support zones would invalidate the short-term bullish outlook and suggest a deeper correction. The daily trend, while currently neutral, has a strong downward ADX reading of 18.91, implying that a downtrend, if initiated, could gain significant traction. The daily MACD, although positive, could also turn negative if selling pressure mounts, reinforcing the bearish case.
External Factors and Risk-Off Sentiment
A shift towards risk aversion in the broader market could quickly impact ETHUSD. If equity markets like the S&P 500 (6628.45) and Nasdaq 100 (24317.75) experience a sharp downturn, it would likely trigger a sell-off in riskier assets, including cryptocurrencies. The DXY's behavior is also critical here; if the dollar index were to surge upwards from its current 98.98 level, it would typically exert downward pressure on ETHUSD. Geopolitical tensions, while not explicitly detailed in the provided news for ETHUSD, can also contribute to a risk-off environment. Any escalation of global conflicts or unexpected economic shocks could lead investors to seek perceived safe-haven assets, pulling capital away from speculative investments like cryptocurrencies.
The Waiting Game: Consolidation Around $2,170 - $2,190
Navigating the Neutral Zone
The current technical indicators present a scenario where ETHUSD might enter a period of consolidation. The neutral trend strength (50%) on both the 1H and 4H charts, combined with the weak ADX (17.9 on 4H), suggests that neither buyers nor sellers have a clear upper hand. Prices could oscillate between the immediate support and resistance levels, creating a choppy trading environment. In this scenario, traders might look for range-bound strategies, buying near support and selling near resistance. However, the volatility inherent in the crypto market means that even within a consolidation phase, sharp, short-lived moves can occur, often driven by news or order flow. The Stochastic indicators on the 1H and 4H charts are in elevated zones, which can sometimes precede sideways movement or indicate exhaustion before the next directional move.
Factors Maintaining Indecision
Several factors could contribute to a prolonged period of indecision. The mixed signals from longer-term indicators, such as the daily RSI hovering around 54.12 with a slight downward trend, prevent a strong conviction buy or sell signal. The upcoming economic calendar, though not featuring major US events today, could still introduce volatility if any unexpected data emerges or if market participants begin to price in future policy shifts. The lack of clear directional confirmation from the DXY also adds to the ambiguity. In such a neutral environment, traders often adopt a wait-and-see approach, preferring to enter positions only after a clear trend has been established or key levels have been decisively broken. This could lead to ETHUSD trading within a defined range for a period.
The Role of Liquidity and Order Flow
Within a consolidation phase, liquidity becomes a critical factor. If liquidity is thin, even moderate buying or selling pressure can cause significant price swings. Traders will be watching for any unusual spikes in volume that might indicate a large player entering or exiting the market. Order book depth and the placement of significant buy and sell walls can also provide clues about potential turning points within the range. The absence of strong directional cues from indicators like ADX means that price action itself, and the volume accompanying it, will be the primary guide. This phase is often characterized by false breakouts or breakdowns, making it challenging for shorter-term traders.
Market Sentiment and Probability Assessment
Weighing the Evidence
Analyzing the technical indicators across different timeframes provides a nuanced view. The 1H and 4H charts predominantly show bullish signals, with strong RSI readings and positive MACD momentum. However, the daily chart presents a more cautious picture, with a neutral trend and RSI hovering around the midpoint. The weak ADX readings on the 4H and 1H charts suggest that the current momentum might not be sustainable for a strong trend continuation. The Stochastic indicators, particularly on the 1H and 4H, are in elevated territory, which could signal an impending pullback or consolidation, even if the immediate trend is up. The overall signals lean bullish in the short term, but the lack of strong daily trend confirmation and the presence of resistance levels create significant headwinds.
Scenario Probabilities
Given the current technical landscape, the most probable scenario appears to be a period of consolidation followed by a potential continuation of the uptrend if key resistance is broken. The bullish signals on shorter timeframes are compelling, but the resistance at $2,193.96 and the neutral daily trend temper the enthusiasm. Therefore, I assign a higher probability to the neutral scenario initially, with a strong leaning towards the bullish outcome if resistance is cleared. The bearish scenario remains a possibility, especially if broader market sentiment turns negative or key support levels are breached.
What I'm Watching This Week
My focus this week will be on a few key triggers. Firstly, the ability of ETHUSD to decisively break and hold above the $2,193.96 resistance level on the 1H chart. Confirmation would require sustained buying pressure and ideally, a positive close above this mark. Secondly, I'll be monitoring the DXY's movement, particularly its reaction to any upcoming US economic data. A significant rise in the dollar could put pressure on ETHUSD. Finally, the performance of major equity indices like the S&P 500 and Nasdaq 100 will be crucial. A continued risk-on environment would support ETHUSD's bullish case, while a sell-off could trigger a sharp decline.
Bullish Scenario: Breaking Resistance
55% ProbabilityNeutral Scenario: Consolidation Phase
35% ProbabilityBearish Scenario: Support Breakdown
10% ProbabilityFrequently Asked Questions: ETHUSD Analysis
What happens if ETHUSD breaks above the $2,193.96 resistance level in the short term?
If ETHUSD breaks and holds above the $2,193.96 resistance on the 1H chart, the bullish scenario becomes more probable. The immediate target would be $2,196.03, with potential extension towards $2,214.77.
Should I buy ETHUSD at current levels near $2,191.88 given the RSI at 68.79?
Buying at current levels requires caution. While the 1H RSI at 68.79 shows bullish momentum, it's approaching overbought territory. A more prudent approach might be to wait for a confirmed breakout above $2,193.96 or a pullback to support levels around $2,170.83.
Is the ADX reading of 17.9 on the 4H chart a sell signal for ETHUSD?
An ADX of 17.9 indicates a weak trend, suggesting choppy or ranging price action rather than a strong directional sell signal. While it doesn't confirm a bullish trend, it implies that the current upward move might lack strong conviction and could lead to consolidation.
How might the DXY at 98.98 affect ETHUSD's price this week?
The DXY is showing mixed signals across timeframes. If it strengthens significantly from 98.98, it could put downward pressure on ETHUSD. Conversely, a weaker dollar would likely support ETHUSD's bullish case, especially if equity markets remain strong.
| Indicator | Value | Signal | Interpretation |
|---|---|---|---|
| RSI (14) | 68.79 | Bullish | Strong momentum on 1H, approaching overbought. Neutral on 1D. |
| MACD Histogram | Positive | Bullish | Positive momentum on 1H/4H, flattening on 1D. |
| Stochastic | K=89.16, D=73.9 (1H) | Bullish | Overbought on 1H/4H, potential for pullback. Crossover on 1D. |
| ADX | 21.28 | Neutral | Moderate trend strength on 1H, weak on 4H (17.9), strong downtrend on 1D (18.91). |
| Bollinger | Middle Band | Bullish | Price above middle band on 1H/4H/1D, suggesting upward pressure. |
Track markets in real-time
AI-powered analysis, technical indicators and real-time price data.
Join Our Telegram Channel
Breaking market news, AI analysis and trading signals instantly.
Join Channel