Nasdaq 100 Tests $24,287.02 Resistance Amidst Trump Speech Uncertainty
Nasdaq 100 hovers near $24,287.02, facing resistance. Traders watch for catalysts amid mixed signals and geopolitical undertones.
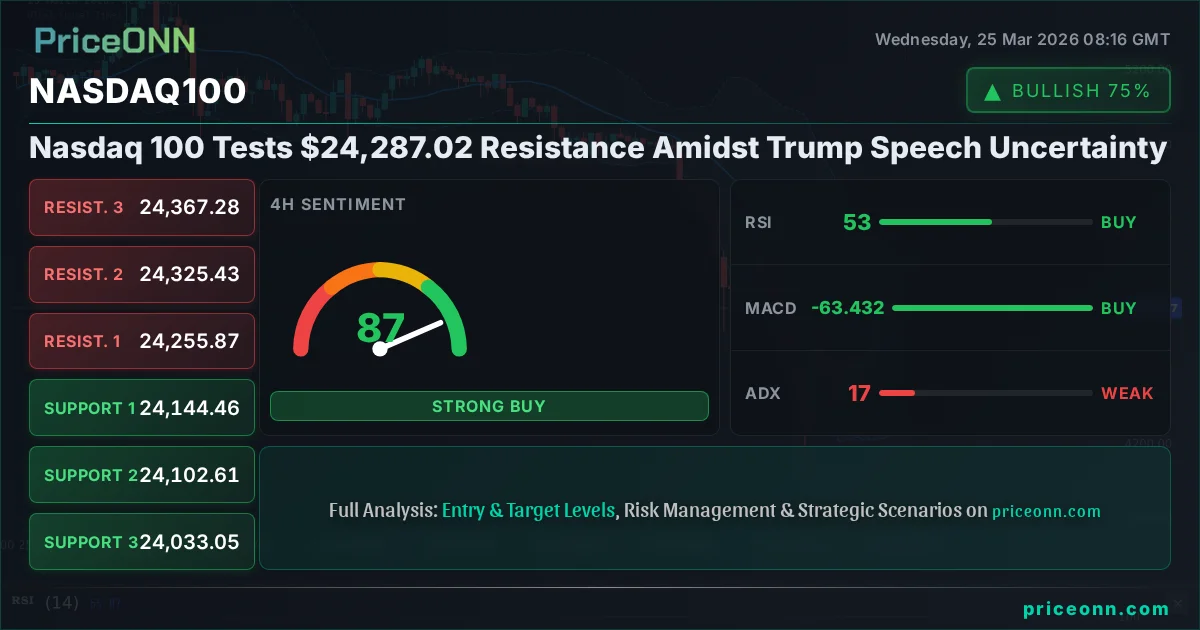
The Nasdaq 100, currently trading at $24,287.02, is in a critical zone, testing resistance levels as traders digest a complex mix of technical signals and emerging geopolitical narratives, particularly around anticipated speeches. This isn't a moment for blind directional bets; it's a time for meticulous analysis, understanding the confluence of factors that could tip the scales. Having tracked the tech-heavy index through its recent volatility, it's clear that while short-term momentum indicators offer some bullish signals, the broader trend and underlying market structure demand caution. The question isn't just *if* resistance will hold, but *what* confirmation we need to see before committing to a trade. The ADX reading, for instance, at 16.5 on the 4-hour chart, clearly indicates a lack of strong directional conviction, suggesting that any move above current levels might be fragile without sustained buying pressure.
- RSI at 59.66 on the 1H chart signals rising momentum, but remains in neutral territory, not yet indicating overbought conditions.
- Critical resistance sits at $24,287.02, the current price, with further levels at $24,376.04 (R1) and $24,561.23 (R2) on the daily chart.
- MACD histogram shows positive momentum on the 1H and 4H charts, but the daily MACD remains under its signal line, suggesting short-term optimism versus longer-term caution.
- DXY at 99.05 is showing a neutral to slightly bullish trend on the 1H, potentially creating headwinds for the Nasdaq 100 if it continues to rise, especially given its inverse correlation.
Navigating the Resistance Zone: What the Charts Are Saying
The Nasdaq 100's current position around $24,287.02 is a pivotal point. On the 1-hour chart, the trend is neutral with a strength of 50%, but a flurry of 'Buy' signals from shorter-term indicators like RSI (59.66) and Stochastic (K=61.26, D=56.16) suggest a degree of intraday buying interest. The MACD is also showing positive momentum, sitting above its signal line. However, this short-term optimism clashes with the daily outlook. The 1-day chart paints a different picture: a strong downward trend (96% strength) with RSI at 41.01, MACD below its signal line, and Bollinger Bands hugging the lower half of the price range. This divergence between timeframes is crucial. It tells us that while intraday traders might be finding opportunities, the longer-term trend is still decidedly bearish, with significant resistance overhead. The ADX at 45.68 on the daily chart further reinforces this, indicating a strong existing downward trend that any upward move is currently battling against. This isn't a market that's screaming 'buy the dip' on a daily basis; it's one where pullbacks might be looking for further downside.
The immediate resistance is the current price itself, $24,287.02. A break and sustained hold above this level on the 1-hour chart would be the first sign of bulls regaining control. However, the real test lies higher up. The first significant resistance level from the daily data is $24,376.04, followed by $24,561.23. These are the levels that need to be decisively cleared for any significant bullish reversal to take hold. Conversely, support levels are critical for gauging downside risk. The nearest support on the 1-hour chart is $24,258.12, but the more robust daily support levels are found at $23,963.42 (S1), $23,735.99 (S2), and $23,550.8 (S3). A break below $23,963.42 would signal a continuation of the dominant daily downtrend, likely triggering further selling pressure as stop-loss orders are hit.
The Shadow of Geopolitics and Macro Factors
While the technical picture is complex, it's impossible to ignore the broader market forces at play. The anticipated speech from Donald Trump, for example, carries significant weight. Historically, his pronouncements have caused market volatility, often impacting sentiment towards risk assets like the Nasdaq 100. Traders will be scrutinizing his words for any hints on trade policy, geopolitical stances, or economic outlook, any of which could dramatically shift market sentiment. This uncertainty itself can lead to choppy price action and make it difficult for trends to establish firm footing, as evidenced by the weak ADX readings on shorter timeframes.
Correlations with other markets are also vital. The Dollar Index (DXY) is currently at 99.05, showing a neutral to slightly bullish trend on the 1-hour chart. A rising DXY typically exerts downward pressure on risk assets and commodities, including gold and potentially the Nasdaq 100, especially if it signals a flight to safety or hawkish monetary policy expectations. While the DXY's daily trend is also neutral, its upward momentum on the 1-hour chart warrants attention. If the dollar strengthens further, it could act as a drag on the Nasdaq 100, making it harder for the index to overcome overhead resistance. Conversely, if the DXY falters, it could provide some relief to riskier assets. The interplay between geopolitical rhetoric, potential shifts in the dollar's strength, and the Nasdaq 100's technical levels creates a delicate balance.
Furthermore, the performance of other major indices provides context. The S&P 500 is trading at 6623.9, showing a bullish inclination on the 1-hour and 4-hour charts, but a strong downtrend on the daily timeframe. The Nasdaq 100 often moves in lockstep with its broader market counterparts, but tech stocks can be more sensitive to shifts in risk appetite. The fact that both the S&P 500 and Nasdaq 100 show a daily bearish trend (100% strength for Nasdaq) while their shorter timeframes suggest some intraday buying is a classic sign of a market in consolidation or facing significant headwinds. The strength of the daily downtrend, with an ADX of 45.68 for the Nasdaq 100, suggests that the bears are in a stronger long-term position, and any rallies may be viewed as opportunities for them to re-enter the market at better prices.
The divergence between short-term bullish signals and the dominant daily downtrend on the Nasdaq 100, coupled with geopolitical uncertainty, suggests a high degree of risk. A daily close below the $23,963.42 support level would likely confirm the continuation of the bearish trend, while a sustained break above $24,376.04 resistance is needed to signal a potential shift.
The 'Watch Zone' Scenario: What Needs to Happen?
The current technical condition for the Nasdaq 100, particularly the ADX reading of 16.5 on the 4-hour chart, firmly places it in a 'Watch Zone.' This isn't a setup that screams for immediate action. Instead, it's a scenario where patience is paramount. The market is exhibiting a lack of strong directional conviction on intermediate timeframes, making any trade a gamble without further confirmation. The conflicting signals between the daily bearish trend and the intraday bullish attempts create a neutral environment that requires careful navigation. For a valid bullish setup to emerge, we need to see a decisive break and hold above key resistance levels. Specifically, a daily close above the $24,376.04 resistance level would be the first strong indication that buyers are truly stepping in and the bears are losing their grip. This would need to be accompanied by increasing volume and perhaps a shift in shorter-term indicators moving out of overbought or oversold territory and aligning with the bullish move.
Conversely, a bearish setup would be confirmed by a failure to overcome immediate resistance and a subsequent break of the nearest significant support. The daily support at $23,963.42 is the critical line in the sand. If the Nasdaq 100 closes a daily candle decisively below this level, it would validate the dominant bearish trend and open the door for a move towards the subsequent support levels. This breakdown would likely be accompanied by increasing bearish momentum on indicators like the MACD and a move into oversold territory on oscillators like RSI and Stochastic. Until one of these clear directional breaks occurs, the market remains in a state of flux, where aggressive positions are ill-advised.
This 'Watch Zone' nature is precisely why the decision is 'WATCH_ZONE' with a score of 1/8. The confluence of a weak ADX, mixed signals across timeframes, and external uncertainties means the risk/reward ratio for immediate trades is unfavorable. It's a period where observing price action, waiting for confirmation, and managing risk are the primary objectives. Scalpers might find opportunities within the intraday ranges, but for swing and position traders, the prudent approach is to wait for a clearer signal or a more defined trend to develop. The market is offering a complex puzzle, and forcing a solution now could lead to unnecessary losses.
Bearish Scenario: Trend Continuation
65% ProbabilityNeutral Scenario: Range-Bound Consolidation
25% ProbabilityBullish Scenario: Breakout Confirmation
10% ProbabilityThe Path Forward: Actionable Insights for Traders
For active traders, the current environment around the Nasdaq 100 at $24,287.02 presents a tactical challenge. The intraday charts show some bullish momentum, with RSI at 59.66 and MACD positive on the 1-hour timeframe. This suggests that short-term bounces are possible, and strategies focused on capturing these intraday moves might be viable. However, the overarching daily trend remains bearish, with an ADX of 45.68 indicating strong downward momentum. This means that any bullish trades should be managed with tight stops, looking to exit quickly if the price action reverses. The key level to watch for a potential bullish confirmation is a daily close above $24,376.04. Until then, treating rallies as potential selling opportunities within the broader downtrend is a more risk-averse approach.
For those looking for a clearer directional setup, the strategy is simple: wait for confirmation. If the price breaks decisively below $23,963.42, the path of least resistance is lower, targeting $23,735.99 and potentially $23,550.80. This would align with the strong daily bearish trend indicated by the ADX and MACD. On the flip side, if the index can consolidate above $24,287.02 and then break through $24,376.04 with increasing volume and positive daily indicators, a more sustained rally could be initiated, targeting $24,561.23 and beyond. The current weak trend readings (ADX 16.5 on 4H) mean that a breakout needs to be strong and sustained to be trusted. It's a market that is currently offering more questions than answers, and acting prematurely could be costly. Patience and discipline in waiting for the market to provide clearer signals will be key to navigating this period effectively.
The recent news regarding oil prices and their potential impact on inflation, alongside geopolitical developments, adds another layer of uncertainty. While crude oil (Brent at $98.91, WTI at $88.33) is showing some bearish signs on shorter timeframes, the daily trend for both remains bullish, suggesting potential inflationary pressures that could influence central bank policy and, consequently, risk assets like the Nasdaq 100. This macro backdrop reinforces the need for caution. The correlation with the DXY, currently at 99.05 and showing some upward bias on the 1-hour chart, also suggests potential headwinds if the dollar continues to strengthen. Ultimately, the Nasdaq 100 is at a crossroads, and traders must remain vigilant, focusing on risk management and waiting for the market to reveal its next directional conviction.
Frequently Asked Questions: Nasdaq100 Analysis
What happens if Nasdaq 100 breaks above the $24,376.04 resistance level?
A sustained daily close above $24,376.04 would signal a potential bullish reversal, invalidating the current daily downtrend. This could open the door for targets at $24,561.23 (R2) and potentially $24,788.66 (1D Resistance), supported by increasing bullish momentum across timeframes.
Should I buy Nasdaq 100 at current levels of $24,287.02 given the mixed signals?
Buying at current levels of $24,287.02 is not recommended due to the prevailing daily bearish trend and weak ADX readings. A more prudent approach is to wait for a confirmed break above $24,376.04 or a decisive break below $23,963.42 for a clearer trading setup.
Is the RSI at 59.66 a buy signal for Nasdaq 100 right now?
An RSI of 59.66 on the 1-hour chart indicates rising momentum but is still within the neutral zone, not yet an overbought signal. While it supports intraday bullishness, it doesn't override the stronger daily bearish trend, suggesting caution is still warranted.
How will the potential Trump speech affect Nasdaq 100 this week?
Geopolitical uncertainty stemming from anticipated speeches can increase market volatility for the Nasdaq 100. Any rhetoric regarding trade policy or economic outlook could lead to sharp price swings, potentially triggering a breakout or breakdown from current levels around $24,287.02.
Track markets in real-time
AI-powered analysis, technical indicators and real-time price data.
Join Our Telegram Channel
Breaking market news, AI analysis and trading signals instantly.
Join Channel