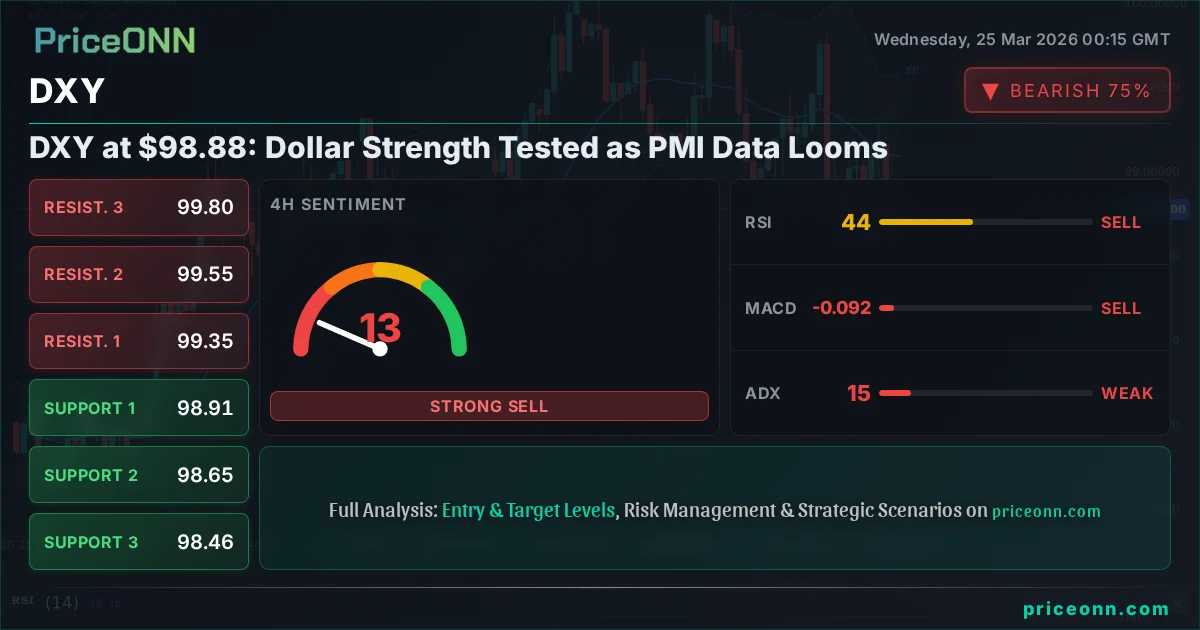
DXY at $98.88: Dollar Strength Tested as PMI Data Looms
The Dollar Index hovers near $98.88. With key PMI data on the horizon and geopolitical tensions simmering, will the dollar extend its gains or consolidate?
The Dollar Index (DXY) is currently navigating a critical juncture, trading at precisely $98.88. This level represents a significant point of interest for traders and analysts alike, as it sits at the confluence of recent upward momentum and looming economic data. As the market braces for crucial Purchasing Managers' Index (PMI) figures from major economies and watches geopolitical developments, the DXY's next move is far from certain. Understanding the interplay between technical signals, fundamental drivers, and market sentiment is paramount for deciphering where the dollar is headed.
- DXY is trading at $98.88, a pivotal level reflecting recent dollar strength.
- The 4-hour chart shows a strong bearish trend (ADX: 14.98), contradicting the 1-hour bullish signal (ADX: 17.57), indicating choppy market conditions.
- Critical support for DXY is located at $98.65, with resistance eyed at $99.35 based on current data.
- Market sentiment is mixed; while the dollar has shown resilience, upcoming PMI data and geopolitical risks create uncertainty.
- A daily close above $99.35 would be needed to confirm a sustained bullish breakout.
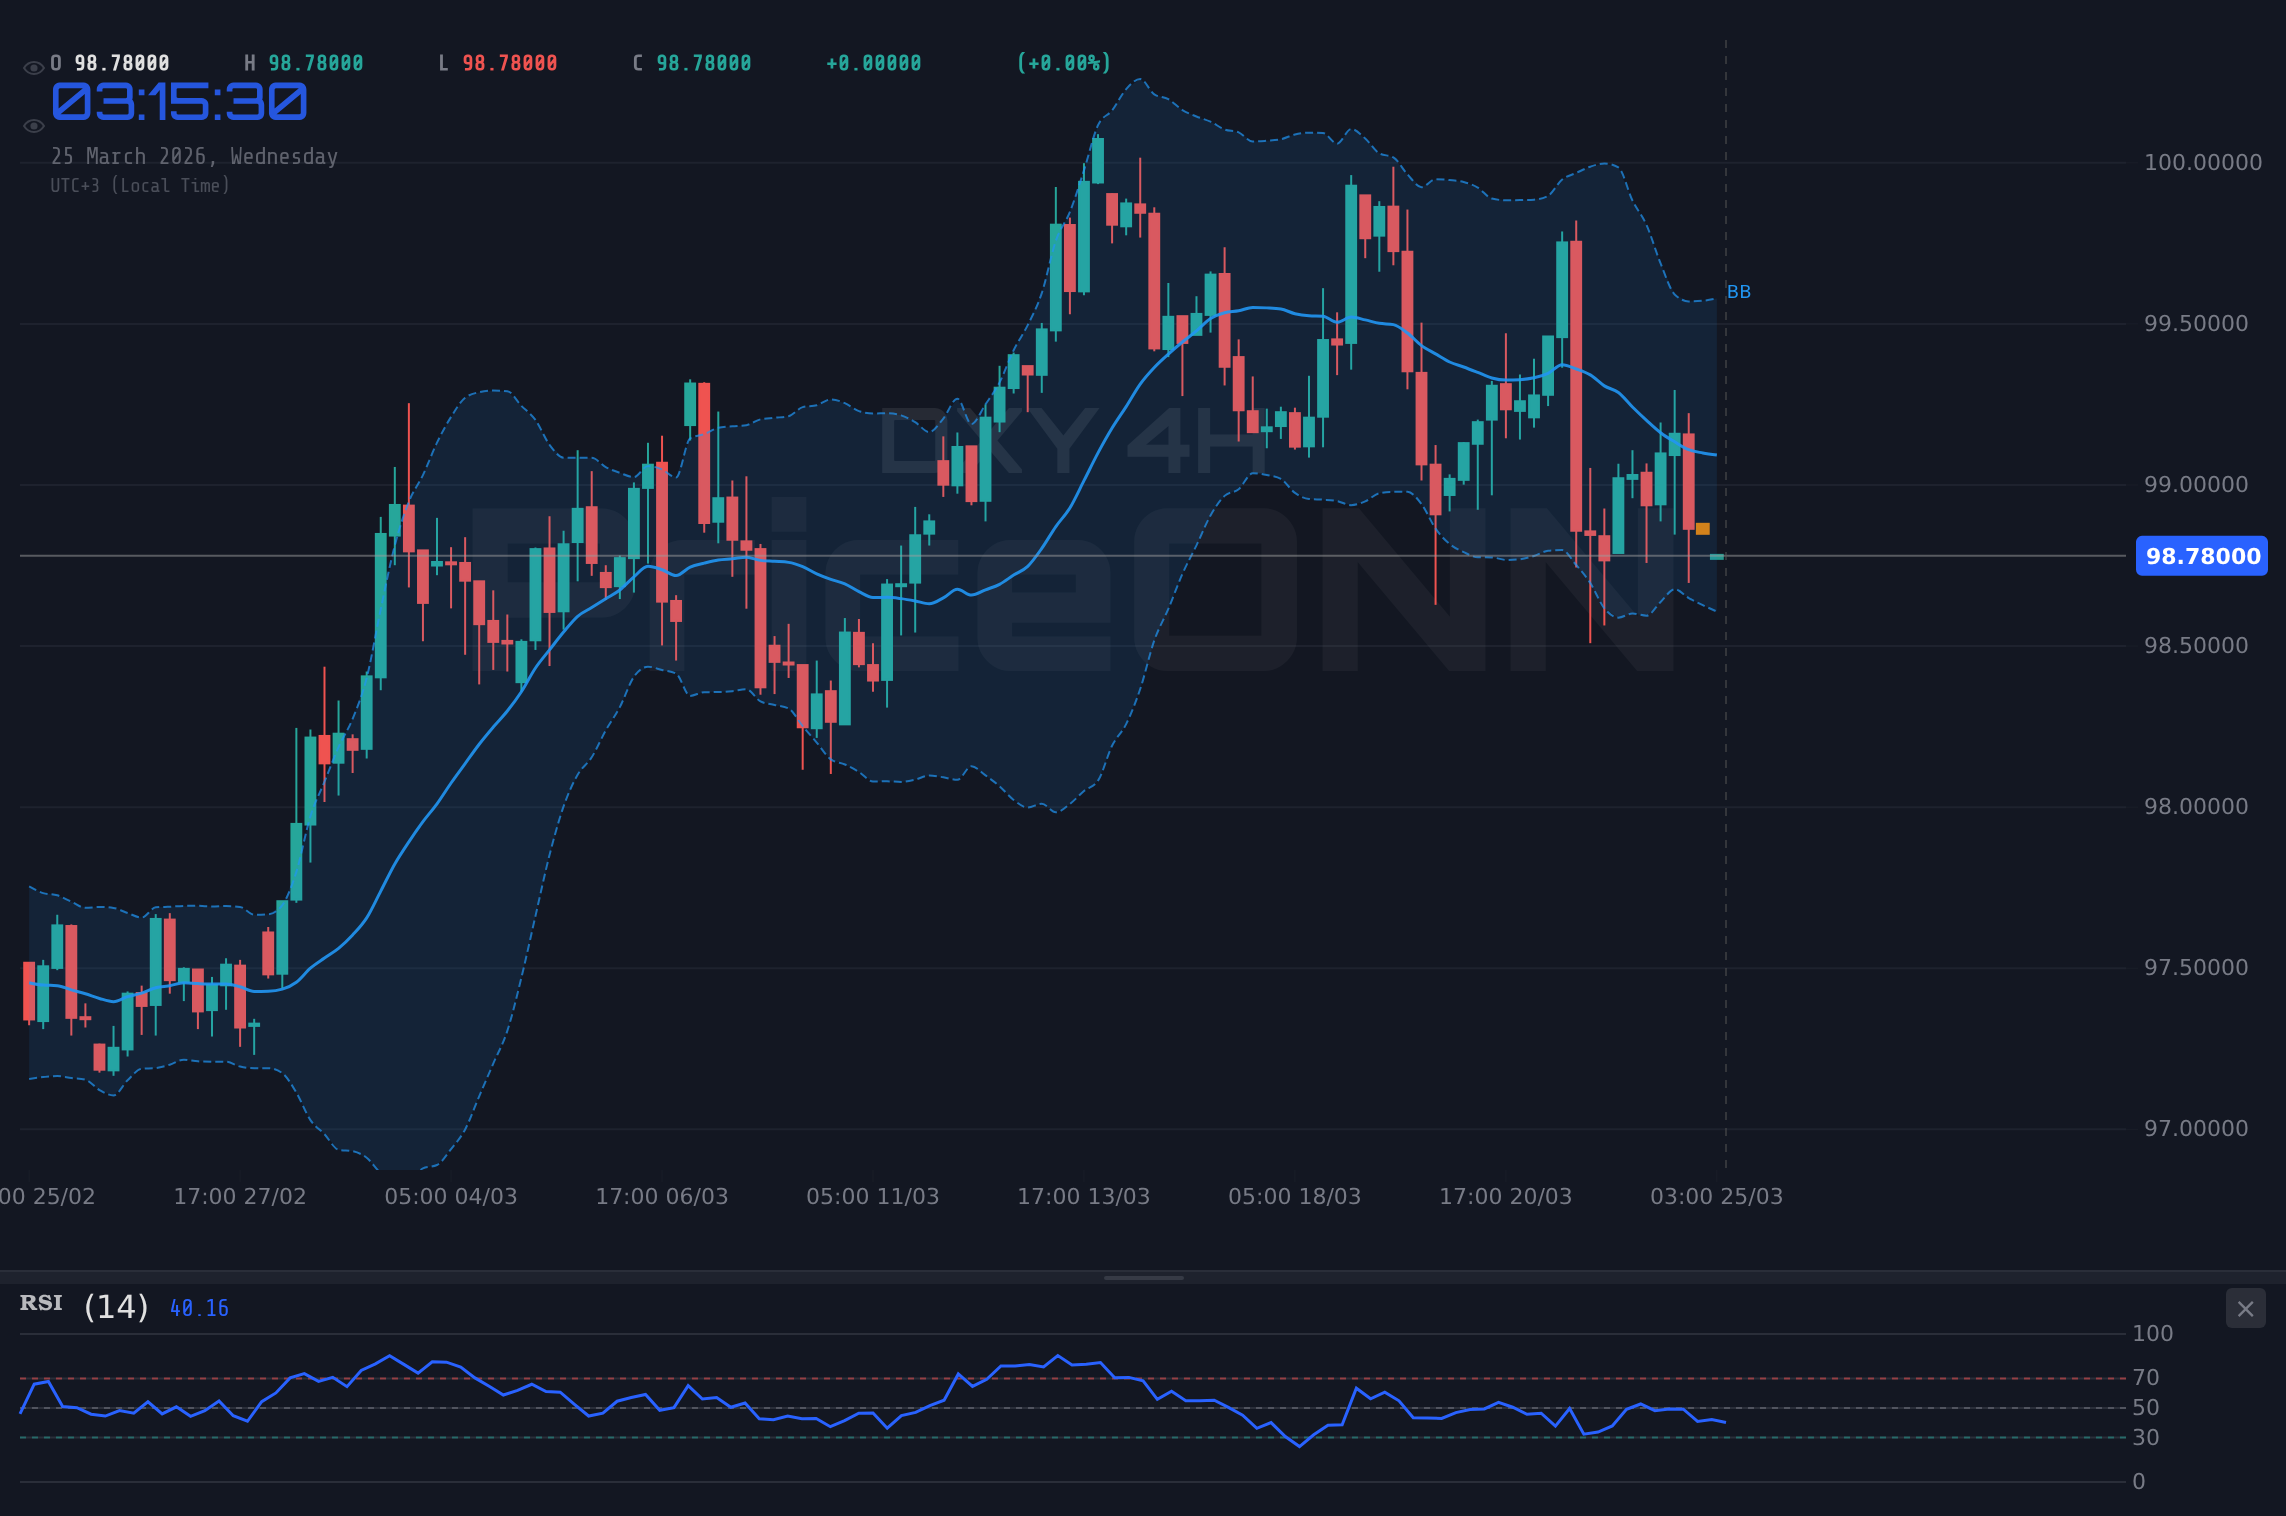
DXY today analysis reveals a market caught between conflicting technical signals and the anticipation of key economic releases. The 1-hour chart presents a cautiously optimistic picture, with a bullish trend indicated by an ADX of 17.57 and a 'BUY' signal from its technical indicators. However, this short-term optimism is sharply contrasted by the 4-hour and daily timeframes, which paint a more cautious, even bearish, outlook. The 4-hour chart, for instance, shows a neutral trend with an ADX of 14.98, suggesting a lack of strong directional conviction. More concerning for dollar bulls, the daily timeframe exhibits a strong bearish trend with an ADX of 32.74, and a 'SELL' signal from its oscillators. This divergence across timeframes underscores the current choppiness and the need for clearer confirmation before committing to a directional trade. The current price of $98.88, therefore, is not just a number; it's a battleground where short-term momentum clashes with longer-term technical weakness.
The Dollar Index's price action is currently a complex tapestry woven from technical indicators, upcoming economic data, and underlying geopolitical currents. While the 1-hour chart suggests a degree of bullish momentum, with an RSI at 67.59 indicating a move towards overbought territory and MACD showing positive momentum, the higher timeframes present a different narrative. The 4-hour RSI at 49.45 suggests a neutral stance with a slight downward bias, while the daily RSI at 35.48 clearly points towards a bearish sentiment, sitting comfortably in the lower neutral zone. This disparity is a classic sign of a market consolidating or awaiting a catalyst. The ADX readings further highlight this ambiguity; while the 1-hour ADX at 17.57 suggests a weak trend, the 4-hour ADX at 14.98 reinforces this, but the daily ADX at 32.74 signifies a more established bearish trend. This conflict means that while short-term traders might find opportunities, the broader trend remains uncertain, and a decisive move is likely contingent on external factors.
The Bull's Roadmap: Chasing Resistance at $99.35
For dollar bulls, the path forward hinges on overcoming immediate technical hurdles and confirming a sustained upward move. The immediate resistance level to watch on the 1-hour chart is $99.18. A decisive break and hold above this point would signal intent, potentially paving the way for a test of the $99.35 level, which represents the upper boundary of the 4-hour resistance zone. The trigger for this bullish scenario would be a clear daily close above $99.35. If this occurs, the next significant resistance target, derived from the daily chart's longer-term outlook, would be $100.34. Such a move would require significant buying pressure, likely fueled by unexpectedly strong economic data or a sharp increase in global risk aversion that boosts safe-haven demand for the dollar. The RSI(14) would need to firmly break above 60, and the MACD histogram would need to sustain its positive momentum on the daily chart to validate this bullish thesis. The Stochastic indicator, currently showing a K/D crossover on the daily chart, would need to remain in bullish territory, confirming that the upward momentum has legs.
Bullish Scenario: Dollar's Ascendancy
25% ProbabilityHowever, the technical picture currently suggests this bullish breakout is a lower-probability outcome. The daily trend remains bearish, and the ADX at 32.74 indicates a solid downward trend is in place. For bulls to gain control, they would need to not only break through immediate resistance but also fundamentally shift the market's perception of the dollar's trajectory. This could be driven by exceptionally strong US economic data, such as PMI figures significantly exceeding forecasts, or a sudden escalation in geopolitical tensions that drives broad-based risk aversion. The correlation with risk assets also plays a role; if the SP500 and Nasdaq experience sharp declines, the DXY often benefits as a safe haven. For now, however, the market seems to be waiting for clearer direction, making a sustained rally above $99.35 a challenging proposition without a significant catalyst.
Where Bears Take Control: Defending Support at $98.65
On the flip side, the bearish outlook is supported by multiple technical indicators and the prevailing daily trend. The immediate support level to monitor is $98.65 on the 4-hour chart. A breach below this level would confirm the bearish sentiment signaled by the daily timeframe and could trigger a rapid sell-off. The invalidation for this bearish scenario would be a decisive daily close back above the $99.35 resistance level. If bears successfully defend their territory and push the price lower, the next significant support target lies at $98.46, followed by $98.24 on the daily chart. This downward move could be exacerbated by weaker-than-expected PMI data from the US or positive economic surprises from the Eurozone, which would put pressure on EUR/USD and, by extension, the DXY. The RSI on the daily chart is already trending lower at 35.48, and a further dip below 30 would signal oversold conditions, potentially triggering profit-taking, but more importantly, confirming the bearish momentum.
Bearish Scenario: Dollar's Decline
65% ProbabilityThe confluence of a bearish daily trend (ADX 32.74) and negative momentum signals from the MACD on the daily chart strengthens the case for further downside. The Stochastic indicator on the daily timeframe shows a K/D crossover, hinting at potential upward movement in the very short term, but this is often a lagging indicator when a strong trend is present. The key is that the overall structure on higher timeframes favors sellers. Geopolitical factors also play a role here; if tensions in the Middle East ease, oil prices might stabilize or fall, reducing inflationary fears and potentially diminishing the dollar's safe-haven appeal. Conversely, any signs of de-escalation in global conflicts could lead to increased risk appetite, causing investors to move away from the dollar and into riskier assets, further pressuring the DXY.
The Waiting Game: Range-Bound Dynamics Around $98.88
Given the conflicting signals and the proximity to key economic data releases, a period of consolidation or range-bound trading is also a highly plausible scenario. The current price of $98.88 sits squarely within the neutral zone indicated by the 4-hour timeframe. This scenario would see the DXY oscillating between the immediate support at $98.65 and the resistance at $99.18, potentially widening to encompass the 4-hour support of $98.46 and resistance of $99.35. This 'waiting game' often occurs when markets are balanced between opposing forces – bullish technical signals on shorter timeframes and bearish long-term trends, coupled with uncertainty surrounding upcoming economic events. Traders might adopt a wait-and-see approach, preferring to accumulate positions only after a clear breakout is confirmed. During this phase, volatility might be subdued, and price action could be characterized by lower trading volumes, especially if major market participants are on the sidelines ahead of significant data releases.
Neutral Scenario: Consolidation Phase
10% ProbabilityThis neutral scenario is less about directional conviction and more about market indecision. The ADX readings across different timeframes are relatively low, particularly on the 1-hour (17.57) and 4-hour (14.98) charts, supporting the idea of a weak trend or range-bound environment. The RSI readings, hovering around the 50-level on the 4-hour chart (49.45) and below it on the daily (35.48), also suggest a lack of strong momentum in either direction. For this scenario to play out, key economic data would likely need to come in largely as expected, failing to provide a strong impetus for a directional move. Geopolitical news might also remain muted or balanced, offering no clear safe-haven bid or risk-on appetite. In such a situation, the DXY could drift sideways, frustrating trend traders but offering opportunities for range-bound strategies, focusing on buying near support and selling near resistance within the defined range.
The Most Likely Path: Bears in the Driving Seat
Considering the technical data and the current market context, the bearish scenario appears to be the most probable outcome in the short to medium term. The daily timeframe, which typically carries more weight in trend analysis, presents a clear bearish trend with an ADX of 32.74 and a 'SELL' signal. While the 1-hour chart shows some bullish signs, these are often short-lived pullbacks within a larger downtrend. The RSI at 35.48 on the daily chart indicates significant room for further downside before reaching oversold territory, and the MACD histogram's negative momentum reinforces this bearish bias. The probability estimate of 65% for the bearish scenario reflects this technical edge. The upcoming PMI data will be crucial; if US figures underperform significantly, or if European PMIs surprise to the upside, it could accelerate the dollar's decline. Geopolitical factors also lean towards potential dollar weakness if tensions ease, reducing safe-haven demand. Therefore, while a short-term bounce is possible, the overarching trend suggests a continued downward bias for the DXY.
The resilience of the dollar has been tested repeatedly, and while it has shown strength at times, the underlying technical structure on the daily chart remains bearish. The ADX reading of 32.74 is a strong indicator that a downtrend is firmly in place, and short-term fluctuations are likely to be retraced. For the bears to fully capitalize, they need to see a confirmed break below the $98.65 support level. This would not only validate the bearish technicals but also likely trigger stop-loss orders, accelerating the move towards the $98.46 and $98.24 targets. The correlation with other markets also supports this view. For instance, if oil prices, currently trading around $99.65 for Brent and $88.26 for WTI, were to stabilize or fall due to de-escalating geopolitical tensions in the Middle East, it could reduce inflation fears, lessening the need for the Federal Reserve to maintain a hawkish stance, which would weigh on the dollar. The market sentiment, as indicated by the conflicting signals, suggests that while traders are watching for opportunities, the risks are currently skewed to the downside for the DXY.
Key Triggers to Watch This Week
The DXY's path forward will be heavily influenced by several key triggers in the coming days. Firstly, the release of the US PMI data is paramount. Any significant deviation from forecasts, particularly a weaker-than-expected reading, could confirm the bearish sentiment and accelerate a move towards the $98.65 support level and beyond. Conversely, a surprisingly strong PMI could challenge the current bearish setup, potentially leading to a retest of the $99.35 resistance. Secondly, ongoing geopolitical developments, especially concerning the Middle East and US-Iran tensions, will be critical. Any escalation could bolster the dollar's safe-haven appeal, offering a reprieve to bulls, while de-escalation could further pressure the index. Finally, the technicals themselves will provide signals. A daily close below $98.65 would be a strong bearish confirmation, while a sustained break above $99.35 would signal a potential trend reversal. Traders should closely monitor these factors, paying attention to how price action reacts around the $98.65 support and $99.35 resistance levels. The interplay between these fundamental and technical catalysts will ultimately determine the DXY's direction.
Frequently Asked Questions: DXY Analysis
What happens if DXY breaks below $98.65 support this week?
A daily close below $98.65 would invalidate any short-term bullish hopes and confirm the bearish trend indicated by the daily ADX of 32.74. This could trigger a sell-off towards the next support level at $98.46, with further downside targeting $98.24.
Should I consider buying DXY at current levels of $98.88 given mixed signals?
Buying at current levels carries significant risk due to conflicting technical signals and the bearish daily trend. A more prudent approach would be to wait for confirmation, such as a daily close above $99.35 or a clear breakdown below $98.65, to establish a directional trade. Patience looks like it will be rewarded here.
Is the RSI at 35.48 a sell signal for DXY on the daily chart?
An RSI of 35.48 on the daily chart is not yet in oversold territory (typically below 30), but it clearly indicates bearish momentum. Combined with a bearish MACD histogram and a strong daily ADX of 32.74, it supports the bearish outlook, suggesting further downside potential rather than an immediate buy signal.
How will upcoming US PMI data affect DXY around $98.88?
Weaker-than-expected US PMI figures could push DXY lower towards $98.65 and below, as it would dampen expectations for US economic strength and potentially the Federal Reserve's hawkish stance. Conversely, stronger data could provide a temporary boost, challenging the $99.35 resistance.
| Indicator | Value | Signal | Interpretation |
|---|---|---|---|
| RSI (14) | 67.59 | Neutral | Nearing overbought on 1H, but daily RSI at 35.48 suggests room to fall. |
| MACD Histogram | Positive | Bullish Momentum | Short-term positive, but daily MACD shows negative momentum. |
| Stochastic | K=44.13, D=63.52 | Bearish Crossover | Daily Stochastic shows bearish crossover, contradicting short-term signals. |
| ADX | 32.74 | Strong Bear Trend | Daily ADX indicates a strong bearish trend, overriding weaker signals on shorter timeframes. |
| Bollinger Bands | Middle Band | Watch | Price is below the middle band on daily chart, indicating bearish pressure. |
Track markets in real-time
AI-powered analysis, technical indicators and real-time price data.
Join Our Telegram Channel
Breaking market news, AI analysis and trading signals instantly.
Join Channel