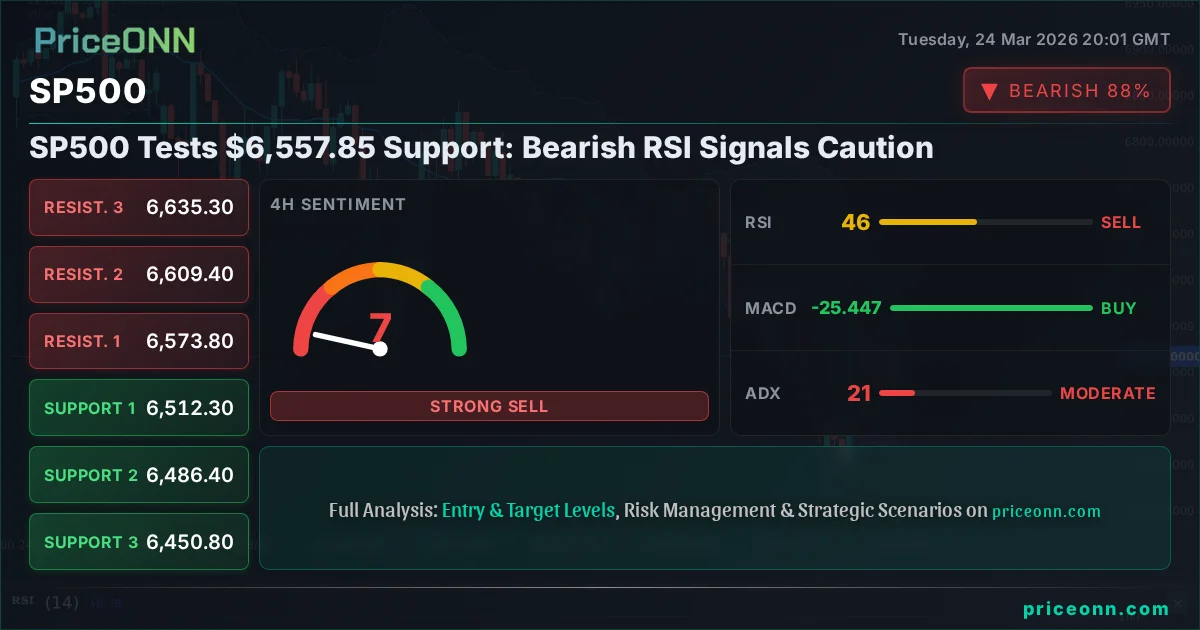
SP500 Tests $6,557.85 Support: Bearish RSI Signals Caution
The SP500 hovers near $6,557.85 as a bearish RSI divergence and weak ADX suggest caution. Is this support level a make-or-break point for the index?
The SP500 is currently trading at $6,557.85, a critical juncture where the index is testing key support levels amidst a confluence of mixed technical signals. While the daily chart presents a bearish picture with RSI firmly in oversold territory, shorter timeframes offer conflicting narratives. This tug-of-war between potential downside momentum and the resilience of support levels makes the current price action a focal point for traders and investors alike. Understanding the interplay of these technical indicators is paramount to navigating the immediate path forward for the S&P 500.
- The SP500 is testing support at $6,557.85, a level that has shown resilience in the past.
- Daily RSI at 35.58 signals oversold conditions, but 1-hour RSI at 48.09 suggests further downside pressure.
- The ADX at 21.3 on the 4-hour chart indicates a moderate trend, while the 1-hour ADX at 12.02 points to a weak, choppy market.
- Correlation analysis shows DXY at 99.19, potentially weighing on risk assets like the SP500.
The market sentiment surrounding the SP500 is currently a complex tapestry, woven with threads of caution and cautious optimism. On the 1-hour chart, the trend is neutral with a strength of 50%, but the RSI at 48.09 hints at a potential dip. MACD is showing negative momentum, reinforcing the idea that sellers are momentarily in control on this very short-term view. However, the Stochastic indicator offers a conflicting bullish signal, with %K (60.28) crossing above %D (56.4), suggesting a potential short-term bounce. The ADX at 12.02 underscores the choppiness, indicating a lack of strong directional conviction in the immediate hourly action. This mixed bag of signals on the 1-hour timeframe means that while a short-term rebound is possible, it lacks the conviction needed to signal a sustained move higher.
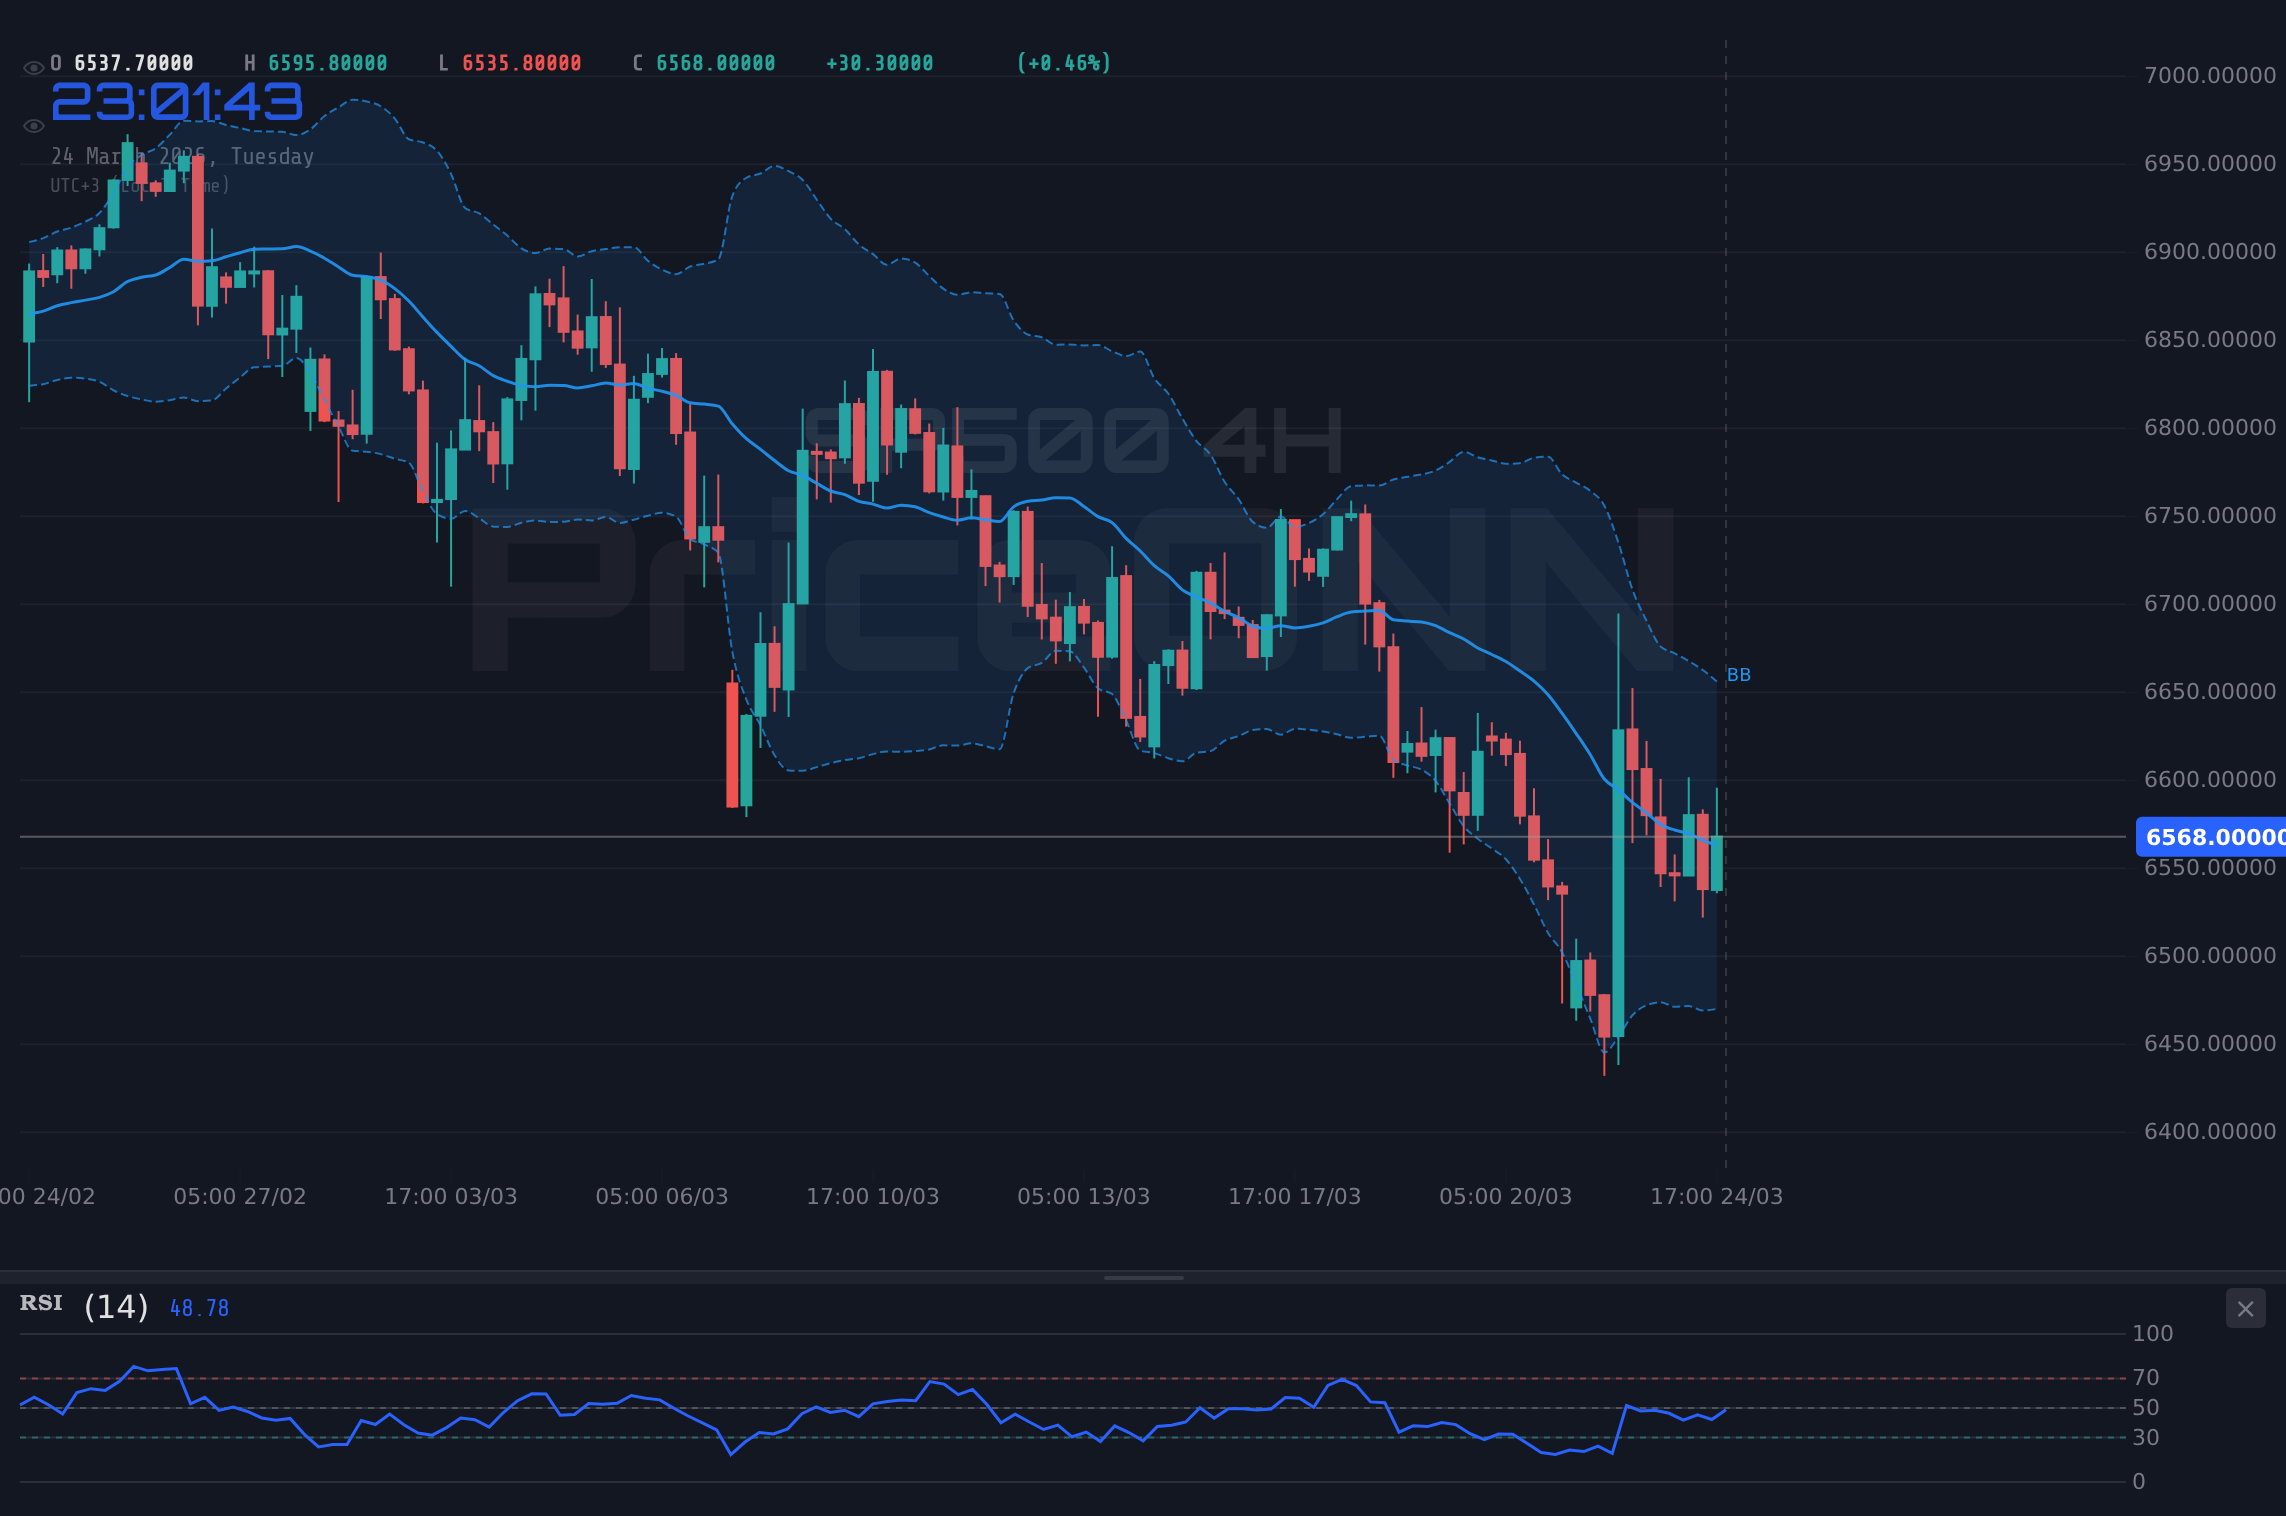
Moving to the 4-hour timeframe, the picture becomes decidedly more bearish. The trend is classified as bearish with a strength of 81%. The RSI has dipped to 46.19, still well within the neutral zone but trending downwards, indicating that sellers are gaining ground. The MACD, while showing positive momentum currently, is positioned above its signal line, which could suggest a temporary reprieve is possible. However, the Bollinger Bands are situated below the middle band, a classic bearish signal, implying that price action is consolidating to the downside. The Stochastic indicator, with %K at 48.21 and %D at 51.99, is giving a bearish crossover signal, reinforcing the downward pressure. The ADX at 21.3 suggests a moderate trend strength, which is enough to give the bearish sentiment some teeth. This timeframe paints a clearer picture of potential downside risk.
The daily chart, often considered the most significant for medium-term outlooks, presents the most compelling case for caution. The trend is unequivocally bearish, with a strength of 100%. The RSI is sitting at 35.58, firmly in the oversold territory, which historically can signal a potential buying opportunity. However, it's crucial to remember that RSI can remain oversold for extended periods during strong downtrends. MACD is exhibiting negative momentum, with the histogram below the signal line, confirming the bearish pressure. The Bollinger Bands are trading below the middle band, indicating a bearish bias. The Stochastic oscillator is in the oversold region, with %K at 31.13 and %D at 26.84, and importantly, %K is above %D, suggesting a potential bullish divergence or a bottoming process could be on the horizon. Yet, the ADX at 45.34 is exceptionally high, signaling a very strong downtrend. This robust trend strength suggests that even oversold conditions might not immediately trigger a significant bounce, and further downside is a distinct possibility.
The current price of $6,557.85 is not just a number; it represents a battleground. On the 4-hour chart, the support levels are clearly defined at $6,512.3, $6,486.4, and $6,450.8. A decisive break below $6,512.3 would confirm the bearish trend on this timeframe and open the door for a move towards the subsequent support zones. Conversely, a sustained hold above $6,557.85, followed by a push above the 1-hour resistance at $6,590.8, would be the first sign of bullish conviction returning. The daily support levels are much lower, at $6,443.27, $6,306.33, and $6,180.57. These are significant psychological and technical barriers that would require substantial selling pressure to breach. The immediate focus, however, remains on the $6,557.85 level and the closest support at $6,512.3.
The correlation with the US Dollar Index (DXY) adds another layer to this analysis. With the DXY currently at 99.19 and showing a strong upward trend on the daily chart (ADX 32.74), there's an underlying pressure on risk assets like the SP500. A strengthening dollar typically makes US equities less attractive to foreign investors and can signal tighter global liquidity conditions. The fact that the SP500 is showing a bearish signal on the daily chart while the DXY shows a bullish trend is a significant correlation to monitor. Any further strength in the DXY could exacerbate the selling pressure on the SP500, especially if key support levels fail to hold. This inverse relationship is a critical factor in assessing the overall market risk appetite.
Examining the broader market sentiment, the recent news flow highlights a cautious environment. The decline in WTI crude oil prices from over $100 to around $85, as reported, suggests potential concerns about global demand or easing geopolitical tensions, which can sometimes translate into risk-off sentiment in equity markets. While the article mentions a sharp drop in Brent crude, the WTI plunge specifically noted could indicate broader economic headwinds. Furthermore, the significant outflow of foreign funds from Asian stock markets, as reported, signals a global risk aversion trend. This broader sentiment of capital flight from riskier assets could easily spill over into US markets, putting additional pressure on the SP500 even if domestic technicals suggest otherwise. The market is a complex ecosystem, and global capital flows cannot be ignored.
The ADX indicator across different timeframes paints a picture of transition. On the 1-hour chart, the ADX at 12.02 signifies a weak trend, indicating choppy, range-bound conditions where price swings might be erratic rather than directional. This lack of trend strength makes immediate breakout plays risky. However, the 4-hour ADX at 21.3 suggests a moderate trend is developing, aligning with the bearish bias on that timeframe. The daily ADX at 45.34 is the most concerning number, signaling a very strong downtrend. Such a strong trend means that even significant oversold conditions might not be enough to halt the downward momentum quickly. Traders should be wary of attempting to call a bottom in such a strong trend without clear signs of trend exhaustion or reversal confirmed by other indicators.
The MACD indicator offers further insight into momentum. On the 1-hour chart, MACD is below its signal line, indicating negative momentum, which aligns with the immediate bearish bias. However, on the 4-hour chart, MACD is above its signal line, suggesting positive momentum, which contradicts the overall bearish trend on that timeframe. This divergence is something to watch. The daily MACD is firmly negative, confirming the bearish sentiment on the longer timeframe. This mixed MACD picture across timeframes highlights the current indecision in the market, but the longer-term bearish signal on the daily chart is the one that carries more weight for strategic decisions.
Stochastic oscillators provide another layer to the technical puzzle. The 1-hour Stochastic shows %K (60.28) above %D (56.4), a bullish signal, suggesting a potential short-term bounce. However, the 4-hour Stochastic has %K (48.21) below %D (51.99), indicating a bearish signal. On the daily chart, %K (31.13) is above %D (26.84), but both are in oversold territory, which can be a precursor to a reversal. The conflicting signals from Stochastic across different timeframes emphasize the need for confirmation. A bullish signal on the 1-hour chart might be short-lived if the bearish trend on the daily chart reasserts itself. Conversely, if the daily Stochastic manages to hold its ground and starts to turn upwards, it could signal the beginning of a sustained recovery, but this is not yet evident.
The Bollinger Bands also provide valuable context. On the 1-hour chart, prices are trading above the middle band, suggesting some upward pressure, but this is in the context of a weak trend. On the 4-hour chart, prices are below the middle band, confirming the bearish bias on this timeframe. The daily chart shows prices trading below the middle band, reinforcing the bearish sentiment. The fact that the bands are not excessively wide suggests that volatility, while present, is not yet at extreme levels, which could imply that the current move is not a panic-driven sell-off but rather a more measured downtrend. However, if prices were to break significantly outside the bands, it would signal extreme conditions.
Considering the current technical landscape, a balanced approach is warranted. The strength of the bearish trend on the daily chart, supported by a strong ADX and negative MACD, cannot be ignored. However, the oversold RSI and Stochastic on the daily chart, coupled with the conflicting signals on shorter timeframes, suggest that a short-term bounce or consolidation is possible before any further significant downside move. The key is to watch how the SP500 reacts at the $6,557.85 support level and the subsequent $6,512.3 level. A failure to hold these levels would likely accelerate the bearish trend, while a strong bounce could lead to a retest of the intraday resistances. Risk management remains paramount, especially given the mixed signals and the strong underlying trend.
Bearish Scenario: Trend Continuation
65% ProbabilityNeutral Scenario: Consolidation and Choppy Action
25% ProbabilityBullish Scenario: Short-Term Bounce from Support
10% ProbabilityFrequently Asked Questions: SP500 Analysis
What happens if SP500 breaks below the $6,512.3 support level?
A break below $6,512.3 on the 4-hour chart would confirm the bearish trend on that timeframe, likely triggering further selling pressure. This could lead to a retest of the $6,486.4 and $6,450.8 support levels as momentum accelerates.
Is the current RSI reading of 35.58 a buy signal for SP500 at $6,557.85?
While a daily RSI of 35.58 indicates oversold conditions, it's not a direct buy signal in isolation, especially with a strong daily downtrend (ADX 45.34). Historically, RSI can remain oversold for extended periods, so confirmation from price action or other indicators is crucial before considering a long position.
How is the DXY at 99.19 influencing the SP500's current price action around $6,557.85?
The DXY at 99.19, showing a strong daily uptrend, typically exerts downward pressure on risk assets like the SP500. This inverse correlation suggests that dollar strength could be contributing to the caution seen around SP500's support levels, potentially hindering any bullish attempts.
What should traders watch for to confirm a potential bullish reversal for SP500 from current levels?
A confirmed bullish reversal would require SP500 to hold firmly above $6,557.85 and then decisively break through the 1-hour resistance at $6,590.8. This would need to be accompanied by positive momentum shifts on MACD and Stochastic across multiple timeframes, alongside waning bearish pressure on the daily ADX.
Track markets in real-time
AI-powered analysis, technical indicators and real-time price data.
Join Our Telegram Channel
Breaking market news, AI analysis and trading signals instantly.
Join Channel