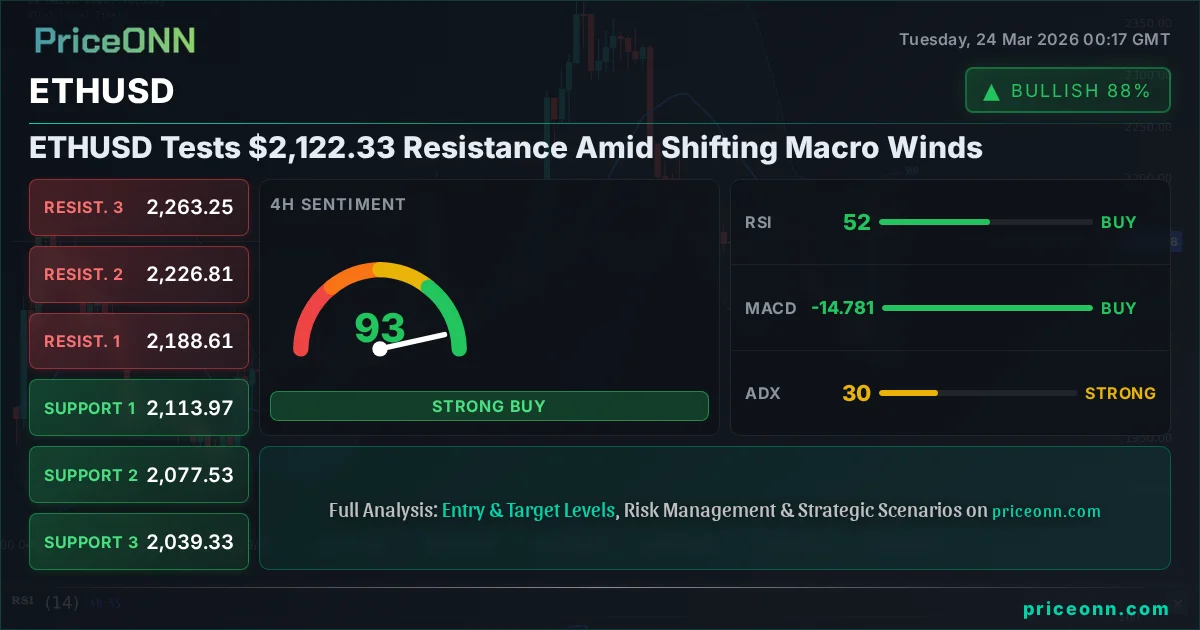
ETHUSD Tests $2,122.33 Resistance Amid Shifting Macro Winds
ETHUSD faces critical resistance at $2,122.33. With RSI at 49.87 and ADX signaling a strong trend, traders eye key levels. Learn more.
The cryptocurrency market is in a constant state of flux, and ETHUSD is no exception. As Ether consolidates around the $2,146.62 mark, the focus sharpens on pivotal resistance levels that could dictate its next major move. The recent price action, coupled with a complex interplay of technical indicators and underlying macroeconomic currents, presents a nuanced picture for traders and investors alike. Understanding the confluence of these factors is crucial for navigating the potential volatility ahead. We're seeing a critical juncture where the short-term technicals suggest caution, but the broader market sentiment and the potential for shifts in global economic policy could offer significant opportunities.
- ETHUSD faces immediate resistance at $2,122.33, with a break above targeting $2,157.81.
- The 4-hour chart shows a strong downtrend (ADX: 62.48), while the 1-hour chart suggests a neutral to bullish bias (ADX: 29.1).
- RSI sits at 49.87 on the 1H chart, indicating a neutral stance with a slight bearish lean, while the 1D RSI at 27.8 suggests oversold conditions may present a buying opportunity.
- The US Dollar Index (DXY) is trading at 99.05, influencing risk assets like ETHUSD.
Navigating the $2,122.33 Barrier
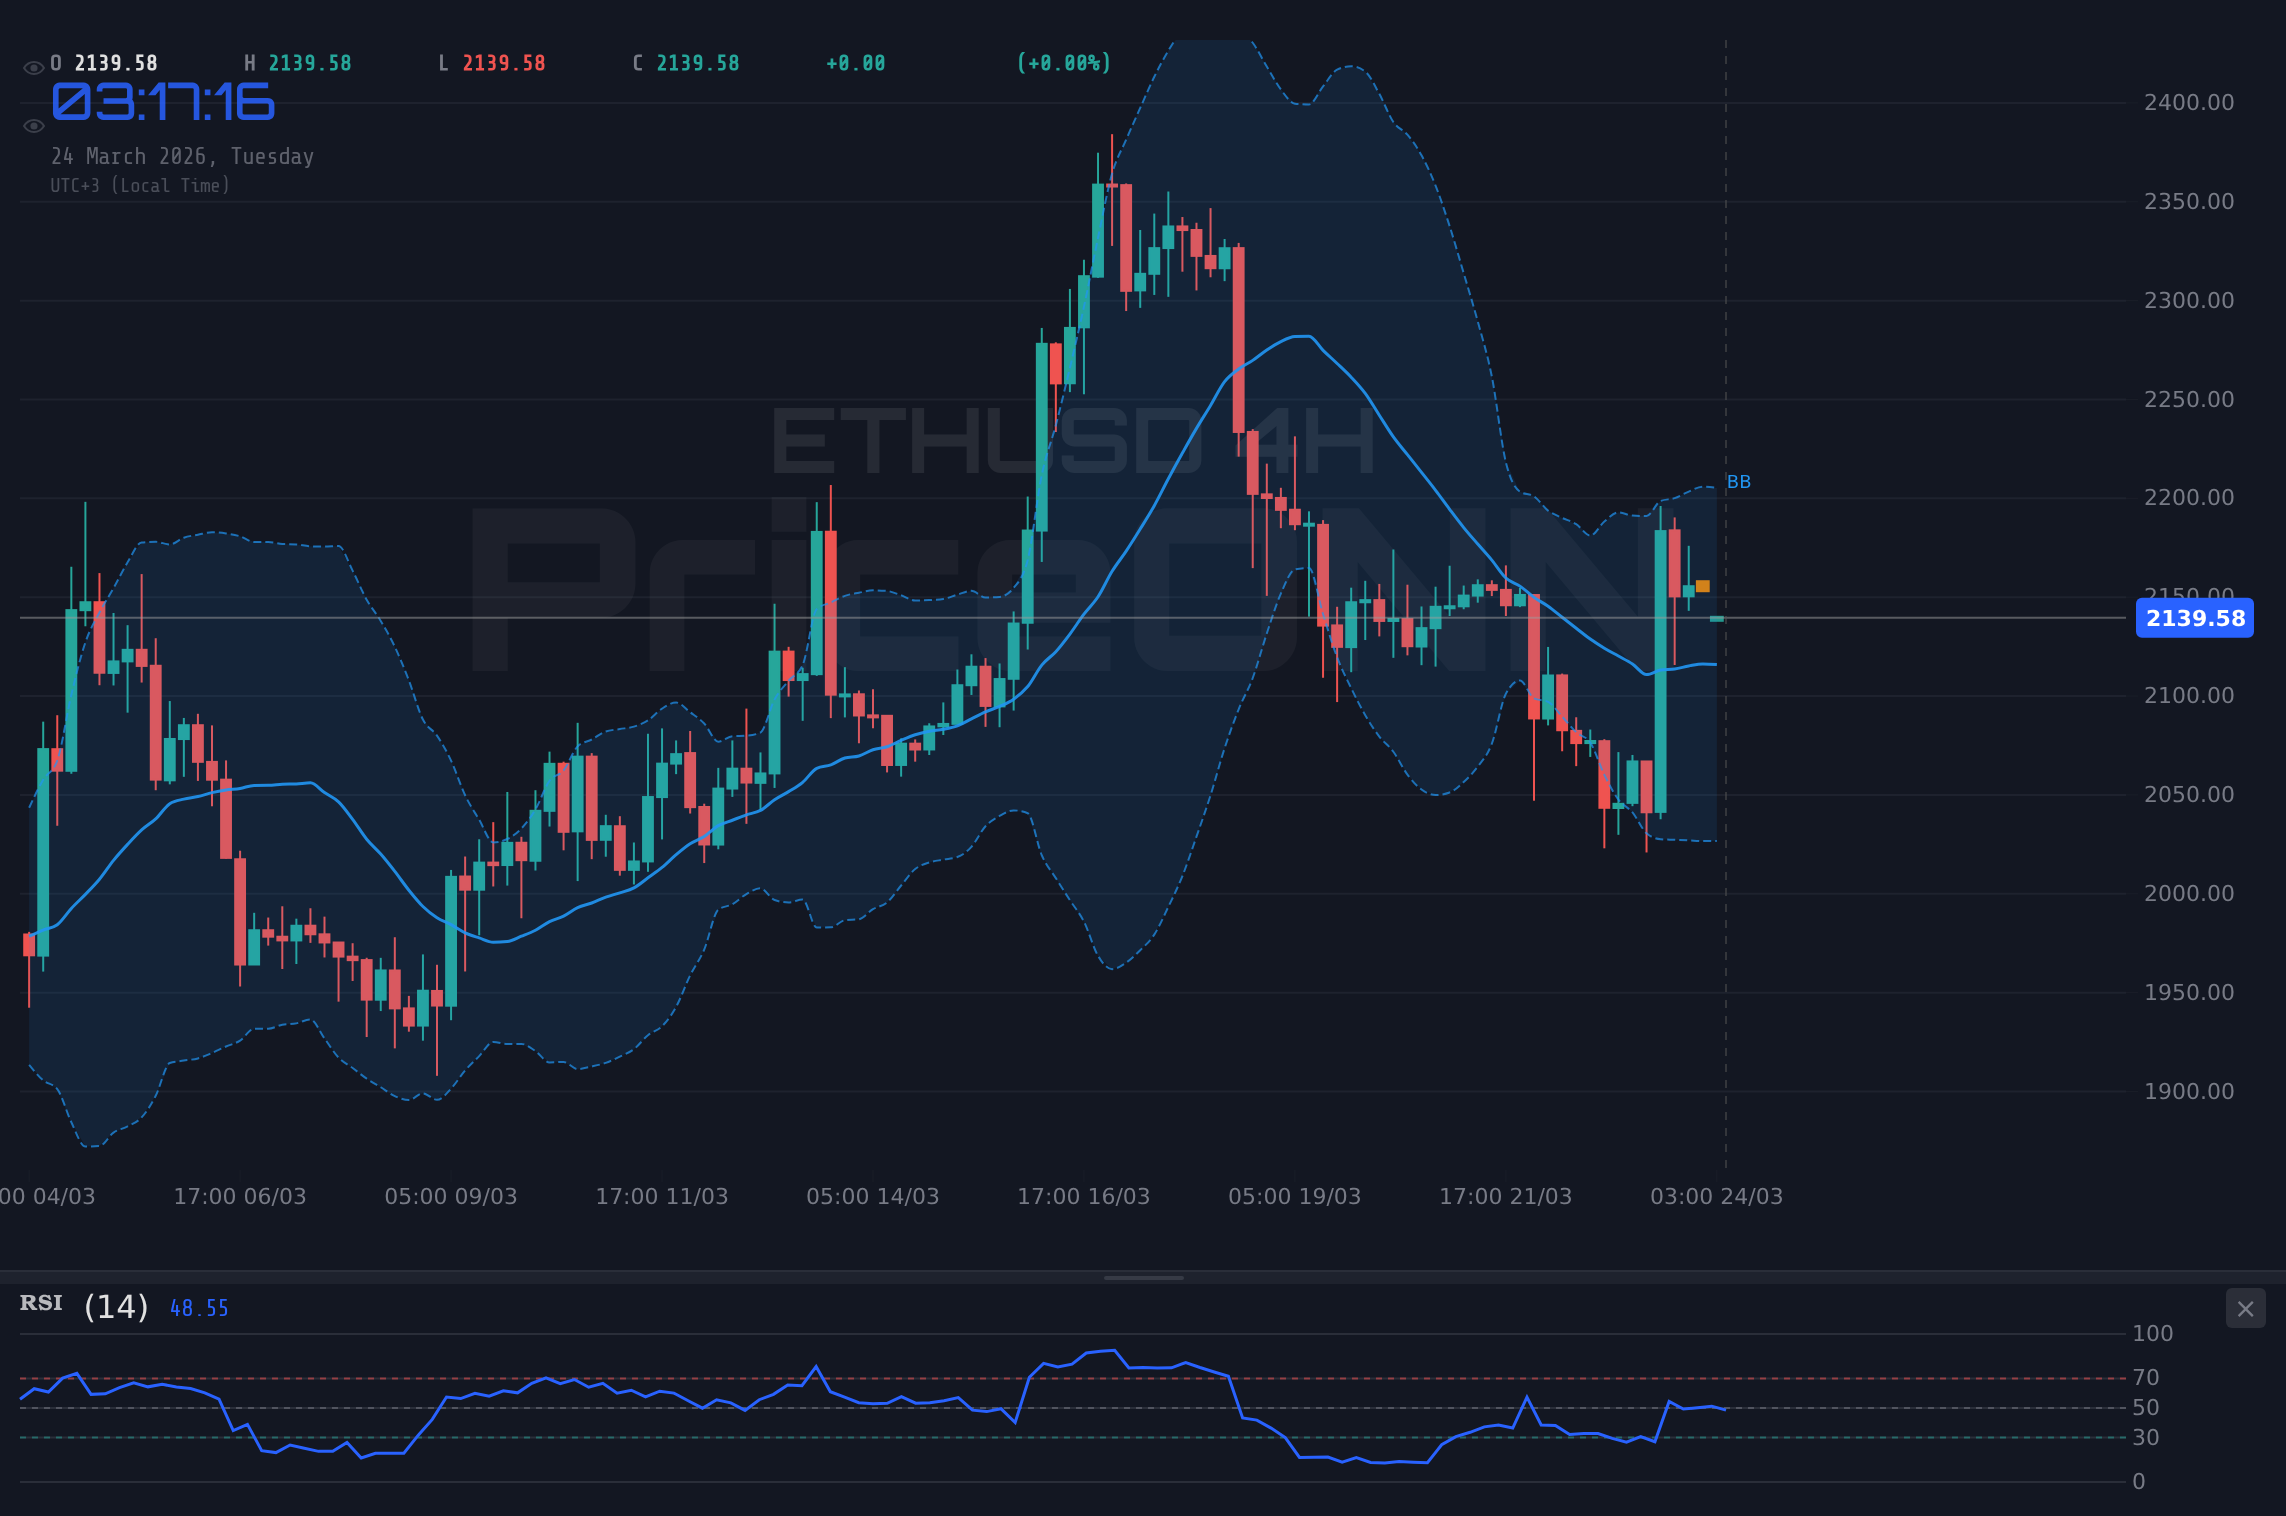
ETHUSD is currently hovering around $2,146.62, a level that finds itself just above a significant resistance point at $2,122.33 according to the latest market data. This price zone represents a critical test for the digital asset. On the 1-hour timeframe, the immediate resistance is pegged at $2,157.81, followed by $2,165.27. A decisive move above these levels could signal a renewed bullish push. However, the path is not straightforward. The 4-hour chart paints a more cautious picture, with a strong downtrend indicated by an ADX reading of 62.48. This suggests that while the 1-hour chart might hint at short-term recovery, the medium-term trend remains decidedly bearish. The strength of this downtrend on the 4-hour chart means any upward movement needs to be robust and sustained to overcome the prevailing sentiment.
The daily chart, however, offers a glimmer of potential upside. The RSI(14) is sitting at a low 27.8, deep within oversold territory. Historically, such readings on the daily timeframe have often preceded a bounce or even a more significant trend reversal. This divergence between the short-term neutral-to-bearish signals and the daily oversold condition creates a compelling dynamic. Traders are weighing whether the current price action is merely a pause in a larger downtrend or the precursor to a more substantial recovery. The proximity to the $2,122.33 resistance is the immediate hurdle that needs to be cleared for any bullish thesis to gain traction. The interplay between these different timeframes provides a rich landscape for technical analysis, highlighting the importance of a multi-timeframe approach.
Technical Indicators: A Mixed Signal Landscape
Examining the technical indicators provides a granular view of the pressures on ETHUSD. On the 1-hour chart, the Relative Strength Index (RSI) at 49.87 hovers near the midpoint, suggesting a neutral market sentiment with a slight lean towards bearishness as it hovers just below the 50 mark. This is a delicate balance, indicating neither strong buying nor selling pressure is dominant in the immediate term. The MACD (Moving Average Convergence Divergence) on this timeframe shows positive momentum, with the MACD line above its signal line, which typically suggests upward movement. However, this is countered by the Stochastic oscillator, where the %K line (43.52) is below the %D line (57.18), signaling a potential dip or consolidation. The ADX (Average Directional Index) at 25.34 points to a moderately strong trend, but its directionality is currently ambiguous on this short timeframe, demanding further confirmation.
The 4-hour timeframe presents a starkly different picture. The ADX here is significantly higher at 62.48, confirming a very strong trend. This trend is predominantly bearish, as indicated by the MACD, which is below its signal line, and the Bollinger Bands, which show price trading below the middle band, suggesting a downward bias. The RSI(14) at 33.09 further reinforces this bearish sentiment, indicating that the market is approaching oversold conditions on this timeframe but still firmly entrenched in a downward trajectory. The Stochastic oscillator on the 4H chart, however, shows %K (53.83) above %D (27.1), which is a bullish divergence signal. This conflict between the strong bearish trend indicators and the bullish stochastic divergence is a key area of focus. It suggests that while the overall trend is down, there might be short-term buying pressure emerging from the oversold conditions, or it could be a sign of a weakening downtrend that precedes a larger move.
On the daily chart, the picture becomes even more complex. The RSI(14) at 27.8 is deeply oversold, a reading that historically has provided significant buying opportunities. The MACD is negative, and price is trading below the middle Bollinger Band, reinforcing the bearish sentiment observed on the 4-hour chart. However, the Stochastic oscillator is showing a bullish crossover with %K at 17.18 and %D at 12.16, indicating a potential bottoming process. The ADX at 22.73 suggests a trend of moderate strength, leaning towards a downtrend. This combination of deeply oversold daily RSI and Stochastic, juxtaposed with the strong bearish trend signals on the 4-hour chart, creates a scenario where short-term rallies are possible, but the overall trend remains under pressure. The $2,122.33 resistance level is thus a crucial test: a failure here could see prices fall back towards daily support levels, while a decisive breach could signal the start of a significant recovery.
Macroeconomic Currents and DXY Influence
Beyond the charts, macroeconomic factors and the performance of the US Dollar Index (DXY) play a vital role in shaping ETHUSD's trajectory. The DXY, currently trading around 99.05, acts as a barometer for global risk appetite and influences currency and commodity markets, including cryptocurrencies. A strengthening dollar often correlates with a decrease in demand for riskier assets like ETHUSD, as investors seek the perceived safety of the US currency. Conversely, a weakening dollar can fuel demand for alternative assets, pushing prices like ETHUSD higher.
The DXY is currently showing a mixed picture across different timeframes. On the 1-hour and 4-hour charts, it exhibits a neutral to bearish bias, which could theoretically provide some tailwind for ETHUSD. However, the daily chart shows a strong bullish trend for the DXY (ADX at 33.66), suggesting that the dollar's underlying strength might persist. This creates a potential headwind for ETHUSD, especially if the dollar continues its upward trend. The Federal Reserve's monetary policy stance remains a key driver. Any hints of a more hawkish approach, such as elevated inflation concerns or strong employment data, could bolster the dollar and put downward pressure on ETHUSD. Conversely, signals of a dovish pivot or a pause in rate hikes could weaken the dollar and support risk assets.
The market is constantly digesting incoming economic data. Upcoming inflation reports, employment figures, and central bank commentary will be critical in shaping the DXY's path and, by extension, ETHUSD's price action. For instance, if recent employment data or inflation figures exceed expectations, it might strengthen the Fed's resolve to maintain higher interest rates for longer, supporting the dollar and potentially dampening crypto market enthusiasm. Conversely, softer economic data could lead to expectations of earlier rate cuts, weakening the dollar and providing a more favorable environment for ETHUSD. The current price action around $2,146.62 for ETHUSD is occurring within this complex macroeconomic backdrop, where short-term technical signals must be interpreted in light of potential broader economic shifts.
Correlation with Equities and Oil
ETHUSD's performance is also closely watched in relation to major equity indices like the S&P 500 and Nasdaq 100, as well as oil prices. These correlations offer further context for understanding market sentiment and potential catalysts. The S&P 500 is currently showing a strong daily downtrend (ADX 44.98), despite a recent uptick, while the Nasdaq 100 also exhibits a pronounced daily downtrend (ADX 37.8). This suggests a general risk-off sentiment in the broader equity markets. Typically, a decline in major stock indices correlates with a decrease in risk appetite, which can negatively impact cryptocurrencies like ETHUSD.
The current price of the S&P 500 at 6575.45 and the Nasdaq 100 at 24159.99 indicate that while there might be intraday fluctuations, the larger trend on the daily charts remains under pressure. If these indices continue to decline, it would likely create headwinds for ETHUSD, as investors may move away from perceived riskier assets towards safer havens. The correlation is not always perfect, as the crypto market can sometimes decouple due to its own specific drivers, such as regulatory news or technological developments. However, in the absence of strong crypto-specific catalysts, the broader market sentiment reflected in equities often guides digital asset performance.
Oil prices, particularly Brent Crude at $100.22, offer another lens through which to view inflationary pressures and geopolitical risks. Brent Crude's significant daily drop of 11.02% (-$12.42) is notable. While the 1D trend for Brent is bullish (ADX 64.58), the sharp intraday decline suggests significant selling pressure or a reassessment of supply/demand dynamics. Falling oil prices can sometimes signal easing inflationary concerns, which might influence central bank policy expectations. If oil prices continue to fall, it could reduce inflation expectations, potentially leading to a less hawkish stance from central banks. This, in turn, could indirectly benefit risk assets like ETHUSD. However, the geopolitical stability in oil-producing regions remains a wild card that could quickly reverse these trends. The current volatile price action in oil underscores the broader market uncertainty.
Scenario Analysis: Navigating the $2,122.33 Crossroads
Bearish Scenario: Resistance Holds Firm
65% ProbabilityNeutral Scenario: Consolidation Around Current Levels
25% ProbabilityBullish Scenario: Resistance Breakout
10% ProbabilityThe Road Ahead: Key Levels and Trader Psychology
The immediate future for ETHUSD hinges significantly on its ability to overcome the $2,122.33 resistance. If this level holds, the bearish sentiment on the 4-hour and daily charts could intensify, potentially leading to a retest of lower support levels like $2,077.53 and $2,039.33. The strong ADX readings on these longer timeframes suggest that a breakdown could be sharp if it occurs. Traders will be closely monitoring the volume accompanying any price action around these levels; a lack of conviction on a breakout attempt or a surge in selling volume on a rejection would further validate the bearish outlook.
Conversely, a sustained push above $2,122.33, ideally accompanied by increasing volume and a positive MACD crossover on the 4-hour chart, could signal a shift in momentum. The daily oversold RSI at 27.8 provides a fertile ground for such a recovery. In this scenario, the next target would be the daily resistance at $2,201.16, followed by the 4-hour resistance at $2,226.81. However, the probability of this bullish scenario currently appears lower, given the prevailing technical conditions on the medium-term charts. The market is at a crossroads, and the price action in the coming hours and days will be crucial in determining the direction.
For short-term traders, the $2,122.33 to $2,157.81 zone represents a critical inflection point. A failure to decisively break through could present a shorting opportunity, targeting the 4-hour support levels. A strong breakout above $2,157.81, however, might signal a short-covering rally. Long-term investors might see the daily oversold RSI as an attractive entry point, provided they are willing to withstand potential short-term volatility and have a higher risk tolerance. Ultimately, risk management remains paramount. Sticking to predefined stop-loss levels and taking profits at identified targets will be key to navigating this potentially volatile period for ETHUSD. The current price around $2,146.62 offers little clarity on its own; it's the reaction to the key resistance at $2,122.33 that will provide the clearest signals.
Frequently Asked Questions: ETHUSD Analysis
What happens if ETHUSD fails to break above the $2,122.33 resistance level?
If ETHUSD fails to decisively break and hold above the $2,122.33 resistance, the bearish sentiment indicated by the 4-hour ADX (62.48) and daily MACD could intensify. This scenario suggests a potential decline towards the 4-hour support levels, specifically $2,077.53 and possibly $2,039.33.
Should traders consider buying ETHUSD at current levels around $2,146.62 given the daily RSI at 27.8?
The daily RSI of 27.8 indicates oversold conditions, which historically can precede a price recovery. However, this should be considered alongside the strong bearish trend on the 4-hour chart. A potential entry would be more prudent on a confirmed bounce off support or a clear break above immediate resistance, rather than solely relying on the daily RSI reading.
Is the Stochastic crossover on the 4-hour chart a reliable buy signal for ETHUSD despite the strong bearish trend?
The Stochastic crossover (%K above %D) on the 4-hour chart is a bullish divergence against a strong bearish trend (ADX 62.48). While it can signal a potential short-term bounce, it should not be treated as a standalone buy signal. Confirmation from other indicators and price action breaking key resistance levels like $2,122.33 is crucial.
How might the DXY trading at 99.05 affect ETHUSD's price action near the $2,122.33 resistance?
With the DXY showing a strong bullish trend on the daily chart (ADX 33.66), a higher dollar could exert downward pressure on ETHUSD, making it harder to break through the $2,122.33 resistance. Traders should monitor DXY's movement closely; a sustained rise in the dollar could invalidate bullish ETHUSD scenarios.
Technical Outlook Summary: ETHUSD
| Indicator | Value | Signal | Interpretation |
|---|---|---|---|
| RSI (14) | 49.87 | Neutral | Near midpoint, slight bearish lean on 1H; Oversold on 1D (27.8). |
| MACD Histogram | Positive (1H) | Bullish | Positive momentum on 1H, but negative on 4H/1D. |
| Stochastic | K=43.52, D=57.18 (1H) | Bearish | Bearish crossover on 1H; Bullish divergence on 4H (K=53.83, D=27.1). |
| ADX | 25.34 (1H) | Bullish | Moderately strong trend on 1H; Very strong downtrend on 4H (62.48). |
| Bollinger Bands | Mid Band | Watch | Above mid-band on 1H, below on 4H/1D. |
Key Levels for ETHUSD
Track markets in real-time
AI-powered analysis, technical indicators and real-time price data.
Join Our Telegram Channel
Breaking market news, AI analysis and trading signals instantly.
Join Channel