GBPUSD Tests Key Support at $1.33 Amidst Dollar Strength
GBPUSD is testing critical support near $1.33. With the DXY strengthening and technical indicators flashing mixed signals, traders are watching for a decisive move.
Having closely monitored the GBPUSD pair's intricate dance around the 1.33 handle, it's clear that this price point is more than just a number; it's a battlefield where conflicting market forces are currently locked in a tense standoff. The current price of $1.33 is precisely where a significant technical support level resides, a level that has historically acted as a floor during periods of consolidation and a springboard for potential rebounds. However, the prevailing macroeconomic winds, particularly the persistent strength of the US Dollar, are casting a long shadow, making the defense of this crucial zone a primary focus for both bulls and bears.
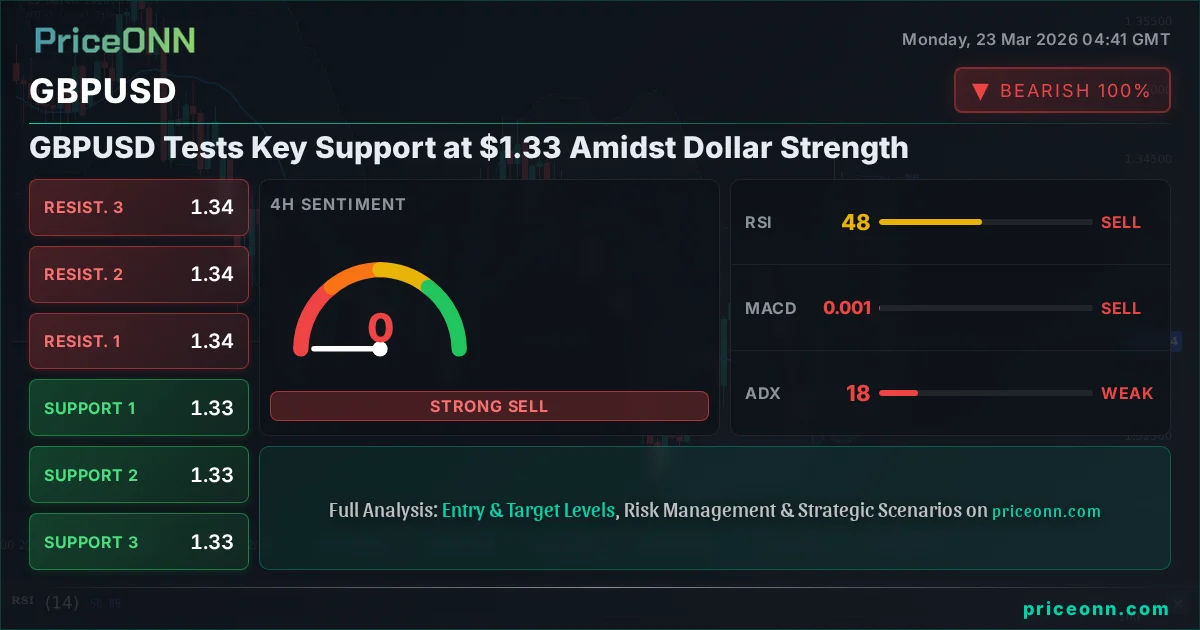
- GBPUSD is currently trading at $1.33, testing a critical support level identified at $1.3307.
- The US Dollar Index (DXY) is strengthening, currently at 99.46, adding pressure to GBPUSD.
- Technical indicators on the 1H chart show a mixed picture with RSI at 40.59 and MACD negative momentum, while the 4H chart shows a stronger bearish bias.
- A decisive close below $1.3307 on the 4-hour chart could signal a further drop towards $1.3279, a key support level.
- Conversely, holding above $1.33 could lead to a retest of resistance levels around $1.3334 and $1.3356, contingent on broader market sentiment shifts.
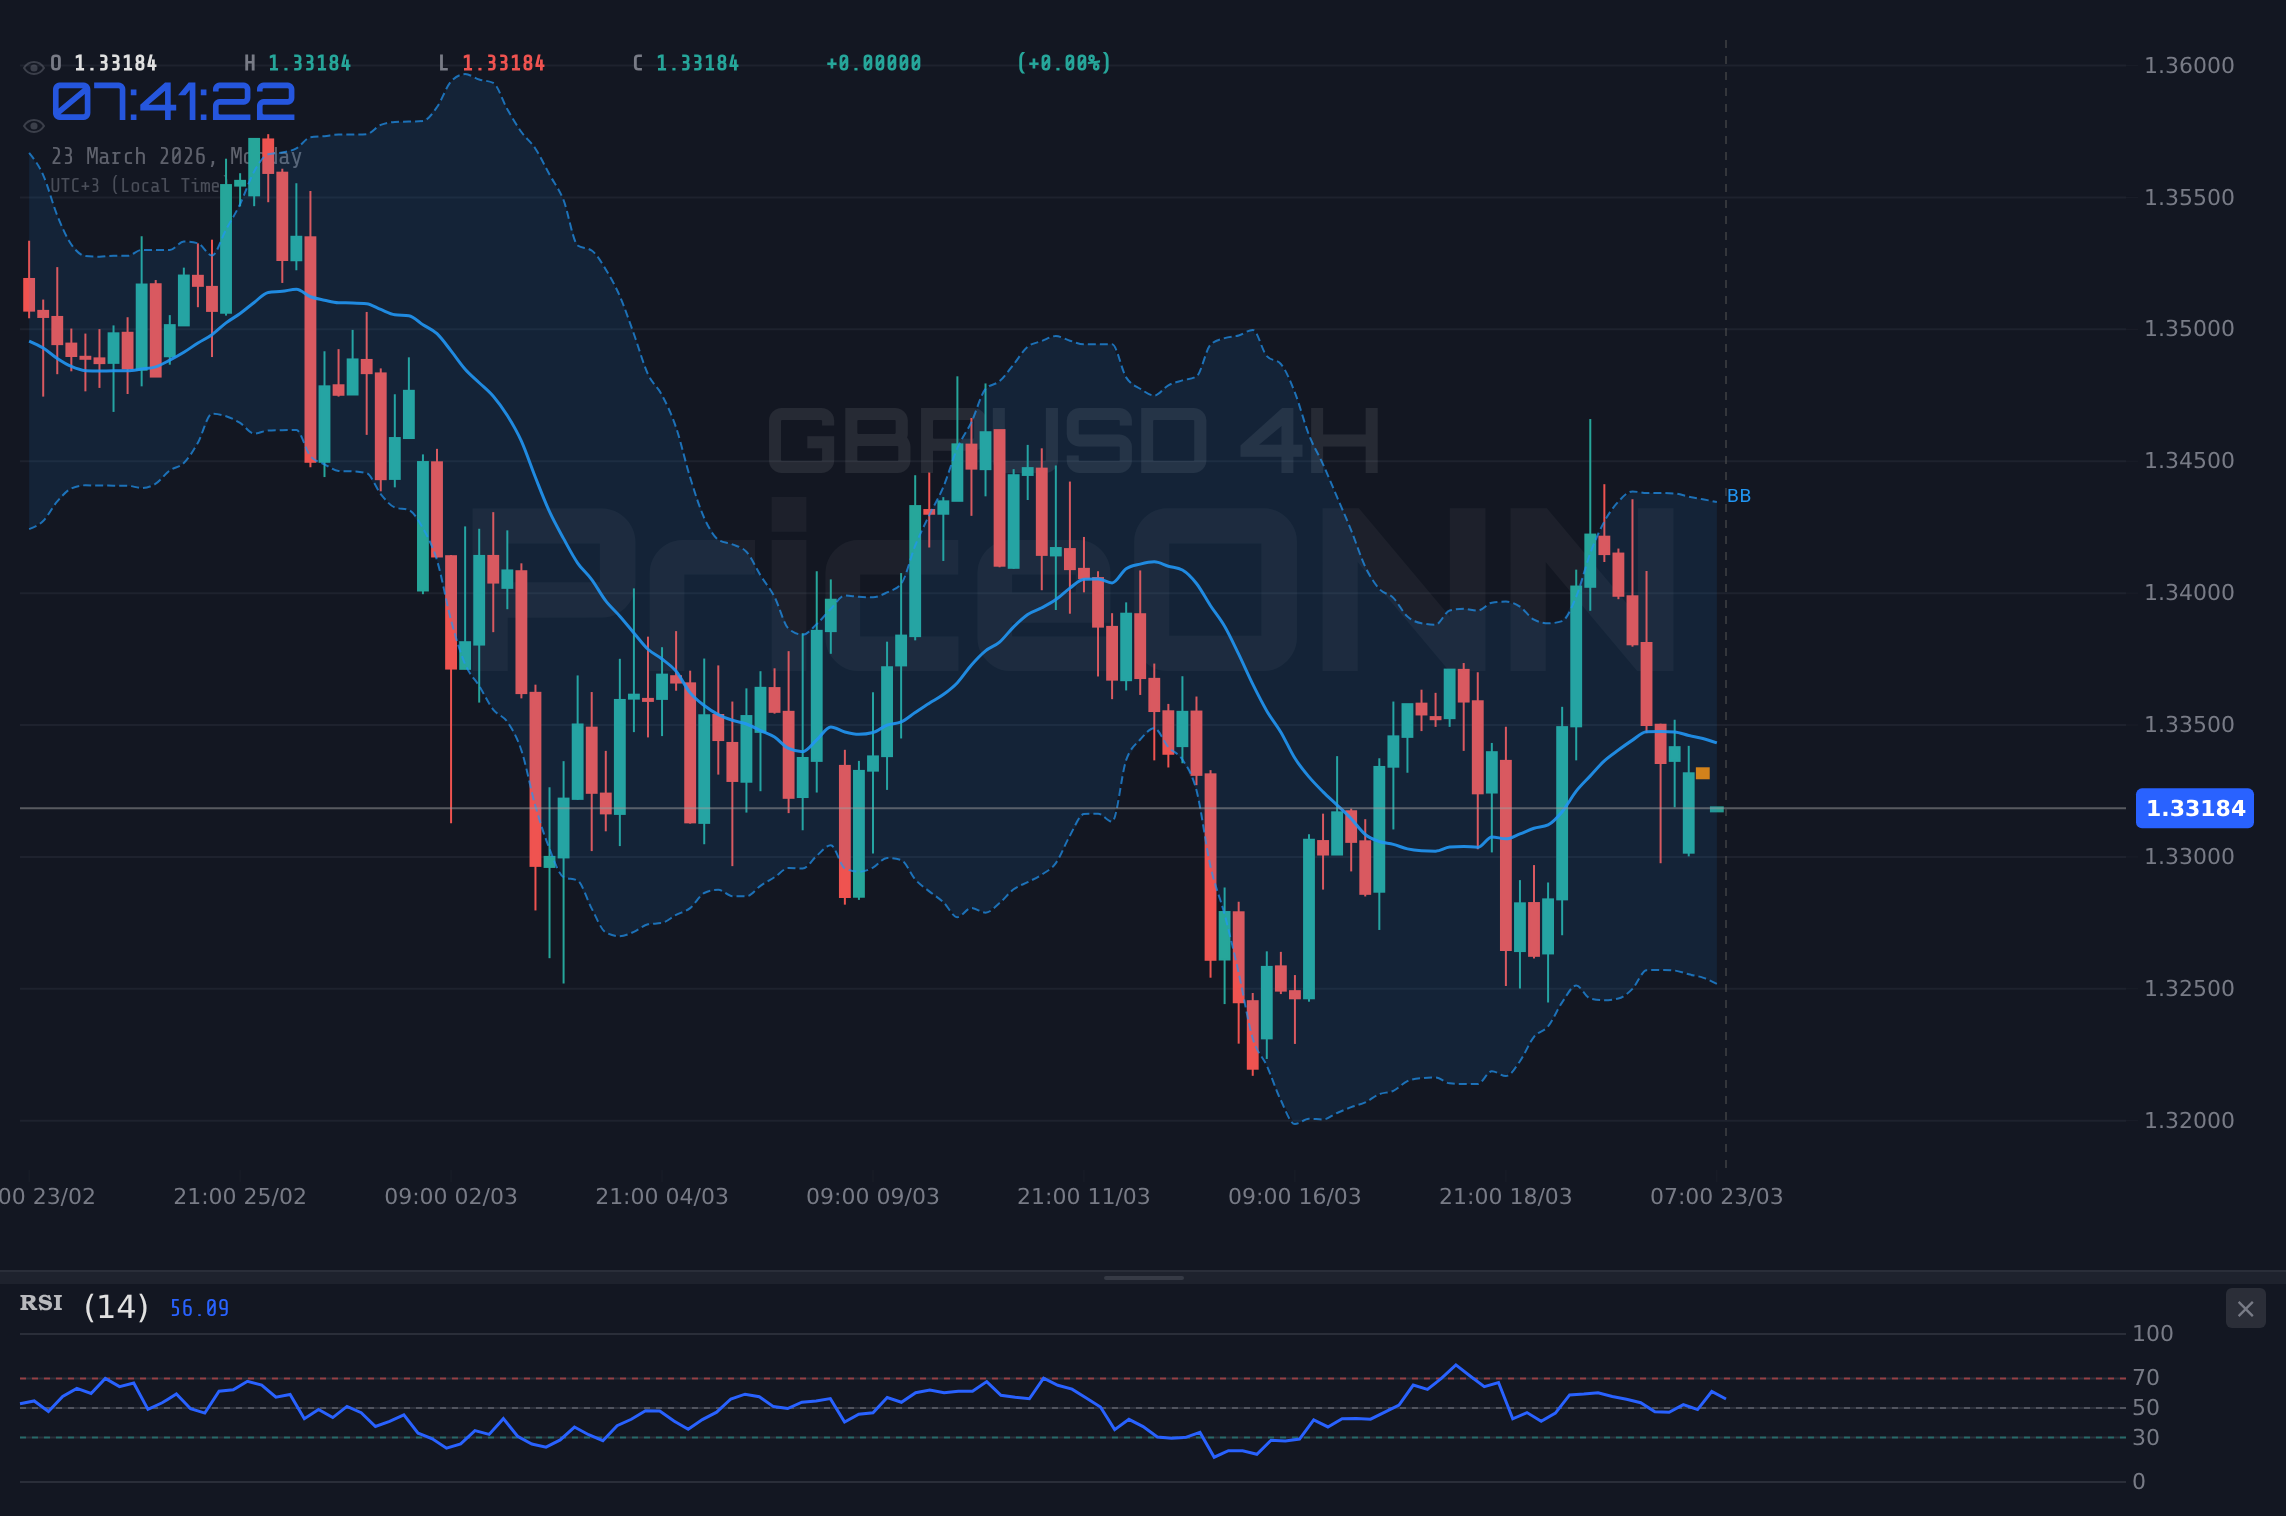
The technical landscape for GBPUSD is currently a complex tapestry, woven with threads of potential reversal and persistent downward pressure. On the 1-hour timeframe, the pair is hovering around the $1.33 mark, a psychological and technical pivot. While the ADX at 26.46 suggests a strong trend is attempting to establish itself, the conflicting signals from other indicators paint a picture of indecision. The Relative Strength Index (RSI) at 40.59 indicates a bearish lean but is far from oversold territory, leaving room for further downside. Similarly, the MACD is showing negative momentum, with its histogram below the signal line, reinforcing the bearish sentiment on this shorter timeframe. However, the Bollinger Bands on the 1H chart are currently positioned above the price, suggesting a potential for upward movement if the immediate pressure eases. This creates a delicate balance, where a slight shift in market sentiment could trigger a rapid move in either direction.
Diving deeper into the 4-hour chart reveals a more pronounced bearish bias, which is crucial for understanding the immediate to medium-term outlook. Here, the ADX reading of 17.72 suggests a less defined trend, which can often precede significant directional moves as market participants jockey for position. Despite this, the overall sentiment leans bearish, with the RSI at 47.77 hovering near the neutral zone but trending downwards, and the MACD continuing to display negative momentum. The Stochastic Oscillator, with %K at 32.58 and %D at 54.79, clearly signals a bearish crossover, indicating that downward pressure might be set to continue. The fact that the price is trading above the middle Bollinger Band on this timeframe, yet the overall trend signal is bearish, highlights the current chop and the need for a clear breakout catalyst. This choppy environment is precisely why the "WATCH_ZONE" decision is appropriate; the market needs to provide a clearer directional signal before a high-conviction trade can be initiated.
Looking at the daily chart, the picture becomes even more nuanced. The trend is officially classified as bearish with 90% strength, yet the ADX at 29.09 indicates a strong trend is indeed in play, a contrast to the weaker trend signals on the 4-hour chart. The RSI at 44.13 is firmly in neutral territory, suggesting neither extreme overbought nor oversold conditions, but it leans towards a bearish inclination. The MACD, however, presents a curious divergence: it shows positive momentum with the histogram above the signal line, contradicting the broader bearish trend and the RSI reading. This divergence is a critical piece of the puzzle; it suggests that while the bears might be in control on longer timeframes, there's underlying buying pressure that could spark a reversal if certain conditions are met. The Stochastic Oscillator on the daily chart, with %K at 55.42 and %D at 40.54, indicates a bullish crossover, further complicating the narrative and underscoring the need for careful observation before committing to a trade.
The strength of the US Dollar, as indicated by the DXY, is a significant factor influencing GBPUSD's trajectory. Currently trading at 99.46, the DXY is showing a clear upward trend on the daily timeframe, with strong ADX readings and positive momentum. This dollar strength acts as a headwind for GBPUSD, as a stronger dollar generally makes sterling less attractive to investors. The correlation is evident: as the DXY pushes higher, cable tends to face selling pressure. This dynamic is amplified when geopolitical tensions rise, as seen in recent headlines about escalating Middle East conflicts, which typically boost demand for the safe-haven dollar. The news flow from sources like Reuters and Bloomberg highlights how these geopolitical events can directly impact currency markets, creating volatility that traders must navigate. The observed rise in WTI oil prices past $100, driven by these tensions, further fuels inflation concerns, which in turn can indirectly support the dollar as the Federal Reserve is perceived to maintain a hawkish stance.
Now, let's talk about what needs to happen for a clear trading setup to emerge. The current environment, characterized by choppy price action and conflicting indicator signals, is not conducive to high-probability trades. For the bearish case to gain significant traction, we need to see a decisive break below the $1.3307 support level on a 4-hour closing basis. Such a move would invalidate the current consolidation and likely target the next significant support at $1.3279. This would confirm the bearish trend signaled by the longer-term charts and align the indicators more consistently. On the other hand, for a bullish reversal to take hold, GBPUSD would need to reclaim and hold above the $1.3334 resistance level. A daily close above this point, ideally accompanied by increasing volume and a shift in momentum indicators, would suggest that the dollar's strength is waning and that cable is poised for a recovery towards higher resistance levels.
The Role of Inflation and Interest Rate Expectations
The persistent strength of the US Dollar is intrinsically linked to global inflation concerns and the Federal Reserve's monetary policy stance. With crude oil benchmarks like WTI and Brent trading at elevated levels above $100 and $110 respectively, inflation fears are palpable. This environment often leads to speculation about future interest rate hikes or a prolonged period of higher rates by the Federal Reserve, which typically strengthens the dollar. Conversely, the Bank of England faces its own set of challenges, and any dovish signals from the BoE can further weigh on GBPUSD. The market sentiment analysis shows that while gold prices have dipped below $4,460 amid rising bond yields and inflation fears, the underlying narrative of inflation continues to support a stronger dollar. This macro backdrop creates a challenging environment for GBPUSD, where any bullish momentum needs to overcome significant dollar strength driven by these fundamental factors.
Navigating the Choppy Waters: What Traders Should Watch
For the short-term trader looking for immediate opportunities, the current price action around $1.33 presents a 'watch zone' rather than a clear entry signal. The ADX value of 17.72 on the 4-hour chart is particularly telling; it indicates a lack of strong directional conviction, meaning that any breakout attempt could be a 'fakeout' or a 'stop hunt' designed to trap unwary participants. Patience is paramount here. A scalper might look for very short-term moves within the $1.3300-$1.3335 range, but these are high-risk strategies. Swing traders, on the other hand, should wait for confirmation. A clean break and hold above $1.3356 would be a significant bullish signal, while a decisive drop below $1.3279 would confirm the bearish bias. The key is to avoid trying to catch a falling knife or betting against a strong dollar trend without clear technical evidence of a reversal. The market is currently providing mixed signals, and waiting for confluence across multiple timeframes and indicators is the prudent approach.
The Yen's Defensive Strength and its Implications
Interestingly, the Japanese Yen is showing signs of defensive strength amid escalating Middle East tensions, a point highlighted by recent forex analysis. While this might seem unrelated to GBPUSD directly, it speaks to a broader market theme of risk aversion, which often favors safe-haven assets and currencies, including the US Dollar. If geopolitical risks continue to escalate, we could see further demand for the dollar, reinforcing the bearish pressure on GBPUSD. This correlation underscores the importance of monitoring global risk sentiment, not just pair-specific technicals. The fact that the Yen is strengthening despite the dollar's overall rise suggests that capital is flowing towards perceived safety, a dynamic that can exacerbate weakness in riskier currencies or those tied to global growth prospects like the pound.
Considering the Path Forward: Scenarios for GBPUSD
Given the current technical indecision and the prevailing macroeconomic headwinds, several scenarios are plausible for GBPUSD. The most likely path in the short term, considering the dollar's strength and mixed daily signals, is continued consolidation or a slight bearish bias. However, a significant catalyst, such as unexpected inflation data or a dovish shift from the Fed, could alter this outlook dramatically. The key levels to watch remain $1.3307 as immediate support and $1.3334 as immediate resistance. A break below the former could open the door to $1.3279, while a decisive move above the latter might pave the way for a retest of $1.3356 and potentially higher levels if the dollar momentum falters.
Bearish Scenario: Dollar Dominance Continues
65% ProbabilityBullish Scenario: Support Holds, Dollar Weakens
25% ProbabilityNeutral Scenario: Consolidation Around $1.33
10% ProbabilityFrequently Asked Questions: GBPUSD Analysis
What happens if GBPUSD breaks below the $1.3307 support level?
A break below $1.3307 on a 4-hour closing basis would invalidate the current support and likely trigger further selling pressure. This scenario would align with the bearish bias seen on longer timeframes, potentially targeting the $1.3279 support level.
Should I buy GBPUSD at current levels of $1.33 given the RSI divergence on the daily chart?
Buying at current levels carries significant risk due to the strong dollar and bearish signals on shorter timeframes. While daily RSI divergence might hint at a potential reversal, confirmation is needed. A more prudent approach would be to wait for a confirmed break above $1.3334, or a clear bounce from $1.3279 with increasing volume, indicating genuine buying interest.
Is the MACD negative momentum a strong sell signal for GBPUSD at $1.33?
The negative MACD momentum on the 1-hour and 4-hour charts reinforces the bearish outlook for GBPUSD. However, it's crucial to consider it in conjunction with other indicators. The daily MACD showing positive momentum suggests potential underlying strength that could counter short-term selling, making it a signal to watch rather than an immediate sell trigger on its own.
How will the ongoing Middle East tensions affect GBPUSD this week, given the DXY is at 99.46?
Escalating Middle East tensions typically boost demand for the US Dollar, pushing the DXY higher. With the DXY currently at 99.46, this dynamic is already putting pressure on GBPUSD. If tensions worsen, expect further dollar strength and continued headwinds for GBPUSD, potentially accelerating a move towards lower support levels.
The market is at a critical juncture for GBPUSD. While the daily chart hints at potential underlying strength and the possibility of a reversal, the immediate pressure from dollar strength and bearish signals on shorter timeframes cannot be ignored. The $1.33 level is a key battleground. Traders must remain patient, manage risk diligently, and wait for clear confirmation before committing capital. The market always provides a second chance, and waiting for the right setup around these critical levels will be key to navigating this period of uncertainty and potentially capitalizing on future opportunities.
Track markets in real-time
AI-powered analysis, technical indicators and real-time price data.
Join Our Telegram Channel
Breaking market news, AI analysis and trading signals instantly.
Join Channel