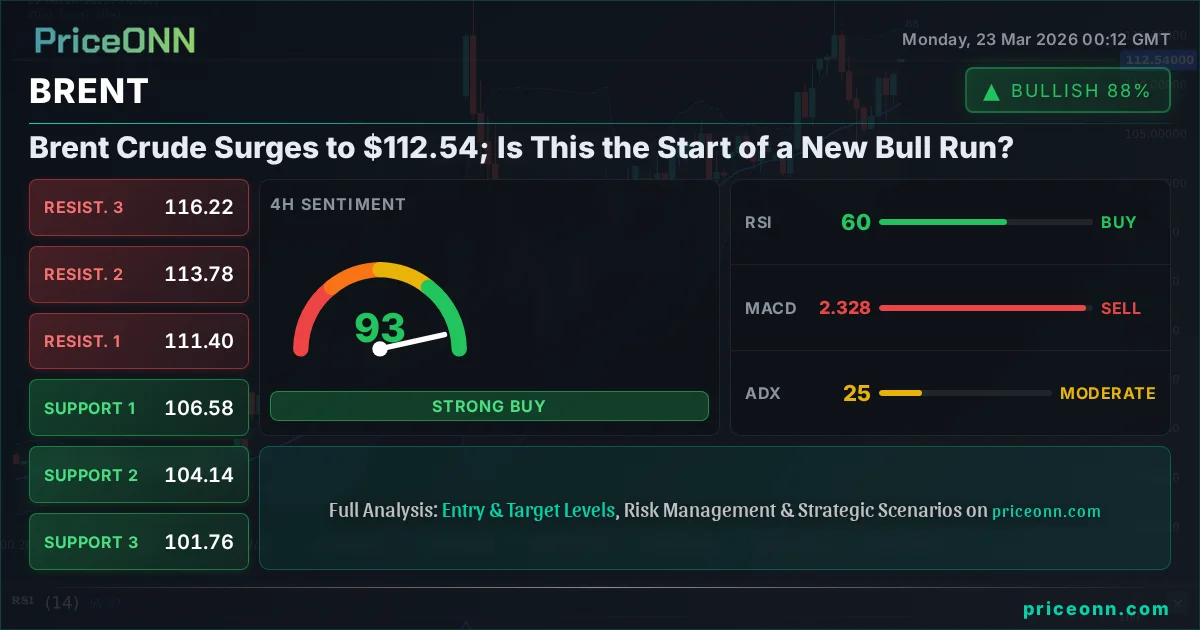
Brent Crude Surges to $112.54; Is This the Start of a New Bull Run?
Brent crude oil is trading at $112.54, experiencing a significant surge. Technical indicators suggest a potential shift, but key levels must hold.
Brent crude oil has staged a remarkable rally, breaking through key psychological barriers to reach $112.54. This sharp upward movement, a significant jump of 4.58% or $4.93 on the day, has caught many market participants off guard and has ignited discussions about whether this is a fleeting correction or the precursor to a sustained bullish trend. The energy market is dynamic, and understanding the confluence of factors driving this price action is crucial for navigating the current choppy waters.
- Brent crude is currently priced at $112.54, marking a significant daily gain of 4.58%.
- On the 1-hour chart, RSI stands at 61.07, indicating upward momentum but not yet extreme overbought conditions.
- Critical resistance is identified at $114.02, while support is holding firm around $111.06.
- The ADX at 17.96 suggests a currently weak trend, implying the recent surge may lack sustained commitment without further confirmation.
- Geopolitical tensions and supply concerns continue to underpin oil prices, though demand-side factors remain a key watchpoint.
The immediate price action on the 1-hour timeframe paints a picture of bullish momentum. With the Relative Strength Index (RSI) at 61.07, bulls are certainly in the driver's seat, pushing prices higher. This is not yet territory that screams 'overbought' – often considered above 70 – but it signifies a clear upward bias. The Moving Average Convergence Divergence (MACD) also shows positive momentum, with the MACD line above its signal line, reinforcing the bullish sentiment in the short term. Bollinger Bands are also showing price action above the middle band, suggesting an upward bias, though the bands themselves are not excessively wide, indicating that volatility, while present, is not yet at extreme levels.
However, the narrative becomes more nuanced when we expand our view to longer timeframes. On the 4-hour chart, while the general trend is still leaning bullish, the signals become more mixed. The RSI at 60.33 continues to suggest upward momentum, but the MACD is showing negative momentum, with the MACD line dipping below its signal line – a potential divergence from the shorter-term bullish signals. Stochastic oscillators are also showing a more cautious picture; while the %K line is above the %D line, indicating a potential for further upside, both are in mid-range territory, not signaling extreme conditions. This divergence between timeframes is precisely where prudent traders focus their attention.
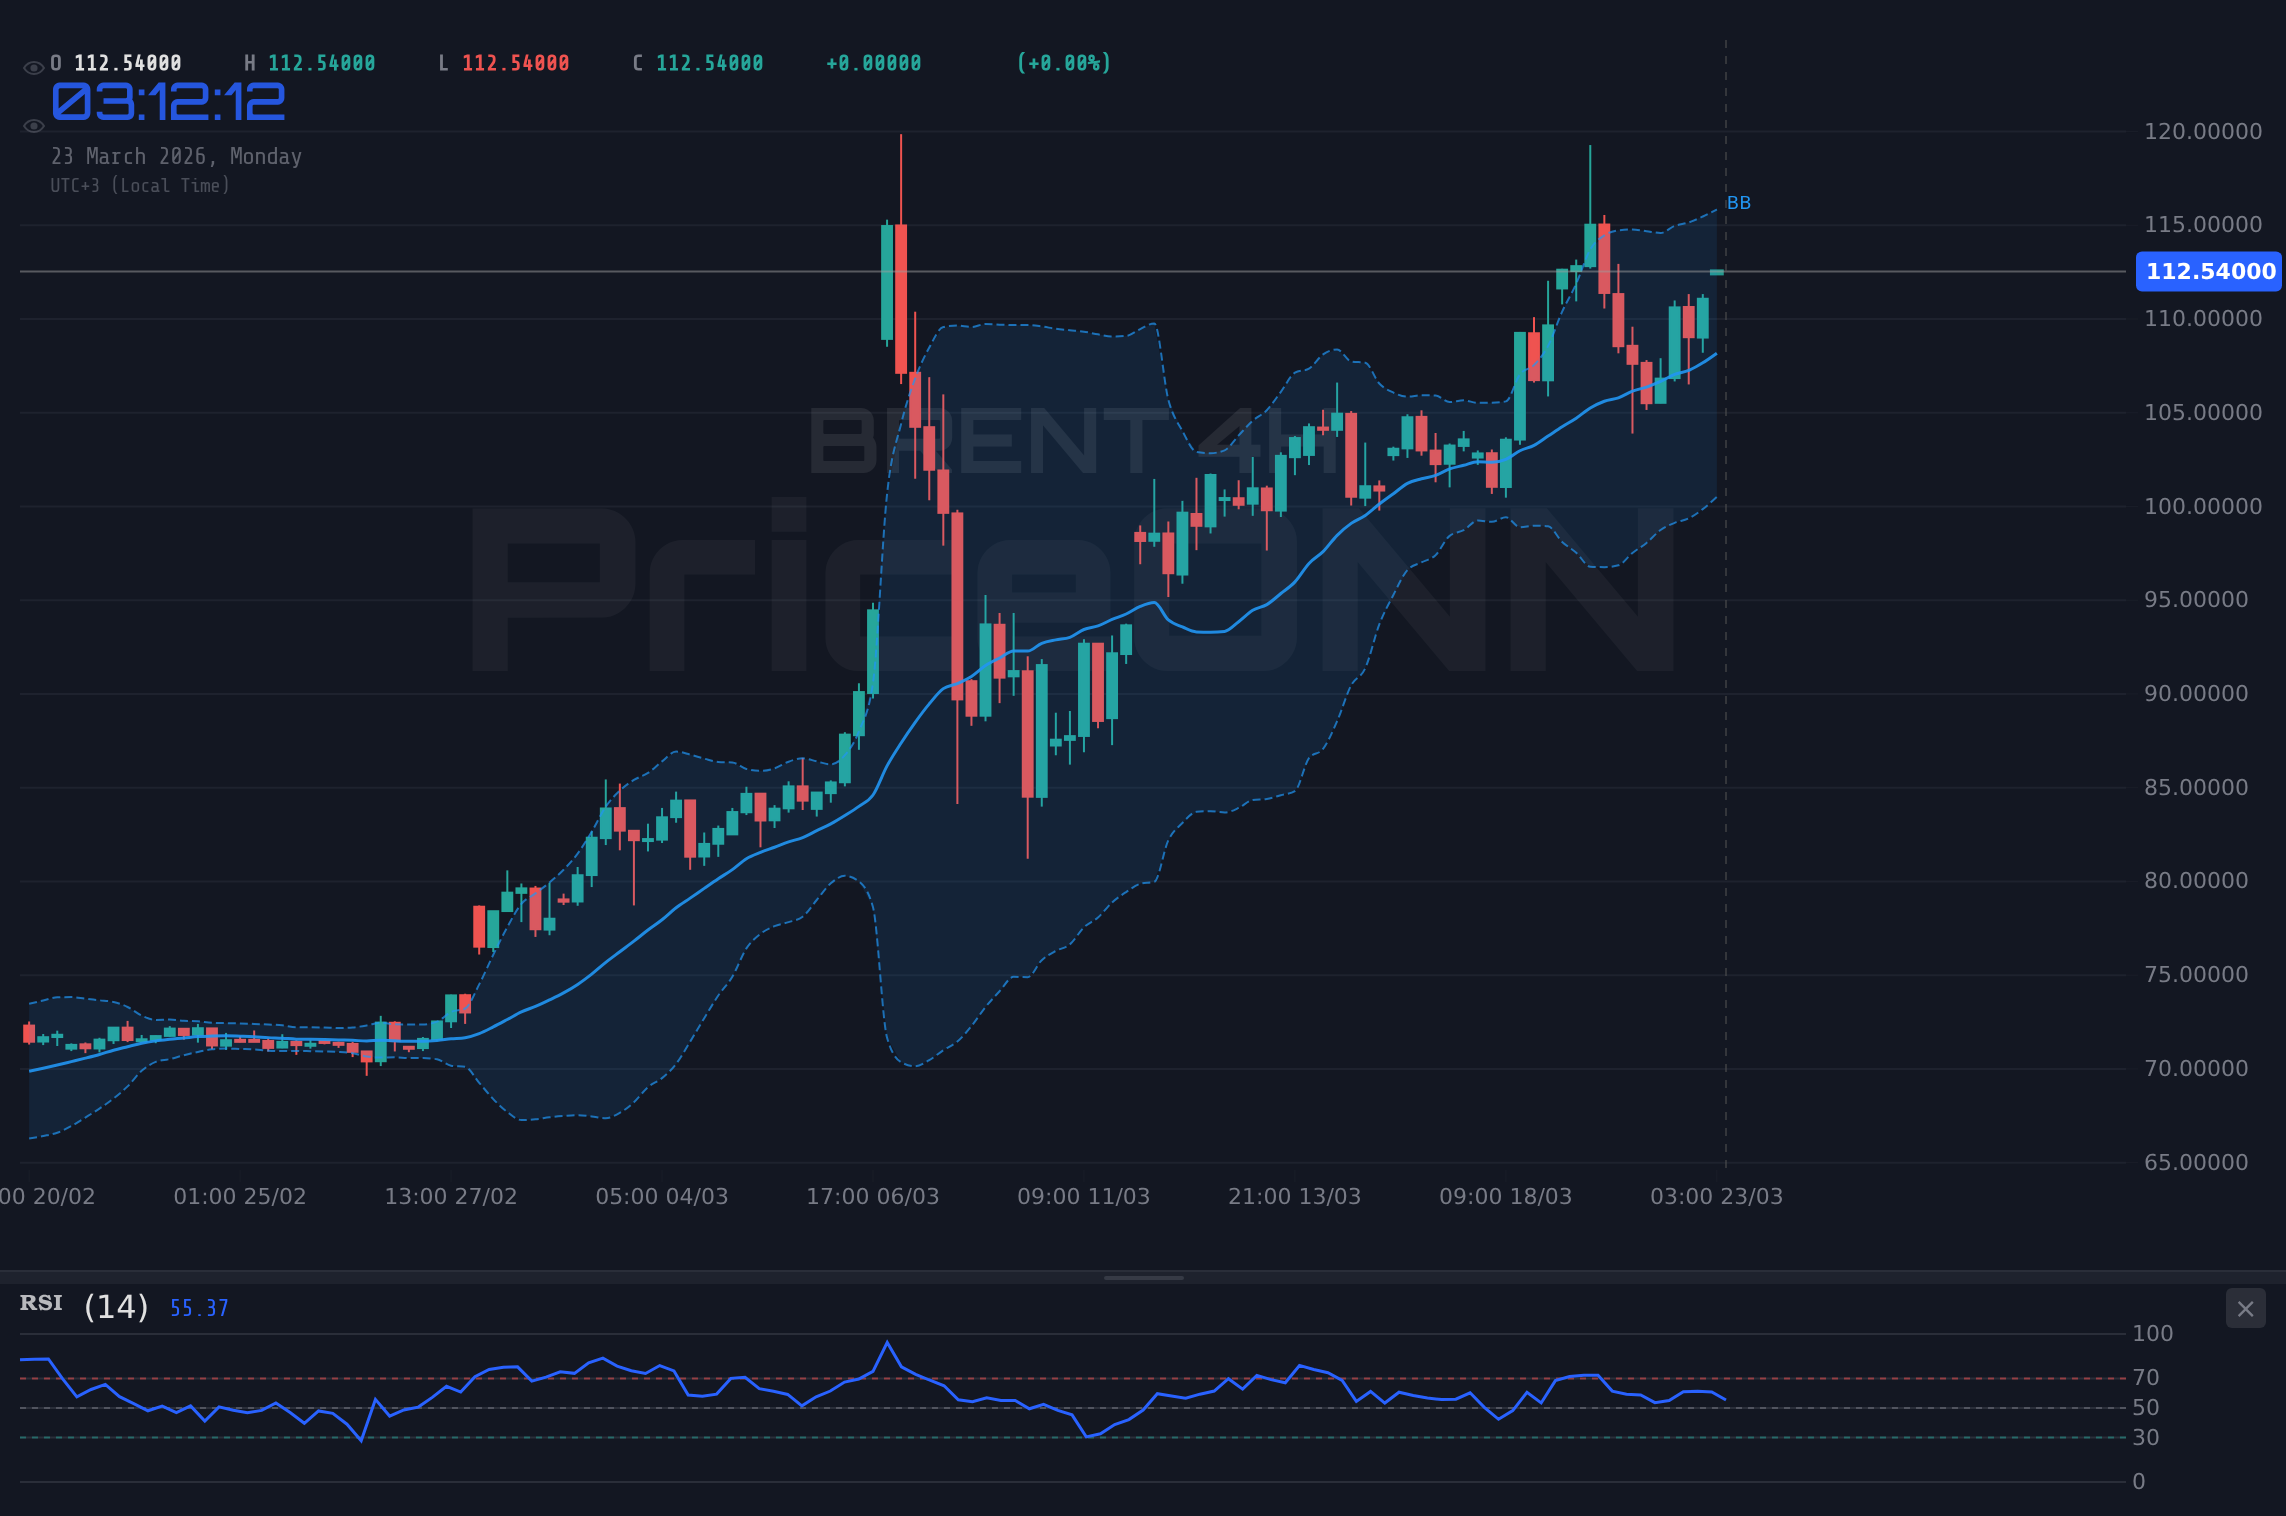
The daily chart presents an even more compelling picture, highlighting the need for caution amidst the recent surge. Brent crude is undeniably in a strong uptrend on the daily timeframe, with the RSI soaring to 82.44. This is firmly in overbought territory, signaling that the market may be due for a correction or at least a period of consolidation. The MACD is positive and above its signal line, confirming the strong uptrend, but the extreme RSI reading suggests that the buying pressure might be overextended. The Stochastic Oscillator, with %K at 74.74 and %D at 61.85, also confirms this overbought condition. Importantly, the Average Directional Index (ADX) on the daily chart is a robust 65.23, indicating a very strong trend. While strong trends can continue, they also carry a higher risk of sharp reversals when they eventually break.
This divergence in signals across timeframes is critical. The 1-hour and 4-hour charts show bullish momentum, potentially driven by immediate market sentiment or news flow. However, the daily chart's extreme RSI reading and the high ADX value suggest that the underlying trend, while strong, is potentially stretched. This creates a 'watch zone' scenario, as described in our trading framework. A strong trend can continue, but the risk of a pullback increases significantly when such extreme conditions are met on longer timeframes. The current price of $112.54 is a critical juncture, sitting above the 4-hour support of $111.40 but approaching daily resistance levels.
Navigating the Price Action: Key Levels and Scenarios
From a technical perspective, the $112.54 level for Brent crude is significant. It represents a point where short-term bullish momentum clashes with longer-term overbought conditions. The immediate support levels to watch are on the 4-hour chart at $111.40, followed by $106.58, and then the more distant $104.14. These are the levels where buying interest might re-emerge if the current upward pressure falters. On the resistance side, the immediate target is the daily resistance at $116.63. A decisive break above this level, especially on increasing volume, could signal a continuation of the bullish trend, potentially targeting the next resistance at $125.65.
The ADX reading of 17.96 on the 1-hour chart and 24.95 on the 4-hour chart is particularly telling. These values suggest that while there is upward movement, the trend strength hasn't fully committed. A strong trend typically sees ADX values above 25, and often much higher in powerful moves. This 'weak trend' reading in the shorter timeframes, despite the price surge, implies that the move might be more speculative or news-driven rather than a fundamental shift backed by sustained buying conviction across all time horizons. It suggests that the market is perhaps testing the resolve of sellers, but a true breakout requires more power.
Considering the current market environment, the geopolitical backdrop remains a significant driver for oil prices. News regarding supply disruptions, producer cartel decisions, or escalating international tensions can inject volatility and support higher prices. For instance, recent reports about potential supply constraints or production cuts by major oil-producing nations often translate into immediate price spikes. However, it's crucial to balance these supply-side factors with demand-side considerations. Economic growth data, particularly from major consumers like China and the United States, plays a vital role. Signs of economic slowdown can dampen demand expectations, creating headwinds for oil prices even amidst supply concerns.
The current surge in Brent crude prices to $112.54 appears to be fueled by a combination of factors. On the supply side, ongoing geopolitical risks and disciplined production from OPEC+ members continue to tighten the market. The recent reports highlighting Alaska's record oil and gas bids generating $163.7 million signal renewed investment in frontier exploration, but the immediate impact on global supply is limited. Simultaneously, while the narrative around renewable energy, like solar growth in conservative states, is important for the long-term energy transition, it doesn't negate the current, and likely sustained, reliance on fossil fuels for global energy needs. The question remains whether demand can keep pace with the constrained supply, especially as concerns about global economic health persist.
The correlation with the US Dollar Index (DXY) is also a key factor. With the DXY currently at 99.33 and showing a strong upward trend on the daily chart (ADX 34.64), a stronger dollar typically puts downward pressure on dollar-denominated commodities like Brent crude. However, the recent price action suggests that oil prices are either decoupling from this typical inverse relationship, or the bullish drivers for oil are strong enough to overcome dollar strength for now. This divergence warrants close monitoring, as a sustained strengthening of the dollar could eventually cap oil's upside potential.
Looking at the broader equity markets, the S&P 500 is down 1.84% to 6494.3, and the Nasdaq 100 has fallen 2.34% to 23822.14. This risk-off sentiment in equities often correlates with a flight to safety, which traditionally benefits commodities like gold. However, oil's behaviour here, rising amidst falling stocks, suggests that the primary driver is likely supply-side concerns or inflation expectations rather than a broad risk-on appetite. This makes the Brent rally more specific to the energy complex itself, rather than a general market uplift.
The trade recommendation for Brent crude is currently in a 'WATCH_ZONE'. The ADX at 17.96 on the 1-hour and 24.95 on the 4-hour charts indicates a moderate trend strength, but the conflicting signals across timeframes and the extremely overbought daily RSI at 82.44 make an immediate, high-conviction entry difficult. A valid setup would likely require further price action to confirm the direction. For instance, a daily close above the $116.63 resistance level, coupled with a cooling-off of the daily RSI or a bullish confirmation on the MACD across multiple timeframes, would strengthen the case for a long position. Conversely, a failure to hold above $111.06 support could signal a deeper correction, potentially targeting lower levels.
Bearish Scenario: Correction Looms
25% ProbabilityNeutral Scenario: Consolidation Phase
40% ProbabilityBullish Scenario: Breakout Confirmation
35% ProbabilityFrequently Asked Questions: BRENT Analysis
What happens if BRENT breaks above the $116.63 resistance level?
A sustained daily close above $116.63 would invalidate the current overbought signal on the daily RSI and could trigger a move towards the next significant resistance target at $125.65. This would require confirmation from MACD and ADX indicators on longer timeframes.
Should I buy BRENT at current levels of $112.54 given the mixed signals?
Given the 'WATCH_ZONE' recommendation and conflicting signals across timeframes, caution is advised. A more prudent approach would be to wait for a clear breakout above $116.63 or a retest and hold of the $111.06 support level, potentially offering a better risk-reward setup.
Is the daily RSI at 82.44 a sell signal for BRENT right now?
An RSI reading of 82.44 is firmly in overbought territory, which historically suggests a potential for a pullback or consolidation. However, in a strong uptrend, RSI can remain elevated for extended periods. Confirmation from other indicators and price action is needed before considering it a definitive sell signal.
How will the current DXY strength at 99.33 affect BRENT's price action this week?
A stronger DXY typically pressures dollar-denominated commodities like Brent. While Brent has shown resilience recently, a sustained rise in the dollar could cap upside potential. Traders should monitor if Brent can maintain its strength despite the headwinds from a strengthening dollar, which could indicate strong underlying demand or supply factors.
| Indicator | Value | Signal | Interpretation |
|---|---|---|---|
| RSI (14) | 61.07 | Bullish | Upward momentum, but watch for overbought conditions on daily |
| MACD Histogram | +1.25 | Bullish | Positive momentum on 1H, but check for divergence on 4H/1D |
| Stochastic | K:74.74, D:61.85 | Bullish | Overbought territory on daily, requires caution |
| ADX | 17.96 | Neutral | Weak trend strength on 1H; needs confirmation for sustained move |
| Bollinger | Middle Band | Watch | Price above middle band on 1H/4H, indicating bullish bias |
The energy markets are never dull, and the current action in Brent crude is a testament to that. While the $112.54 price point reflects a strong bullish push in the short term, the longer-term indicators, particularly the daily RSI, warrant a cautious approach. The 'WATCH_ZONE' recommendation is in effect, emphasizing the need for traders to wait for clearer signals. A decisive move above $116.63, supported by strong trend confirmation, could indeed signal the start of a new bull run, targeting higher levels. However, a failure to hold key supports around $111.06 could lead to a significant correction. Ultimately, staying disciplined, managing risk, and waiting for the market to provide clearer direction will be paramount for success in this dynamic environment.
Track markets in real-time
AI-powered analysis, technical indicators and real-time price data.
Join Our Telegram Channel
Breaking market news, AI analysis and trading signals instantly.
Join Channel