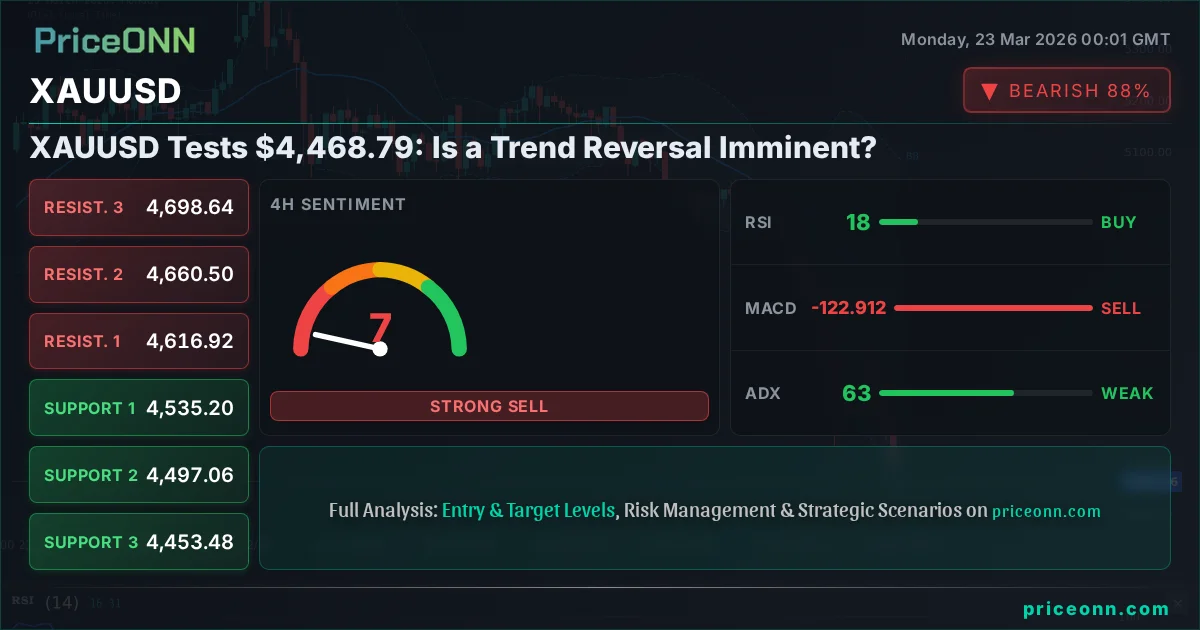
XAUUSD Tests $4,468.79: Is a Trend Reversal Imminent?
Gold is testing critical support at $4,468.79, with indicators flashing mixed signals. We analyze the technicals, key levels, and potential scenarios for XAUUSD.
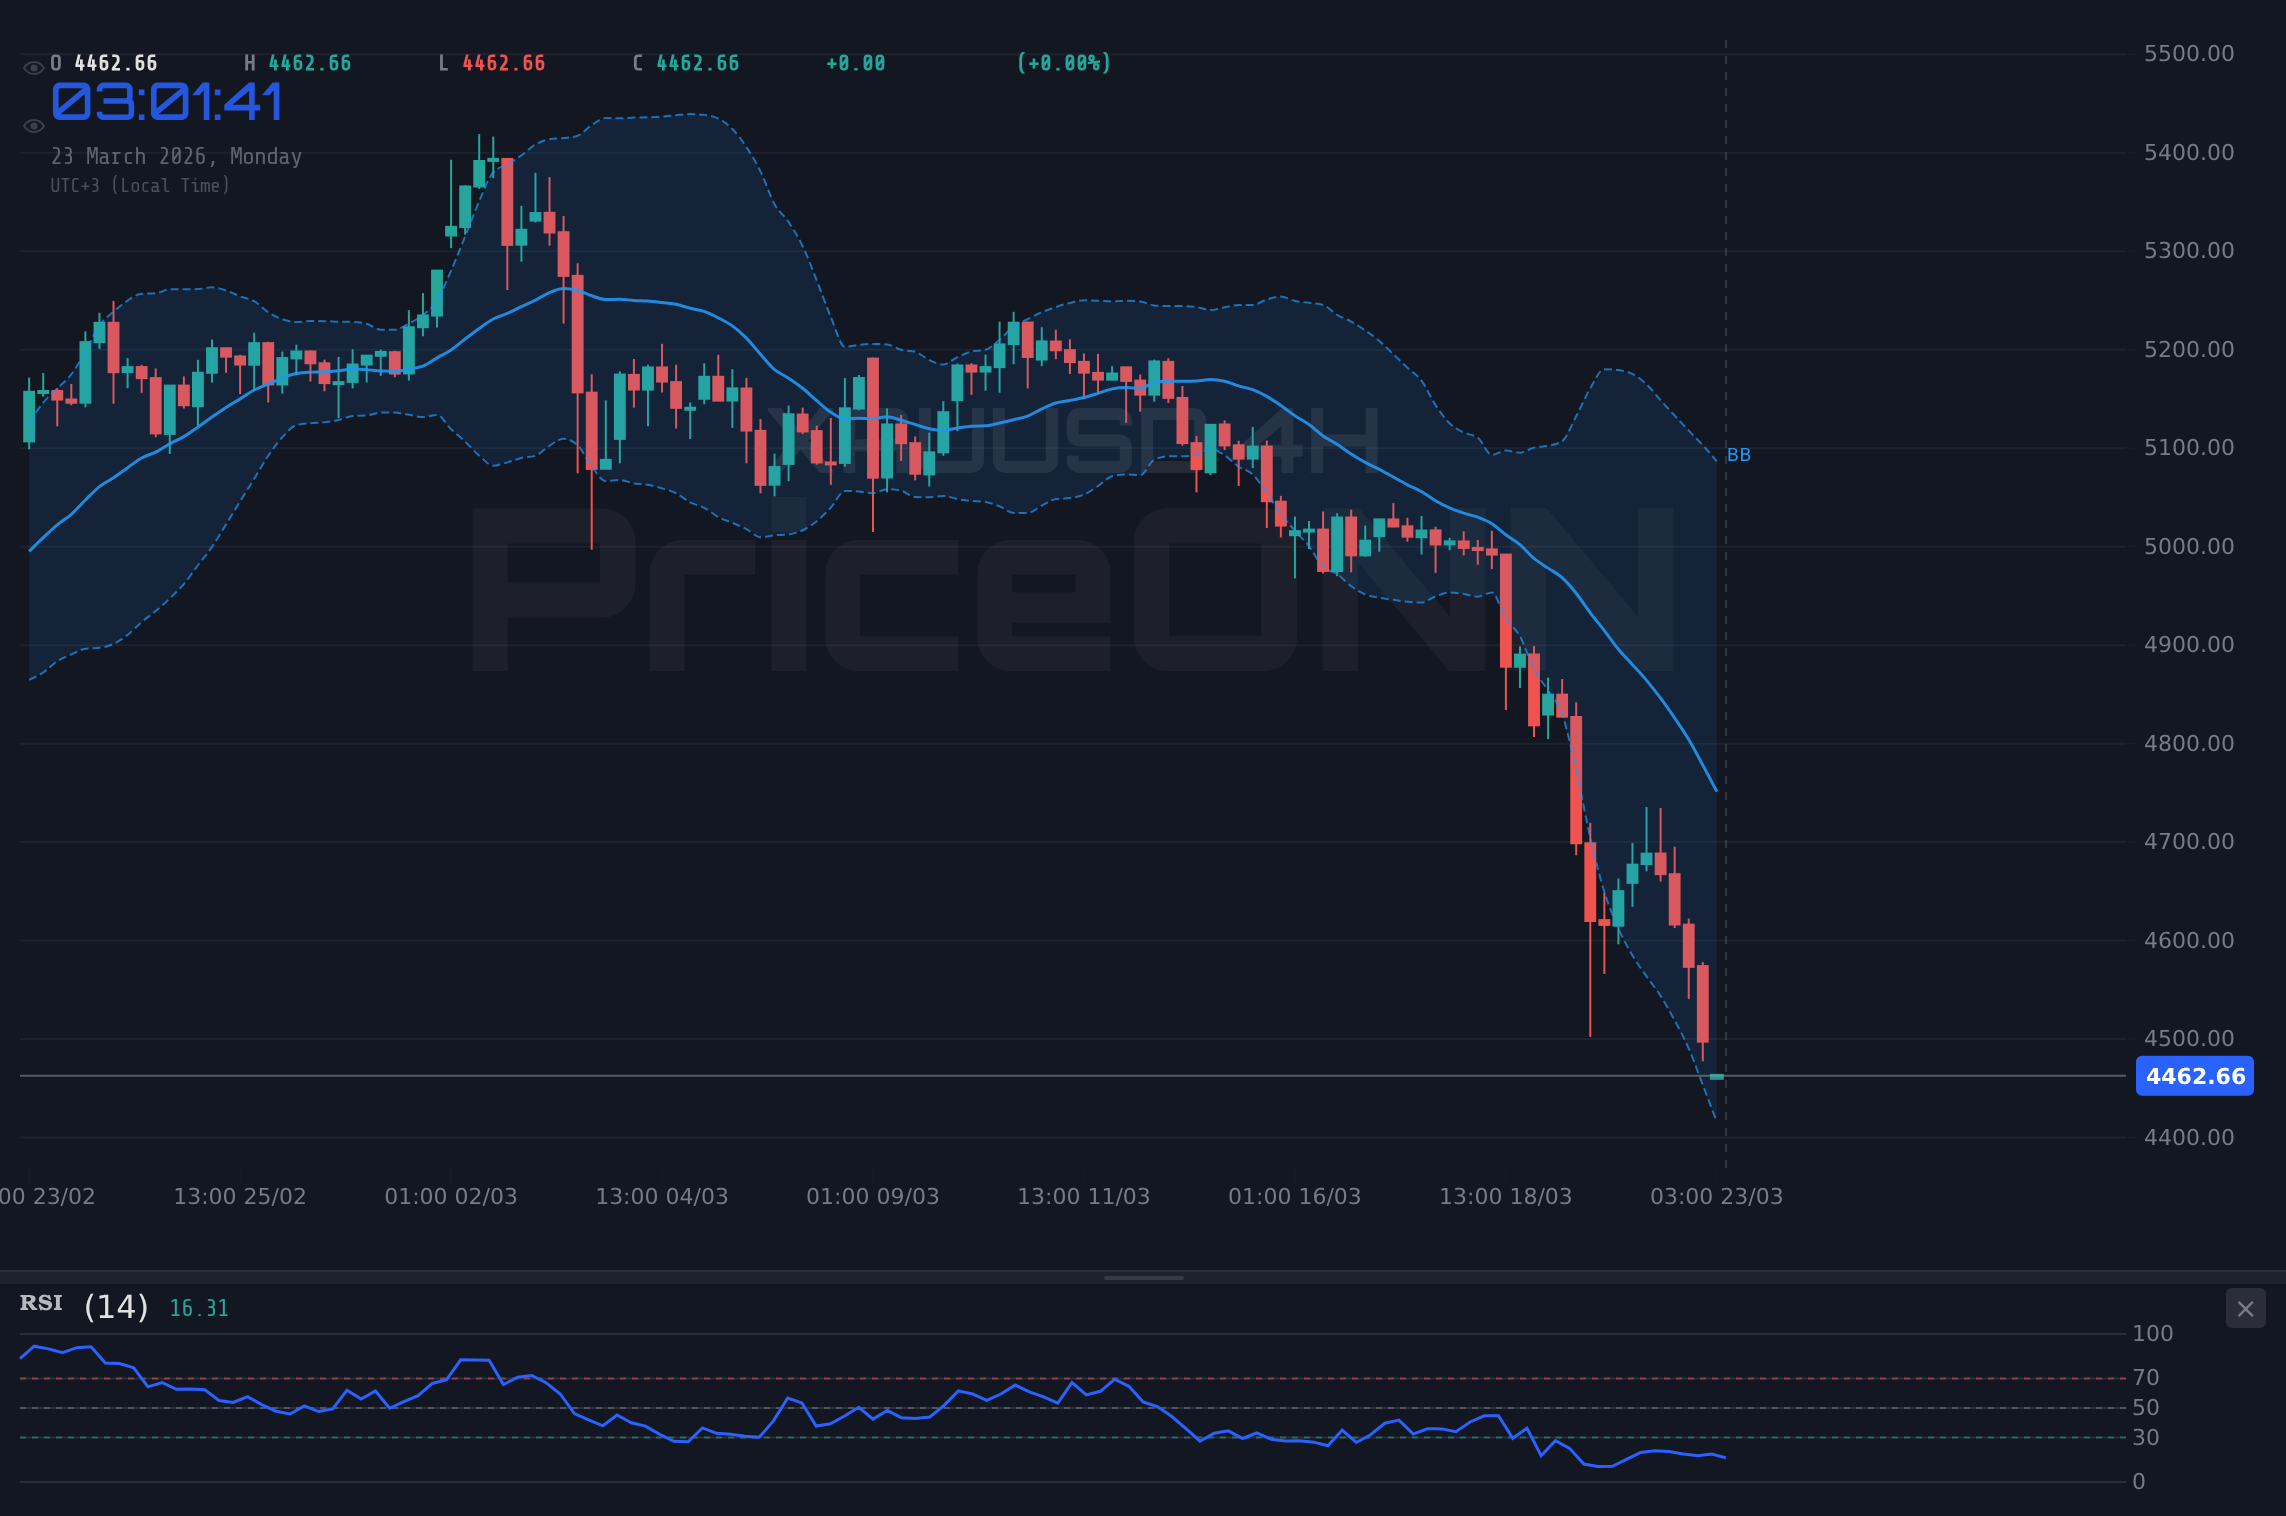
The relentless downward pressure on gold has brought XAUUSD to a crucial juncture, currently trading at precisely $4,468.79. This level represents a significant test of support, and the market's reaction here could dictate the short-to-medium term trajectory for the precious metal. After a sharp 3.9% decline, equating to a loss of $181.42 on the day, the bears appear to be momentarily pausing, but the underlying strength of the trend remains a dominant theme across multiple timeframes.
- XAUUSD is testing support at $4,468.79 following a sharp 3.9% daily decline.
- On the 1H chart, RSI is at 26.5 (oversold), but ADX at 34.59 signals a strong downtrend.
- The 4H trend is strongly bearish (ADX 63.37), with RSI at 17.96 indicating extreme oversold conditions.
- Daily timeframe shows a neutral trend (ADX 19.54) with RSI at 28.92, suggesting potential consolidation or a bottoming process.
- Key support levels are $4,453 and $4,408.19, while resistance is eyed at $4,539.36.
The stark contrast between the short-term oversold readings and the persistent strength of the downtrend across higher timeframes creates a complex picture for traders. On the 1-hour chart, the Relative Strength Index (RSI) at 26.5 is deep in oversold territory, typically signaling a potential bounce. However, this is countered by a robust Average Directional Index (ADX) of 34.59, indicating a strong downtrend is still very much in play. This divergence highlights the current tug-of-war between short-term exhaustion and the prevailing bearish momentum.
Moving to the 4-hour timeframe, the bearish sentiment intensifies. The ADX here surges to an impressive 63.37, confirming a very strong downtrend. The RSI plunges further to 17.96, an extreme oversold condition that, while often preceding a reversal, can also persist in powerful downward trends. The Stochastic Oscillator, with %K at 17.45 and %D at 34.86, further reinforces the bearish bias, showing %K below %D and in the oversold zone. The Bollinger Bands are also firmly below the middle band, confirming the downward pressure.
It's on the daily chart where we see a slight shift, or at least a lack of conviction from the bears. The trend strength, measured by ADX, drops significantly to 19.54, indicating a weak trend, potentially signaling consolidation or the exhaustion of the current move. The RSI at 28.92 remains in oversold territory, but the weaker ADX suggests that buyers might start to show interest if this level holds. However, the MACD remains negative, and the Bollinger Bands are hugging the lower band, suggesting that while the trend is weakening, the immediate pressure is still downwards. This daily perspective suggests that while the 4-hour and 1-hour charts scream 'sell', the daily chart is hinting at a potential pause or even a bottoming process if key support levels can hold.
Why $4,453 is the Line in the Sand
The immediate focus for gold traders will be on the support levels provided by the data. The first significant support is identified at $4,453. A break below this level on the 1-hour chart could lead to a retest of the $4,408.19 level, followed by $4,366.64. On the daily chart, these levels are slightly different, with $4,479.29 acting as immediate psychological support, followed by deeper levels at $4,308.39 and $4,114.55. The confluence of the 1-hour support at $4,453 and the psychological daily level around $4,479.29 makes the zone between $4,450 and $4,480 critically important.
Conversely, resistance on the 1-hour chart is seen at $4,539.36, followed by $4,580.91 and $4,625.72. On the daily chart, the resistance levels are much higher, starting at $4,844.03. This significant gap between immediate 1-hour resistance and daily resistance suggests that any short-term bounce might be capped before challenging the more substantial daily resistance zones. For a bullish reversal to gain traction, XAUUSD would need to decisively break through these near-term resistance levels and then establish a foothold above the daily resistance.
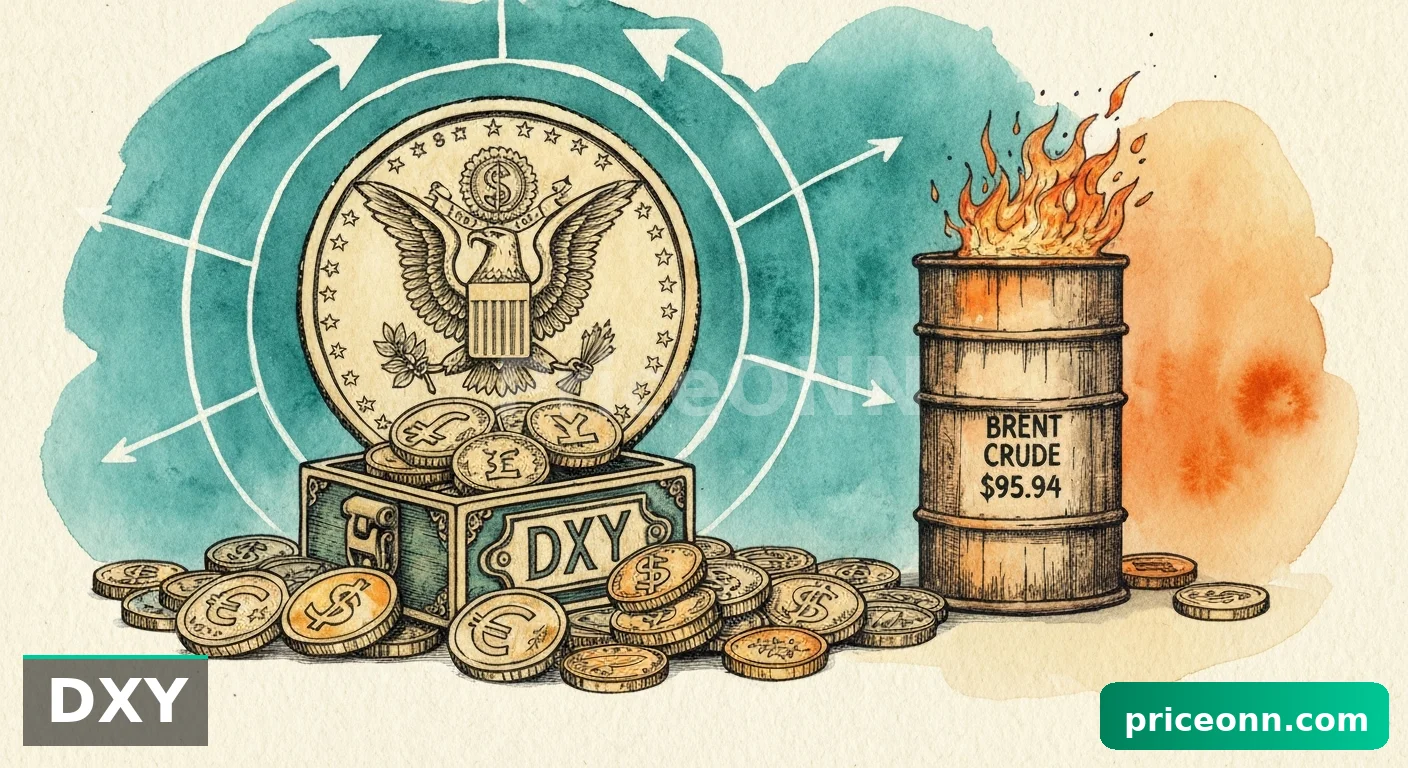
The correlation with the US Dollar Index (DXY) cannot be overstated. Currently, the DXY is showing a rising trend on the daily chart, trading around 99.34. A strong dollar typically exerts downward pressure on gold, as it becomes more expensive for holders of other currencies. The DXY's strength, particularly its daily uptrend with an ADX of 34.64, reinforces the bearish narrative for gold. If the DXY continues to climb, it will likely add to the headwinds faced by XAUUSD, making any bullish attempts more challenging.
The broader market sentiment, as indicated by the S&P 500 and Nasdaq, also plays a crucial role. Both indices are experiencing significant downturns, with the S&P 500 down 1.9% and the Nasdaq down 2.42%. This risk-off environment typically benefits safe-haven assets like gold. However, the current price action in gold suggests that either the safe-haven demand is not strong enough to counteract the selling pressure, or other factors, such as rising real yields or strong dollar, are dominating. The fact that equities are falling while gold is also falling is a bearish sign, indicating a potential deleveraging event across markets.
The Case for a Bounce: Technical Signals Aligning
Despite the prevailing bearish trend, several technical indicators are flashing potential buy signals, particularly on the shorter timeframes. The 1-hour RSI is deeply oversold at 26.5, and the Stochastic is also in oversold territory. While the ADX still indicates a strong trend, these oversold conditions can precede sharp, albeit potentially short-lived, bounces. If gold can hold the $4,453 support level, we might see a move back towards the $4,539.36 resistance. This would be a classic 'oversold bounce' scenario, where short-term traders capitalize on the extreme selling.
On the daily chart, the picture is slightly more constructive for a potential reversal, though still tentative. The ADX of 19.54 signals a weakening trend, and the RSI at 28.92, while oversold, is not as extreme as on the 1-hour or 4-hour charts. This could suggest that the market is consolidating and potentially building a base. A crucial confirmation for a bullish reversal would be a sustained break above the immediate daily resistance at $4,844.03, but realistically, the first hurdle is clearing the 1-hour resistance at $4,539.36 and then the 4-hour resistance at $4,616.92.
The MACD indicator across all timeframes (1H, 4H, 1D) shows negative momentum, with the MACD line consistently below its signal line. This is a bearish signal, indicating that selling pressure is dominant. However, in strongly trending markets, the MACD can remain negative for extended periods. A bullish divergence on the MACD, where price makes new lows but the MACD histogram starts to rise, would be a more compelling signal of a potential trend change. Currently, such a divergence is not clearly visible.
The current price action around $4,468.79 is critical. If this level holds, we could see a short-covering rally as traders who bet on further downside decide to take profits. This could push gold back towards the $4,500 psychological level and potentially higher. However, if $4,453 gives way, the floodgates could open, leading to a rapid decline towards the deeper daily support levels. The speed of the recent drop suggests that liquidity might be thin, meaning a break of support could be sharp and swift.
Geopolitical Tensions and Safe-Haven Demand
While the technical picture is currently dominated by bearish momentum, geopolitical tensions often act as a catalyst for gold's safe-haven appeal. News reports indicate ongoing global uncertainties, though no single major geopolitical event directly linked to gold's price action is currently dominating headlines. However, the general risk-off sentiment in equity markets, with both the S&P 500 and Nasdaq showing significant daily losses, could theoretically increase demand for gold. The fact that gold is falling alongside equities suggests that either the dollar's strength is the overriding factor, or there's a broader deleveraging happening where even safe havens are being sold to meet margin calls or reallocate capital.
The energy markets are also showing significant volatility, with Brent crude oil up 4.58% and WTI up 4.49%. Rising oil prices are often associated with increased inflation expectations, which historically supports gold as an inflation hedge. However, the current correlation seems to be broken, with gold succumbing to dollar strength and risk aversion. This disconnect warrants close observation; if inflation fears were to truly take hold, gold might find a stronger bid even amidst dollar strength.
Central bank buying, a significant driver for gold in recent years, is also a factor to consider for the longer term. While recent data on central bank purchases isn't immediately available in the provided context, sustained buying by institutions, particularly from emerging markets, has provided a structural bid for gold. If this underlying demand continues, it could provide a floor for prices, even if short-term technicals are bearish. However, in the immediate term, the technical sell-off appears to be overwhelming any fundamental long-term support.
Bearish Scenario: Downward Momentum Continues
65% ProbabilityNeutral Scenario: Consolidation Around $4,468
25% ProbabilityBullish Scenario: Oversold Bounce Potential
10% ProbabilityFrequently Asked Questions: XAUUSD Analysis
What happens if XAUUSD breaks below the $4,453 support level?
If XAUUSD breaks below $4,453, the bearish trend is likely to continue, targeting $4,408.19 and potentially $4,366.64 on the 1-hour chart. This would signal a failure of the current support zone and reinforce the strong downtrend observed on higher timeframes.
Should I buy XAUUSD at current levels of $4,468.79 given the oversold RSI?
Buying solely based on the oversold RSI at $4,468.79 carries significant risk due to the strong downtrend indicated by ADX 63.37 on the 4-hour chart. A more prudent approach would be to wait for confirmation, such as a hold of $4,453 support and a break above immediate resistance, or a clear bullish divergence across multiple timeframes.
Is the RSI at 26.5 a sell signal for XAUUSD right now?
An RSI of 26.5 is considered oversold, typically suggesting a potential for a bounce rather than a sell signal. However, in a strong downtrend, as indicated by the ADX, oversold conditions can persist. The MACD also shows negative momentum, so while oversold, it doesn't automatically translate to a buy signal; caution is advised.
How will the strong DXY trend affect XAUUSD this week?
The Dollar Index (DXY) is in a strong daily uptrend (ADX 34.64) around 99.34. This typically exerts downward pressure on gold prices, making it more expensive for foreign buyers. Continued DXY strength is a significant headwind for any XAUUSD recovery attempts, reinforcing the bearish outlook.
The current technical setup for XAUUSD paints a picture of extreme caution. While oversold conditions on shorter timeframes might tempt short-term traders looking for a bounce, the overwhelming bearish trend strength on the 4-hour chart and the persistent dollar strength suggest that downside risk remains elevated. The key will be how price action behaves around the $4,453 support. A failure here could lead to a rapid descent, while a hold might offer a brief respite. For now, patience and risk management are paramount. The market is clearly bearish, but the oversold readings do present a
potential for a short-covering rally. Traders should look for clear confirmation before committing to a direction. The battle between the strong dollar, risk-off equity markets, and the technical oversold conditions in gold will likely define the next move.
| Indicator | Value | Signal | Interpretation |
|---|---|---|---|
| RSI (14) | 26.5 | Oversold | Potential for bounce, but trend remains strong. |
| MACD | Negative | Bearish Momentum | MACD line below signal line, indicating selling pressure. |
| Stochastic | K=13.72, D=14.23 | Extreme Oversold | Both lines in oversold zone, indicating potential short-term reversal but confirms bearish trend. |
| ADX | 34.59 | Strong Trend | Confirms a strong downtrend is in progress on the 1H chart. |
| Bollinger Bands | Below Middle Band | Bearish Bias | Price is trading below the middle band, indicating downward pressure. |
Ultimately, the current price action around $4,468.79 presents a critical test for gold. While oversold indicators on shorter timeframes may suggest a potential for a short-term bounce, the dominant bearish trend, especially on the 4-hour chart with its ADX of 63.37, cannot be ignored. The strong DXY and risk-off sentiment in equities further compound the bearish pressure. Traders should remain vigilant, awaiting a clear signal. A hold of $4,453 could lead to a bounce towards $4,539, but a break below it might trigger further accelerated selling. Patience and strict risk management are paramount in this environment.
The market is cyclical, and every downturn plants seeds for the next rally. While the current technical picture for XAUUSD is undeniably bearish, the extreme oversold conditions, especially on the daily chart's weakening trend strength (ADX 19.54), suggest that a period of consolidation or a potential reversal could be on the horizon. However, until key resistance levels are decisively broken and confirmed by sustained buying pressure, caution remains the prevailing strategy. The interplay between dollar strength, equity market sentiment, and gold's own technical picture will be crucial in determining the next significant move.
Track markets in real-time
AI-powered analysis, technical indicators and real-time price data.
Join Our Telegram Channel
Breaking market news, AI analysis and trading signals instantly.
Join Channel