DXY Weekly Analysis: Bullish Climb Continues Above $99.25; Next Week Watch
The Dollar Index (DXY) holds above $99.25, extending its bullish climb. Key levels and indicators suggest continued upward momentum, but traders watch for potential consolidation.
The Dollar Index (DXY) has presented a compelling technical picture over the past week, consolidating its gains and showing resilience above the critical $99.25 mark. As we head into the weekend, the question on many traders' minds is whether this bullish momentum can be sustained, or if we are on the cusp of a significant shift. Having tracked the DXY's intricate dance with global economic indicators and geopolitical undercurrents, it's clear that the strength observed is not merely a fleeting trend but a reflection of deeper market dynamics. This past week, the DXY has demonstrated a remarkable ability to absorb selling pressure, a characteristic that often precedes further upside moves. We saw a notable push above 99.00, with the index reaching towards the upper bounds of its recent trading range. This upward trajectory, especially when viewed against the backdrop of global economic uncertainty and shifting central bank expectations, paints a picture of the dollar as a preferred safe-haven asset.
- RSI at 57.21 on the daily chart signals sustained bullish pressure, though approaching overbought territory.
- Critical resistance sits at $99.72, tested multiple times this week, with S1 support at $98.36.
- MACD histogram shows positive momentum, aligning with the upward trend, while ADX at 34.64 indicates a strong trend is in play.
- Fed rate hike expectations are a primary driver, influencing DXY's correlation with global risk sentiment and bond yields.
The dollar's recent performance has been a masterclass in technical fortitude. On the daily chart, the DXY closed the week significantly higher, reflecting a robust uptrend that has captured the attention of market participants worldwide. The price action has been characterized by higher lows and higher highs, a textbook definition of a bullish trend. This sustained upward movement is not happening in a vacuum; it's deeply intertwined with the evolving narrative surrounding global monetary policy, inflation concerns, and geopolitical stability. As major economies grapple with persistent inflationary pressures and the specter of stagflation, the DXY's strength can be interpreted as a flight to perceived safety and a bet on the Federal Reserve's continued resolve in managing inflation, even if it means higher-for-longer interest rates.
Bullish Momentum Validated by Technicals
Looking at the technical indicators, the picture for the DXY is largely constructive, especially when we examine the daily timeframe. The Relative Strength Index (RSI), a momentum oscillator, stands at 57.21. While this is not yet in the 'overbought' territory (typically considered above 70), it firmly indicates that buyers are in control and there is significant upward momentum. This reading suggests that the current rally has room to extend further before facing significant selling pressure.
Complementing the RSI, the Moving Average Convergence Divergence (MACD) indicator also paints a bullish tone. The MACD line remains above its signal line, and the histogram is printing positive values, albeit with some signs of slowing momentum as the week closes. This alignment suggests that the underlying trend is still upward, with buyers consistently stepping in at opportune moments. It’s crucial to remember that the MACD is a lagging indicator, but its current configuration supports the bullish thesis that has been in play.
Furthermore, the Average Directional Index (ADX) provides insight into the strength of the prevailing trend. With an ADX value of 34.64 on the daily chart, we are seeing a reading that confirms a strong trend. An ADX above 25 generally signifies a trending market, and a value in the mid-30s indicates that this trend has considerable power behind it. This reinforces the idea that the DXY's move is not just a minor fluctuation but a well-established directional move. The combination of these indicators - RSI showing room to run, MACD confirming positive momentum, and ADX validating trend strength - paints a technically sound bullish case for the Dollar Index.
Key Levels to Watch: Support at $98.36, Resistance at $99.72
From a price action perspective, the DXY has established clear levels that traders are keenly watching. The immediate support level is crucial for the continuation of the bullish trend. As per the provided data, the first level of support (S1) is located at $98.36. This level has acted as a floor during the recent upward swing, and a sustained hold above it would be vital for bulls to maintain control. If this support were to break decisively, it would signal a significant shift in market sentiment and could lead to a deeper correction. The subsequent support levels at $97.82 (S2) and $97.00 (S3) would then come into play, but the initial focus remains on $98.36.
On the upside, the DXY has been testing a significant resistance zone. The data points to R1 resistance at $99.72. This level has been a formidable barrier, with the index struggling to break and hold above it consistently throughout the week. A decisive breakout above $99.72, backed by strong volume, would be a significant bullish signal, potentially paving the way for a move towards the next resistance at $100.54 (R2) and eventually $101.08 (R3). The battle between buyers and sellers around the $99.72 mark will be a key determinant of the DXY's direction in the coming trading sessions. Observing how the price reacts to these levels, especially on increased volume, will provide valuable clues about the market's conviction.
The Fed Factor: Driving the Dollar's Strength
The DXY's ascent is inextricably linked to the Federal Reserve's monetary policy stance and market expectations surrounding future interest rate decisions. Recent economic data, while mixed in some areas, has generally pointed towards persistent inflation and a resilient US economy. This has led markets to recalibrate their expectations for Fed rate cuts. The narrative has shifted from aggressive rate cuts to a more cautious 'higher-for-longer' interest rate environment. This is a significant tailwind for the US dollar. Higher interest rates make dollar-denominated assets more attractive to investors seeking yield, thereby increasing demand for the dollar.
The CME FedWatch tool, which tracks market probabilities for Fed rate moves, reflects this shift. While specific probabilities fluctuate, the general sentiment has moved away from multiple rate cuts in the short term. This recalibration means that the yield on US Treasury bonds remains relatively elevated compared to other major economies. This yield differential is a powerful driver for currency markets, and as long as it favors the US dollar, we can expect the DXY to find support. Any hints from Fed officials about their commitment to fighting inflation, even at the risk of slowing economic growth, will likely be interpreted as dollar-positive.
Moreover, the relative economic performance between the US and other major economies plays a crucial role. While other regions might be facing more acute challenges, such as slower growth or greater geopolitical risks impacting their currencies, the US economy has shown relative strength. This divergence in economic outlook often leads to capital flows into the perceived safer and more robust economy, further bolstering the dollar. The DXY acts as a barometer for this relative strength, and its current upward trend is a testament to the market's ongoing confidence in the US economic engine and the Fed's policy path.
Correlation Analysis: DXY, Gold, and Equities
The DXY's movements have a profound impact on other major markets, most notably gold and global equities. Historically, there's an inverse correlation between the DXY and gold prices. When the dollar strengthens, gold, which is often priced in dollars, becomes more expensive for holders of other currencies. This can dampen demand and put downward pressure on gold prices. We saw this play out dramatically this week, with XAUUSD experiencing a significant drop of -3.2% to $4,501.45 as the DXY pushed higher. The RSI for gold on the 1H chart was deep in oversold territory at 29.46, indicating extreme selling pressure that coincided with dollar strength.
Conversely, a stronger dollar often correlates with a decrease in risk appetite, leading to sell-offs in equity markets like the S&P 500 and Nasdaq. This week's data shows the SP500 down -1.2% to 6,536.67 and Nasdaq down -1.67% to 23,986.80. This 'risk-off' sentiment benefits the dollar as a safe-haven asset. The DXY's rise, coupled with falling equities and gold, paints a clear picture of market participants seeking stability and liquidity in dollar-denominated assets. This interconnectedness is vital for traders to understand; a move in one market often signals potential movements in correlated assets, providing a more holistic view of market sentiment and potential trading opportunities.
The strength in the DXY, therefore, acts as a headwind for dollar-denominated commodities and riskier assets. This dynamic is particularly important for investors trying to navigate the current market environment. The interplay between the dollar, inflation expectations (often influenced by energy prices like Brent crude, which rose 4.58% to $112.54), and risk sentiment creates complex trading scenarios. Understanding these correlations allows for better risk management and more informed trading decisions, highlighting the importance of looking beyond a single asset's price action.
Geopolitical Undercurrents and the Dollar's Safe-Haven Appeal
Beyond the purely economic drivers, geopolitical tensions continue to play a significant role in bolstering the dollar's safe-haven status. While specific headlines change daily, the overarching theme of global instability - whether it's regional conflicts, supply chain disruptions, or political uncertainties in major economies - keeps demand for perceived safe assets elevated. The US dollar, backed by the depth and liquidity of its financial markets and the relative stability of its political system (despite domestic political noise), often benefits during such periods.
For instance, recent news highlighted an attack on Qatar's Ras Laffan energy hub, shifting the narrative around global gas markets. While this directly impacts energy prices (Brent crude's surge), broader geopolitical instability can create a ripple effect across markets, increasing demand for safe havens like the dollar. Similarly, ongoing tensions in Eastern Europe and the Middle East contribute to a general sense of caution among investors. In environments where risk aversion is high, capital tends to flow away from riskier, higher-yielding currencies and towards the perceived safety and stability of the US dollar.
This safe-haven demand is not merely theoretical; it translates into tangible buying pressure on the DXY. As investors and institutions reallocate capital to protect their portfolios, the dollar becomes a primary beneficiary. This dynamic can sometimes override purely economic data, adding another layer of complexity to DXY analysis. It underscores the importance of staying informed about global events and understanding how they might influence capital flows and, consequently, the dollar's valuation. The DXY's ability to hold its ground and even advance amidst such global uncertainties speaks volumes about its current role as a primary safe-haven currency.
1H and 4H Timeframes: Short-Term Dynamics
Shifting our focus to shorter timeframes, the 1-hour and 4-hour charts offer a granular view of the DXY's intraday and intra-week movements. On the 1-hour chart, the trend is currently marked as 'Düşüş' (Down) with a strength of 91%, which might seem counterintuitive given the overall bullish sentiment. However, this often reflects short-term pullbacks or consolidation phases within a larger uptrend. The RSI(14) at 51.03 is neutral, and the MACD is positive. The Stochastic oscillator, however, shows %K (55.81) below %D (68.58), suggesting some short-term bearish divergence or a potential pause. The ADX at 23.85 indicates a moderately trending market. The 'Genel Sinyal' (Overall Signal) on this timeframe is 'AL' (BUY), with 7 out of 8 indicators suggesting a buy, indicating that despite some short-term fluctuations, the intraday bias remains bullish.
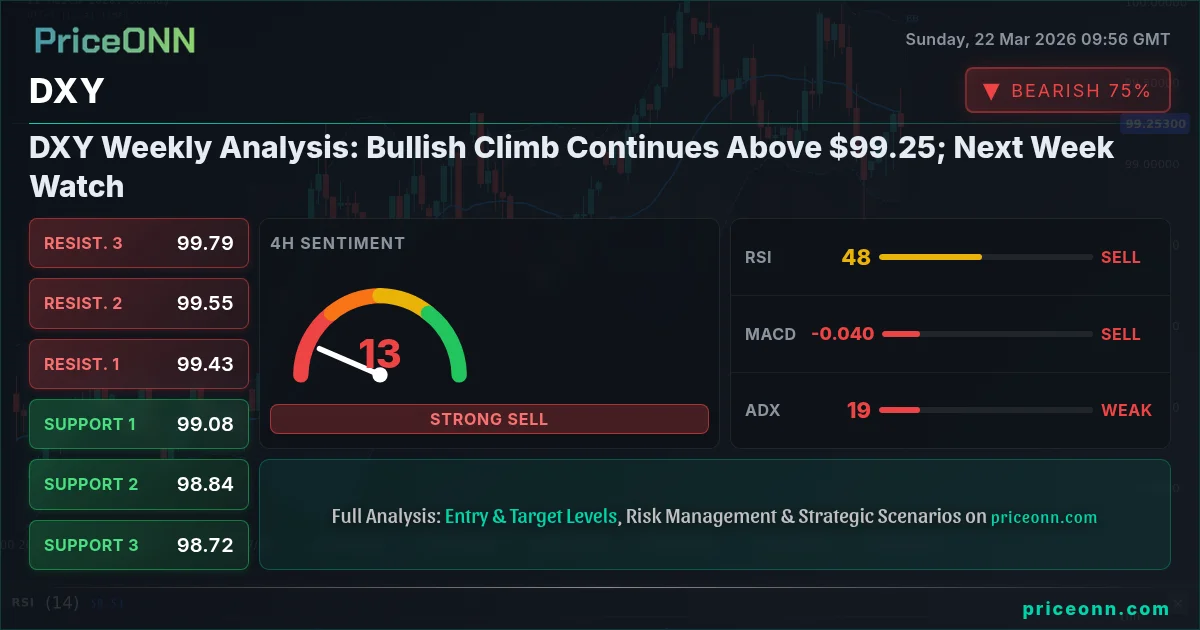
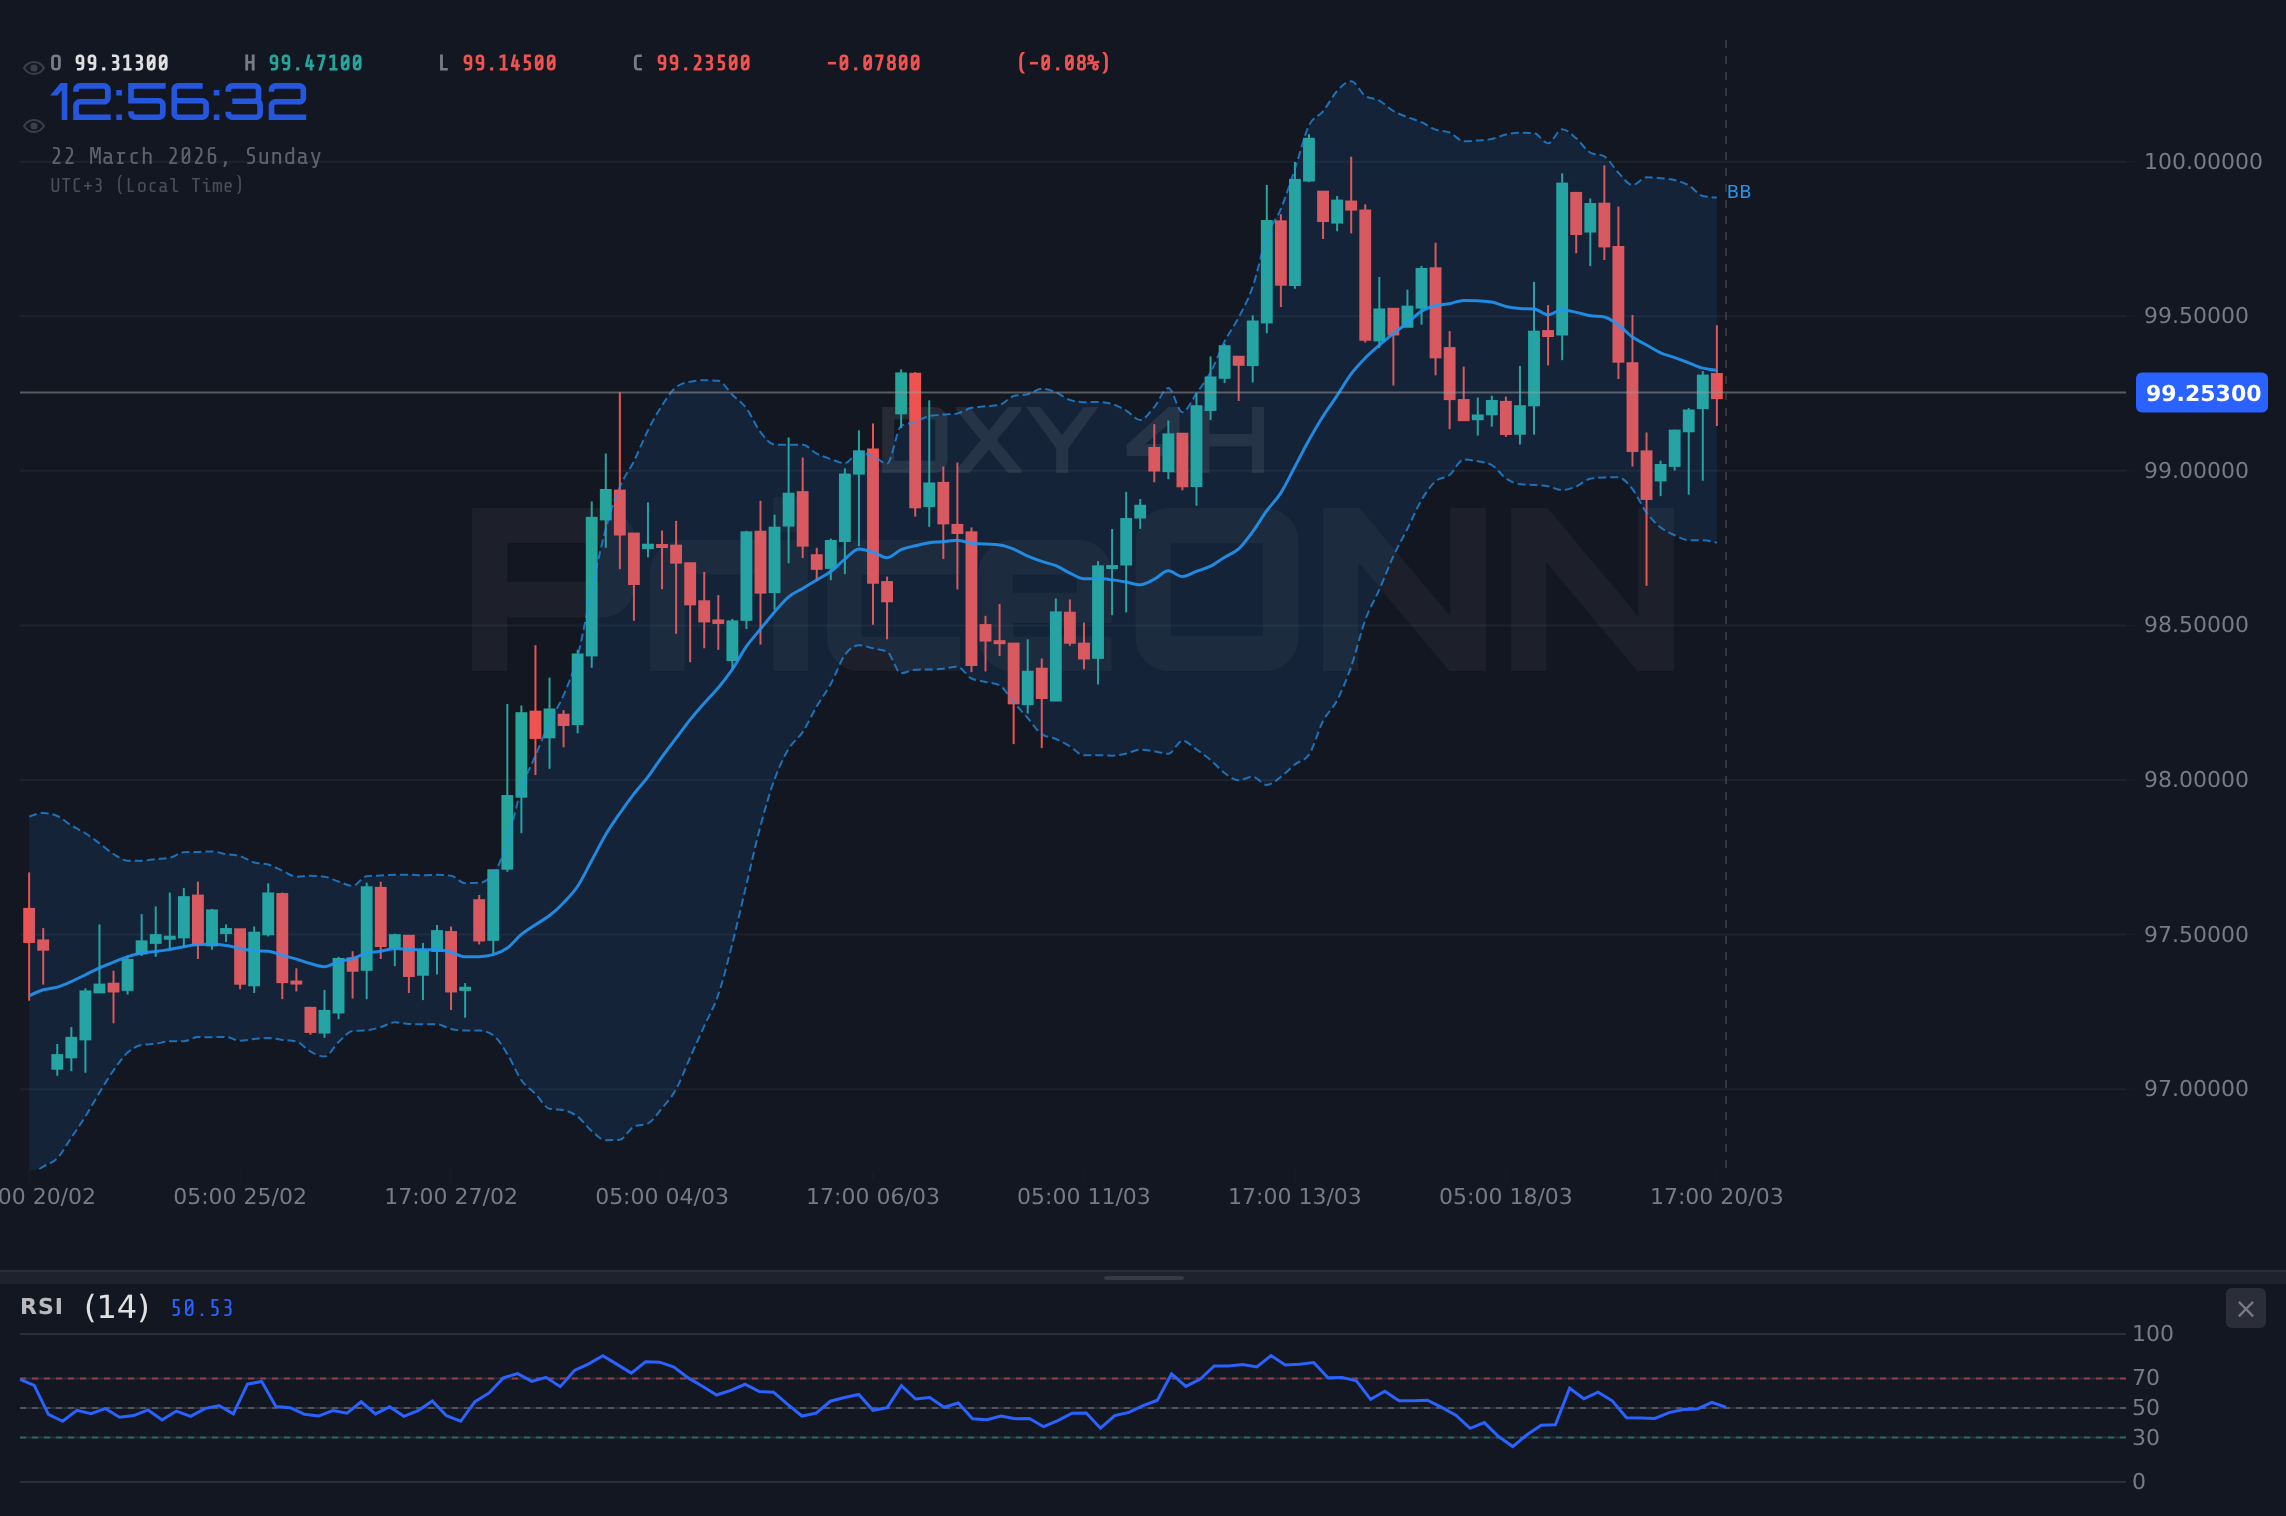
The 4-hour chart presents a slightly different, yet still predominantly bullish, picture. The trend is classified as 'Yükseliş' (Up) with 85% strength. The RSI(14) at 48.34 hovers near the neutral 50 level, suggesting a lack of strong momentum in either direction on this timeframe, but not necessarily a bearish signal. The MACD is negative, indicating short-term selling pressure. However, the Stochastic oscillator shows %K (45.91) above %D (31.67), which is a bullish signal. The ADX at 19.43 indicates a weak trend, suggesting that the 4-hour chart might be reflecting a period of consolidation or sideways movement rather than a strong directional push. Despite some mixed signals, the 'Genel Sinyal' (Overall Signal) here is 'SAT' (SELL) with 6 out of 8 indicators leaning bearish, which appears to contradict the daily trend. This highlights the importance of not relying on single timeframe analysis and looking for confluence across multiple timeframes.
The discrepancy between the daily's strong bullish trend and the mixed signals on intraday charts emphasizes the importance of context. Short-term fluctuations are normal within a larger trend. For instance, a pause near resistance levels on the 1-hour chart is expected. The key is to observe how these shorter-term patterns resolve. Does the intraday pullback find support at the identified S1 level of $98.36? Does the resistance at $99.72 hold firm on the 4-hour chart, or does it give way to a decisive breakout? These are the questions that shorter timeframes help us answer, providing crucial context for managing positions established based on longer-term analysis.
Trade Scenarios for the DXY: Navigating the Week Ahead
As we look ahead, the DXY finds itself at a critical juncture. The bullish momentum from the past week is undeniable, supported by technical indicators and fundamental drivers. However, the proximity to key resistance levels and the inherent volatility of currency markets mean that caution is warranted. Based on the current technical setup and market sentiment, we can outline a few potential scenarios for the upcoming week.
Bearish Reversal Scenario: Profit-Taking & Consolidation
15% ProbabilityConsolidation Scenario: Range-Bound Trading
35% ProbabilityBullish Continuation Scenario: Breakout Power
50% ProbabilityThe most probable scenario, based on the current technical strength and the prevailing fundamental narrative, leans towards continued bullish momentum. A decisive close above the $99.72 resistance level would likely trigger further upside, targeting $100.54 and potentially $101.08. This scenario is supported by the strong ADX reading and the RSI's position, which, while approaching overbought, still has room to extend. However, we cannot discount the possibility of consolidation, especially given the psychological significance of round numbers and the potential for profit-taking as the DXY approaches higher resistance zones. A failure to break above $99.72 could lead to a period of range-bound trading between $98.36 and $99.72. The bearish scenario, while less probable at this juncture, would be confirmed by a decisive break below the $98.36 support, opening the door for a more significant correction.
Economic Calendar Watchlist for the Coming Week
As we move into the next trading week, several key economic events could influence the DXY's trajectory. While the provided data does not include a detailed economic calendar for the upcoming week, we can anticipate key releases that typically impact the dollar. The Federal Reserve's monetary policy remains the primary focus. Any commentary from Fed officials regarding inflation, employment, or future rate path will be closely scrutinized. Market participants will be particularly attuned to any signals that might suggest a change in the 'higher-for-longer' interest rate narrative.
Furthermore, US inflation data, such as CPI or PPI reports, if scheduled, will be critical. Higher-than-expected inflation figures could reinforce the Fed's hawkish stance, supporting the dollar. Conversely, signs of cooling inflation might lead to a reassessment of rate cut expectations, potentially weakening the DXY. Employment data, including Non-Farm Payrolls (NFP) and unemployment rate figures, also holds significant sway. A strong labor market report would generally be dollar-positive, indicating economic resilience, while weak data could signal underlying economic weakness.
Beyond US data, the economic performance and central bank policies of other major economies, such as the Eurozone (ECB) and Japan (BOJ), will also be relevant. If the ECB signals a more dovish stance or if Eurozone growth falters, it could provide further impetus for the DXY's rise. Conversely, unexpected strength or hawkish signals from other central banks could create headwinds for the dollar. Traders will be closely monitoring these releases, looking for any data that might challenge the current market narrative or provide a catalyst for a significant move in the DXY.
The Trader's Perspective: What to Watch Next Week
For traders, the DXY presents an interesting, albeit slightly choppy, technical setup. The ADX reading of 34.64 on the daily chart confirms a strong trend, but the intraday charts show some conflicting signals and consolidation near resistance. This suggests that while the overall bias is bullish, the market might be in a phase of digestion before the next significant move. The key takeaway is to respect the levels. The $99.72 resistance and $98.36 support are paramount. A clear break and hold above $99.72, especially on increased volume, would be the primary signal to look for to confirm a continuation of the bullish trend towards $100.54 and $101.08.
Conversely, a failure to overcome $99.72, coupled with a break below $98.36, would invalidate the immediate bullish outlook and suggest a move lower. In such a scenario, the focus would shift to the lower support levels. The current 'WATCH_ZONE' classification is appropriate here. The market is not yet presenting a low-risk, high-probability entry setup for a strong directional trade. Instead, conditions are forming that *could* lead to a valid setup. A daily close above $99.72 would significantly strengthen the bullish case and potentially open the door for a more confident entry, targeting the higher resistance levels. Until then, patience and disciplined risk management are key. Waiting for confirmation above resistance or a clear bounce from support is crucial for navigating this potentially range-bound environment.
The current technical condition, with the ADX indicating a strong trend but price action showing consolidation near resistance, creates a 'WATCH_ZONE' scenario. This means we are observing the market for a clear signal rather than actively trading a defined setup. The critical level to watch is the $99.72 resistance. A decisive daily close above this level, supported by increasing volume and positive MACD momentum, would be the trigger for a potential bullish continuation. This would signal that the bulls have overcome the immediate selling pressure and are ready to push the DXY towards higher targets. Until such a breakout occurs, the market remains in a state of flux, offering opportunities for nimble traders but demanding caution from those seeking clearer directional trades.
Frequently Asked Questions: DXY Analysis
What happens if DXY breaks decisively above $99.72 resistance?
A confirmed daily close above $99.72 would signal strong bullish momentum, potentially triggering a move towards the next resistance levels at $100.54 (R2) and $101.08 (R3). This breakout would be supported by bullish technical indicators like RSI and MACD, confirming the continuation of the upward trend.
Should I consider buying DXY at current levels around $99.25 given the RSI at 57.21?
Buying at current levels requires caution. While the RSI at 57.21 shows bullish momentum, the DXY is near significant resistance at $99.72. A more prudent approach would be to wait for a confirmed breakout above $99.72 or a clear bounce from support near $98.36 to establish a higher probability trade.
Is the ADX at 34.64 a definitive sell signal for DXY, suggesting the trend is ending?
No, an ADX of 34.64 on the daily chart actually confirms a strong existing trend, not its end. This indicates that the current upward move has significant power. While it suggests the trend is strong, it doesn't inherently signal a reversal; rather, it supports the idea that the existing trend has conviction.
How will upcoming Fed commentary affect DXY's price around $99.25 this week?
Hawkish Fed commentary, emphasizing inflation concerns and a 'higher-for-longer' rate policy, would likely support the DXY, potentially pushing it towards $99.72 resistance and beyond. Conversely, dovish signals might lead to profit-taking, testing support levels like $98.36.
Technical Outlook Summary
| Indicator | Value | Signal | Interpretation |
|---|---|---|---|
| RSI (14) | 57.21 | Bullish | Positive momentum, room to extend. |
| MACD Histogram | Positive | Bullish | Confirms upward trend. |
| Stochastic | K:55.81, D:68.58 | Bearish | Short-term divergence, watch for confirmation. |
| ADX | 34.64 | Bullish | Strong trend in play. |
| Bollinger Bands | Mid Band Breakout | Bullish | Price above middle band. |
Key Levels
Support Levels
Resistance Levels
Track markets in real-time
AI-powered analysis, technical indicators and real-time price data.
Join Our Telegram Channel
Breaking market news, AI analysis and trading signals instantly.
Join Channel