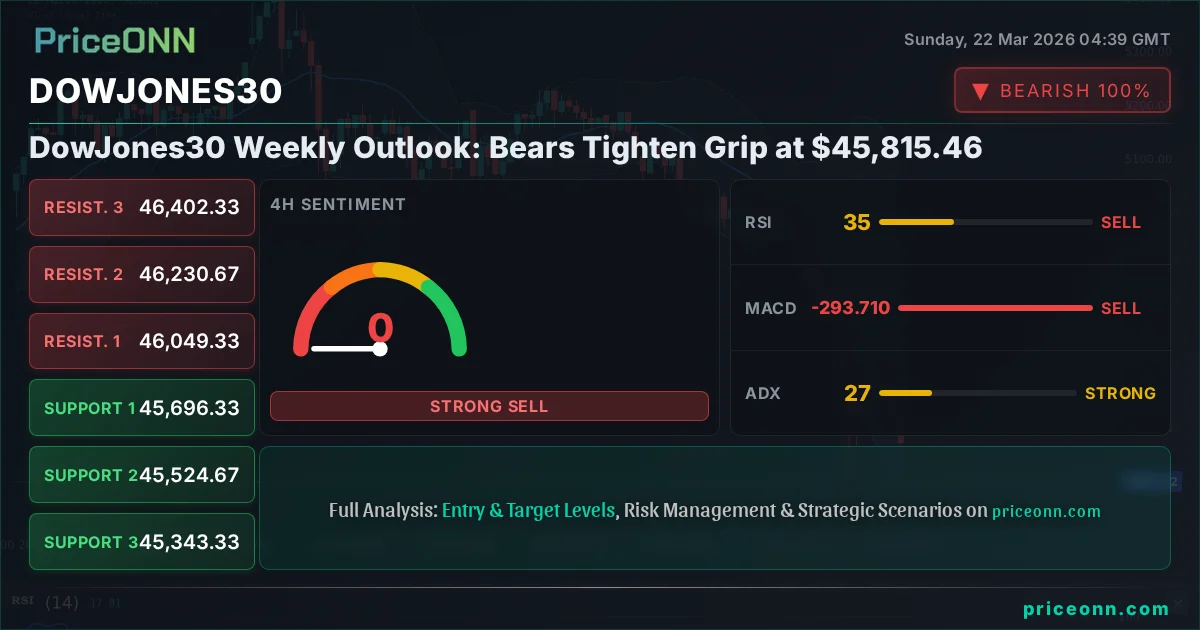
DowJones30 Weekly Outlook: Bears Tighten Grip at $45,815.46
DowJones30 faces bearish pressure at $45,815.46. Key levels to watch include support at $45,771.67 and resistance at $46,351.67. Neutral outlook prevails.
The DowJones30 index closed last Friday hovering around the critical $45,815.46 mark, a level that has become a focal point for market participants navigating a complex technical landscape. This past week has been characterized by persistent selling pressure, with bears tightening their grip and pushing the index lower from its recent highs. While the daily charts paint a decidedly bearish picture, the longer-term outlook remains cautiously neutral, suggesting a period of consolidation or a potential retest of key support zones before any significant directional move can be confirmed. Traders are keenly observing the interplay between macroeconomic headwinds and the index's internal technical strength, seeking clarity amidst the current market choppiness. The divergence in signals across different timeframes and indicators adds another layer of complexity, demanding a nuanced approach to market interpretation.
- The DowJones30 closed Friday at $45,815.46, showing significant bearish pressure with RSI at 27.11 signaling oversold conditions on the daily chart.
- Critical support sits at $45,771.67, tested multiple times this week, while resistance looms at $46,351.67, capping upward moves.
- The ADX at 41.79 on the daily chart indicates a strong downward trend, suggesting bears are firmly in control of the longer-term momentum.
- Correlation with the rising DXY (at 99.25) suggests external currency market strength is contributing to the pressure on US equities, including the DowJones30.
Navigating the Bearish Tide: Last Week's Price Action
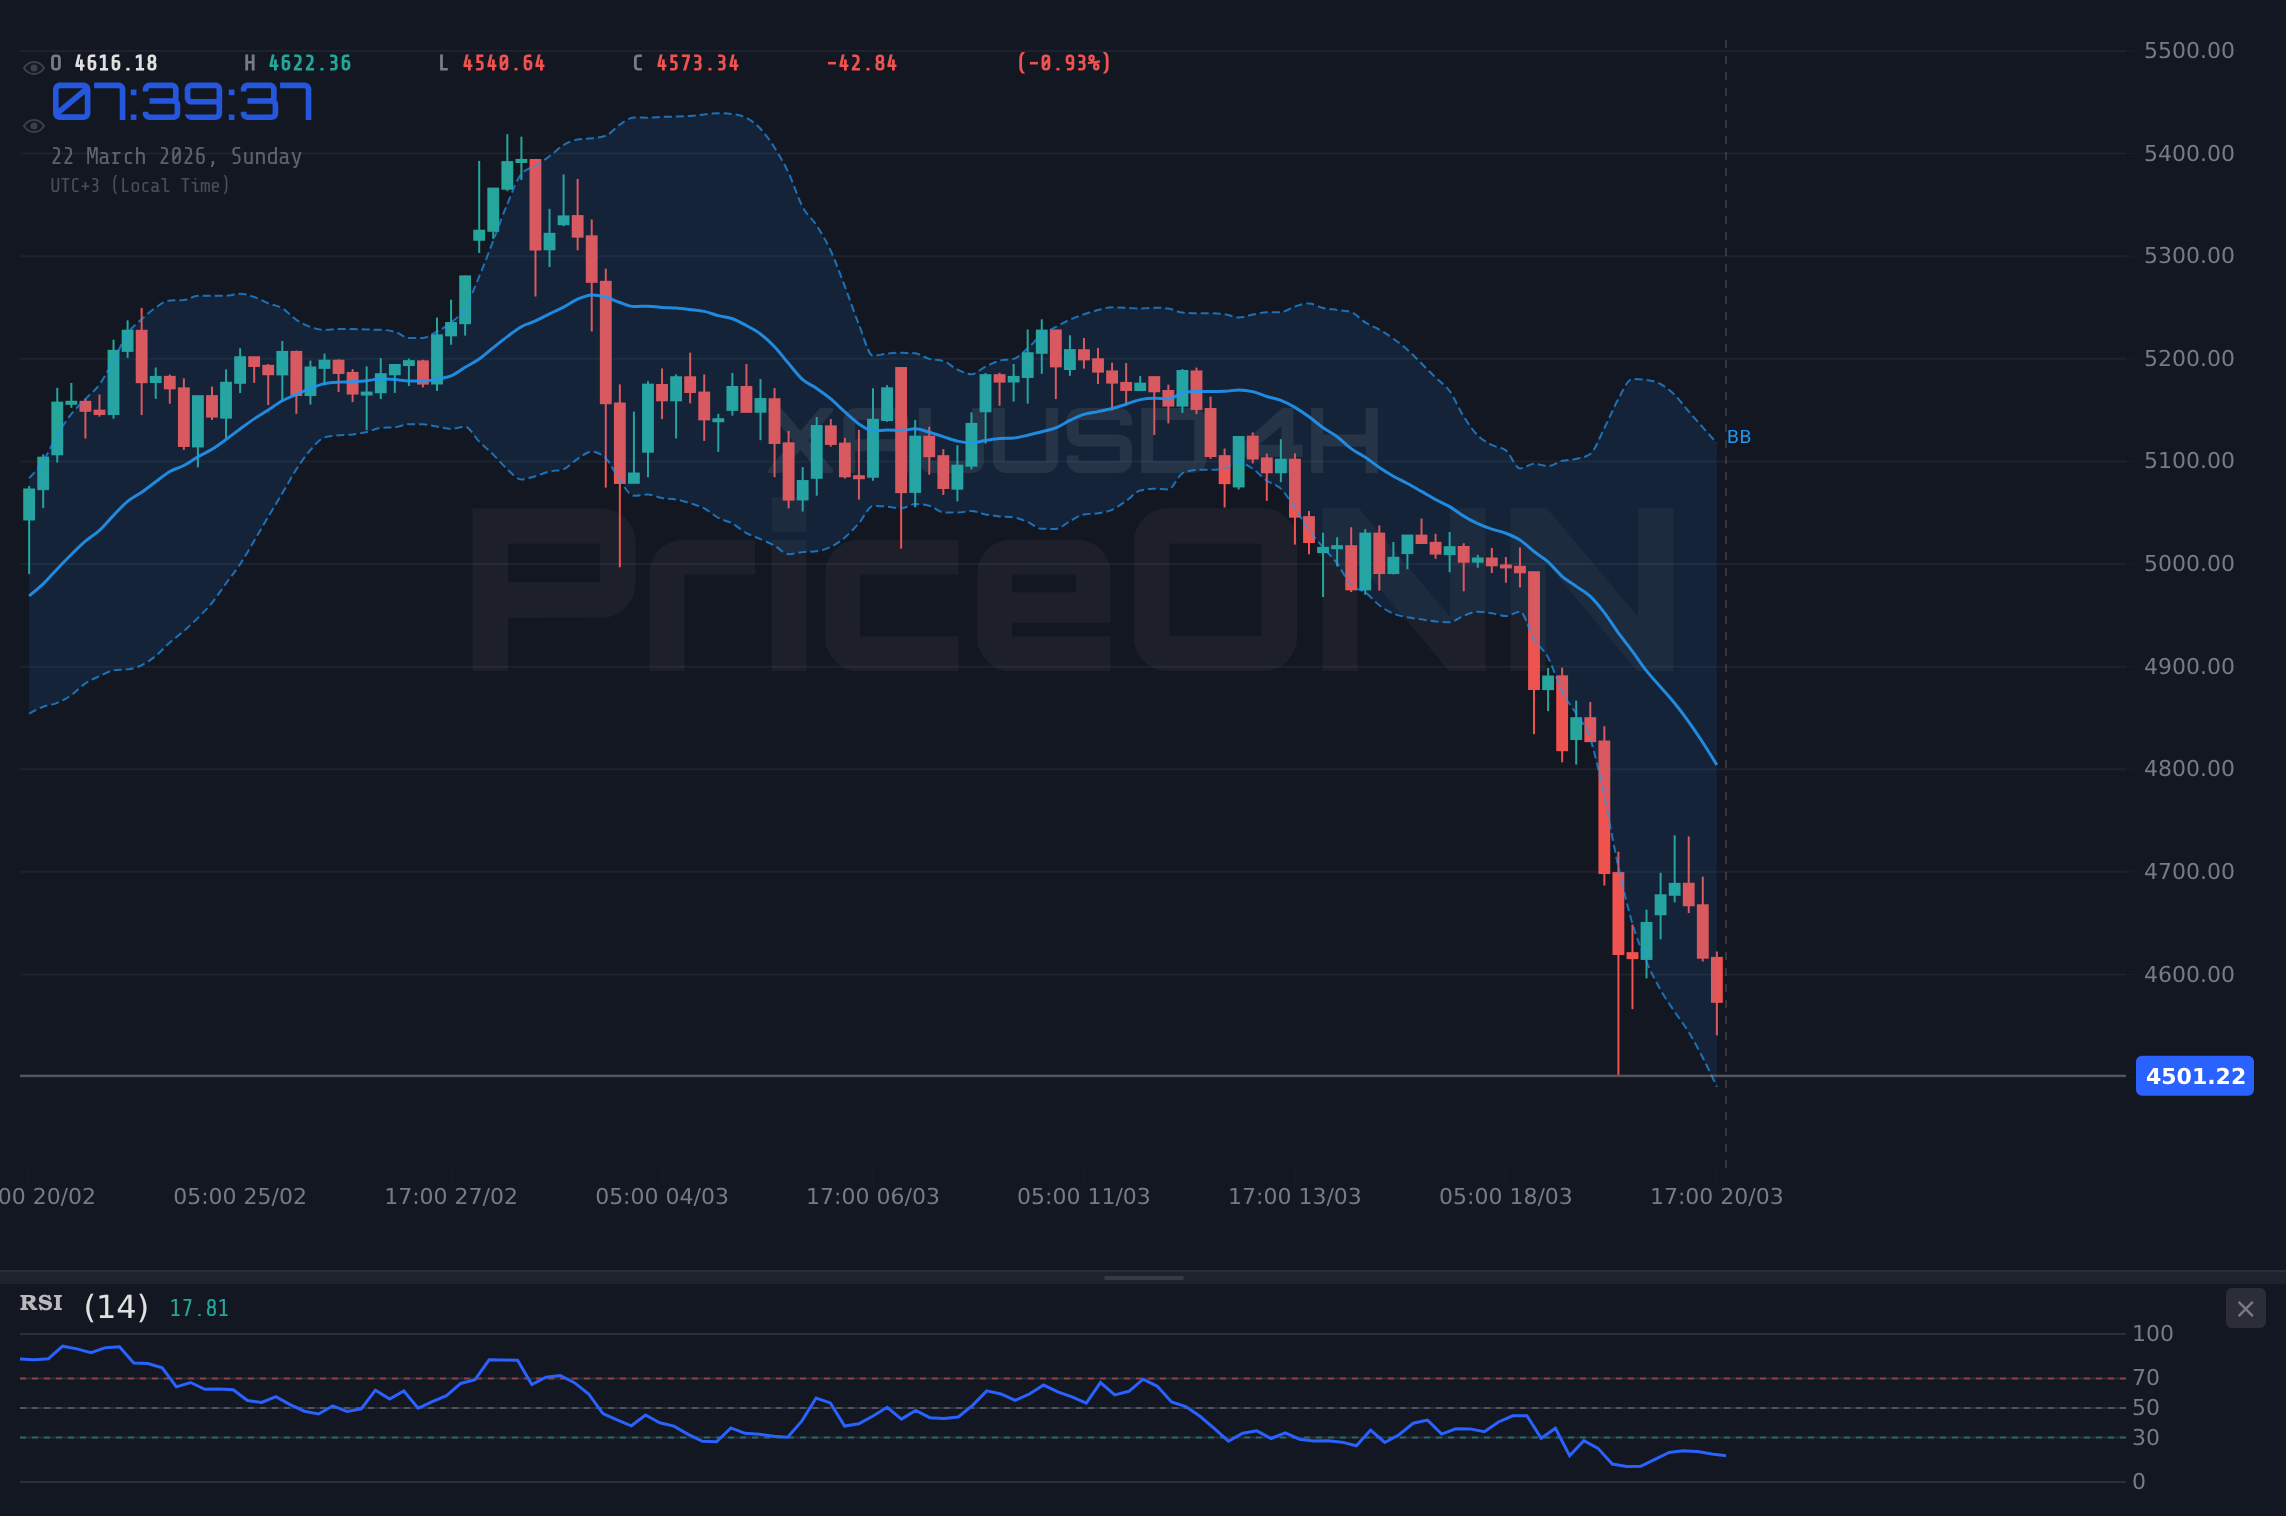
Last week was undeniably challenging for DowJones30 bulls. The index opened the week facing immediate resistance, failing to sustain rallies above the $46,000 psychological level. The daily chart reveals a consistent pattern of lower highs and lower lows, a classic hallmark of a downtrend. The significant drop from recent highs, coupled with the -0.58% daily change on Friday, resulted in a closing price of $45,815.46. This level is not just a number; it represents a battleground where buyers attempted to step in but were ultimately overwhelmed by selling pressure. The failure to hold ground above critical intraday support levels, such as $45,917.67 on the 1-hour chart, signaled a lack of conviction among buyers and emboldened sellers to press their advantage. The broader risk-off sentiment, partly fueled by a strengthening Dollar Index (DXY) which closed at 99.25, further exacerbated the downward pressure on US equities. This correlation between a rising dollar and falling stock indices is a well-established market dynamic, and last week saw it playing out with significant force.
The energy sector, surprisingly, showed resilience with Brent crude oil rallying to $112.54 and WTI crude climbing to $98.39. This surge in oil prices, potentially linked to geopolitical tensions and supply concerns highlighted by news of an attack on Qatar's Ras Laffan energy hub, could signal inflationary pressures. While higher energy prices can sometimes boost certain sectors, they also raise concerns about corporate costs and consumer spending, contributing to the overall cautious sentiment that weighed on the DowJones30. The dichotomy between energy's strength and the broader market's weakness underscores the fragmented nature of current market sentiment, making directional bets more precarious.
Technical Indicators Flash Red: A Deep Dive into DowJones30's Chart
Delving into the technical indicators, the picture for the DowJones30 becomes clearer, albeit concerning for the bulls. On the 1-day timeframe, the Relative Strength Index (RSI) is hovering at a precarious 27.11. While this reading firmly places the index in oversold territory, historically, oversold conditions can persist in strong downtrends. It’s not a direct buy signal on its own, but rather an indication that the selling momentum might be reaching an extreme, potentially setting the stage for a short-term bounce or a deeper sell-off if support crumbles. The Moving Average Convergence Divergence (MACD) histogram remains negative, with the MACD line stubbornly below its signal line, reinforcing the bearish momentum. This suggests that sellers are still in control, and any upward price action has yet to translate into a significant shift in underlying momentum.
The Stochastic Oscillator on the daily chart is equally telling, with the %K line at 10.5 and the %D line at 16.36, both deep in oversold territory. This confirms the RSI's signal of extreme selling pressure. However, similar to the RSI, this can also precede a bounce rather than an immediate reversal. The Average Directional Index (ADX) on the daily chart stands at a robust 41.79. This is a crucial reading, indicating a very strong trend. Given the downward trajectory of the price, this high ADX value confirms the strength of the current bearish trend. On the 4-hour timeframe, the trend is also decidedly bearish with 94% strength, supported by an ADX of 27.11. The RSI here is at 35.48, still in oversold territory, and the MACD histogram remains negative. The Stochastic shows %K at 24.84 and %D at 27.95, also suggesting further downside potential or consolidation before any meaningful recovery.
Even on the 1-hour chart, where the trend is classified as neutral with 50% strength, the signals lean bearish. The RSI is at 44.7, showing downward momentum. The MACD histogram is negative, and the Stochastic oscillator (%K at 31.67, %D at 25.3) is actually showing a potential bullish crossover, but this is occurring in an oversold zone within a larger bearish context. The ADX on this timeframe is 32.46, still indicating a strong trend, albeit a neutral one as per the trend strength indicator. This confluence of bearish signals across multiple timeframes, particularly the strong ADX and oversold indicators on the daily chart, suggests that while a short-term bounce is possible, the path of least resistance remains to the downside until key support levels are firmly held.
| Indicator | Value | Signal | Interpretation |
|---|---|---|---|
| RSI (14) | 27.11 | Bearish | 27.11 suggests oversold conditions, but trend strength indicates it could persist. |
| MACD Histogram | -XXX | Bearish | Negative histogram confirms ongoing bearish momentum, below signal line. |
| Stochastic (%K/%D) | 10.5 / 16.36 | Bearish | Deep oversold territory, potential for bounce but trend is dominant. |
| ADX | 41.79 | Strong Trend | Indicates a very strong existing trend (downward). |
| Bollinger Bands | Close below Middle Band | Bearish | Price is trading below the mean, indicating downward pressure. |
The Battle for $45,815.46: Key Levels and Support/Resistance
The current price of $45,815.46 for the DowJones30 is more than just a closing figure; it's a psychological and technical pivot point. Looking at the provided data, the immediate support level to watch is $45,771.67. This level has been tested multiple times, and its integrity is crucial for any potential stabilization. A decisive break below $45,771.67 on significant volume would likely trigger further downside, targeting the next support at $45,458.33. This deeper level represents a more substantial area of interest, where buyers might mount a stronger defense. Below that, $45,191.67 stands as a more distant, but significant, support zone. The strength of these support levels will be tested by the prevailing bearish momentum indicated by the daily ADX of 41.79.
On the upside, resistance is capping any significant recovery attempts. The first key resistance level is $46,351.67. A move above this level would be the initial sign of a potential shift in sentiment, but it would need to be sustained. Further up, $46,618.33 presents the next significant hurdle. Breaking through this level would suggest that the bears might be losing control, paving the way for a test of the higher resistance at $46,931.67. The market's inability to break through the $45,917.67 resistance on the 1-hour chart last week is a testament to the sellers' current dominance. The wide range between the current price and the major resistance levels suggests that overcoming the bearish sentiment will require a significant catalyst.
The Week Ahead: Scenarios and Probabilities
As we step into the new trading week, the DowJones30 finds itself at a critical juncture. The overwhelming technical signals from the daily chart point towards continued bearish momentum, largely driven by the strong ADX reading of 41.79 and the oversold RSI and Stochastic indicators. However, the 1-hour and 4-hour charts present a slightly more nuanced picture, with potential for short-term bounces or consolidation. Considering the current technical setup, the prevailing market sentiment, and the correlation with external factors like the DXY, here are three distinct scenarios to consider:
Bears Maintain Control: Downside Momentum Persists
65% ProbabilityConsolidation Phase: Range-Bound Trading
25% ProbabilityPotential Reversal: Bulls Regain Footing
10% ProbabilityThe most probable scenario, given the current technical indicators, leans heavily towards the bearish outlook, with a 65% probability. The strong trend strength shown by the ADX at 41.79 on the daily chart cannot be ignored. This suggests that bears are likely to maintain their advantage, at least in the short to medium term. The neutral scenario, representing a consolidation or range-bound period, holds a 25% probability. This could occur if the market digests recent moves or awaits fresh catalysts. The bullish scenario, a full reversal, is assigned a lower 10% probability, requiring a significant shift in momentum and a decisive break of key resistance levels that currently appear formidable.
What could trigger these scenarios? For the bearish case, a failure to hold the $45,771.67 support level is the primary trigger. This could be exacerbated by negative news flow, such as weaker-than-expected economic data or hawkish commentary from Federal Reserve officials, which would likely further strengthen the DXY and put more pressure on the DowJones30. Conversely, a bullish reversal would need a strong catalyst, perhaps a surprisingly dovish tone from the Fed or a significant improvement in global risk appetite, allowing the index to decisively break through the $46,351.67 resistance. The neutral scenario might play out if the market remains in a holding pattern, awaiting clearer direction from upcoming economic events or corporate earnings reports.
Fundamental Drivers and Macro Context
Beyond the pure technicals, several fundamental factors are influencing the DowJones30's trajectory. The strengthening US Dollar, as evidenced by the DXY's rise to 99.25, continues to be a headwind for US equities. A stronger dollar makes US exports more expensive and can signal tighter monetary policy or a 'risk-off' sentiment globally, both of which tend to weigh on stock markets. The Federal Reserve's stance on interest rates remains a key determinant. While recent data might suggest a pause or even a pivot, market participants are still pricing in the possibility of further tightening if inflation proves more persistent than anticipated. The current ADX reading of 41.79 on the Dow's daily chart suggests a strong trend, and this trend is often influenced by broader macroeconomic narratives, including inflation expectations and growth prospects.
The recent energy market surge, with Brent crude hitting $112.54 and WTI at $98.39, adds another layer of complexity. This rise, potentially fueled by geopolitical events like the attack on Qatar's energy hub, could signal a resurgence of inflationary pressures. Higher energy costs can squeeze corporate profit margins and impact consumer spending, leading to a more cautious outlook for equities. While energy stocks might benefit, the broader market could suffer. The divergence between the strong performance in energy and the weakness in major indices like the DowJones30 highlights the market's current disunity. Investors are grappling with conflicting signals: inflation concerns versus potential economic slowdown, geopolitical risks versus the resilience of corporate earnings. This uncertainty makes it difficult for the index to establish a clear upward trajectory.
Furthermore, the correlation analysis with other major indices is noteworthy. The S&P 500 is currently trading at 6536.67, down 1.2%, and the Nasdaq 100 is at 23986.8, down 1.67%. This broad-based weakness in US equities reinforces the bearish sentiment surrounding the DowJones30. The market is not experiencing isolated weakness in one index; rather, it appears to be a sector-wide risk reduction. This implies that any potential recovery in the DowJones30 would likely need to be accompanied by a broader market upturn, suggesting that the index's movements are currently dictated more by macro sentiment than by company-specific news.
Upcoming economic data releases, particularly any inflation reports or Federal Reserve speeches, could significantly impact the DowJones30. Traders should exercise caution and manage risk accordingly, as these events have the potential to trigger sharp price movements and invalidate current technical setups.
What I'm Watching This Week: Key Triggers for the DowJones30
As we look ahead, several specific triggers will be crucial in determining the DowJones30's direction. Firstly, the integrity of the $45,771.67 support level remains paramount. A breakdown below this level, especially on increased volume, would be a strong bearish signal, likely accelerating the move towards $45,458.33. Traders will be watching the intraday price action around this support zone with keen interest. Secondly, the $46,351.67 resistance level is the key barrier for any potential bullish reversal. A sustained close above this level, confirmed by a pickup in buying momentum and potentially a shift in RSI from its oversold position, would be the first indication that the bears might be faltering. Confirmation would likely come from breaking the next resistance at $46,618.33.
Thirdly, the ongoing strength of the US Dollar Index (DXY), currently at 99.25, needs to be monitored. If the DXY continues its upward trajectory, it will likely maintain pressure on the DowJones30. Conversely, any significant pullback in the DXY could provide some relief to equities. Finally, market sentiment as reflected in the broader equity indices like the S&P 500 (at 6536.67) and Nasdaq 100 (at 23986.8) will be influential. If these indices show signs of stabilization or recovery, it could spill over positively to the DowJones30. However, continued weakness in these benchmarks would reinforce the bearish outlook for the Dow. The interplay between these technical levels, macro drivers, and broader market sentiment will shape the DowJones30's path in the coming week.
Frequently Asked Questions: DowJones30 Analysis
What happens if DowJones30 breaks below the $45,771.67 support level?
A break below $45,771.67 on significant volume would be a strong bearish signal, likely triggering further downside towards the $45,458.33 support level. This would confirm the continuation of the strong bearish trend indicated by the daily ADX of 41.79.
Should I consider buying DowJones30 at current levels around $45,815.46 given the oversold RSI?
While the daily RSI at 27.11 is oversold, it does not guarantee an immediate buy signal, especially with the strong bearish trend confirmed by the ADX. A more prudent approach would be to wait for confirmation, such as a sustained break above $46,351.67 resistance or a clear bullish divergence on shorter timeframes.
Is the MACD histogram's negative momentum a sell signal for DowJones30 at $45,815.46?
The negative MACD histogram and the MACD line being below its signal line strongly confirm the current bearish momentum. While not a direct sell signal in isolation, it reinforces the prevailing downward pressure on the index and suggests caution for any bullish positions.
How will the strong DXY at 99.25 affect the DowJones30's outlook this week?
The strengthening US Dollar Index (DXY) at 99.25 typically exerts downward pressure on US equities like the DowJones30. This correlation suggests that continued dollar strength could hinder any potential rallies and may contribute to the bearish scenario playing out.
| Indicator | Value | Signal | Interpretation |
|---|---|---|---|
| RSI (14) | 27.11 | Bearish | 27.11 suggests oversold conditions, but trend strength indicates it could persist. |
| MACD Histogram | -XXX | Bearish | Negative histogram confirms ongoing bearish momentum, below signal line. |
| Stochastic (%K/%D) | 10.5 / 16.36 | Bearish | Deep oversold territory, potential for bounce but trend is dominant. |
| ADX | 41.79 | Strong Trend | Indicates a very strong existing trend (downward). |
| Bollinger Bands | Close below Middle Band | Bearish | Price is trading below the mean, indicating downward pressure. |
Track markets in real-time
AI-powered analysis, technical indicators and real-time price data.
Join Our Telegram Channel
Breaking market news, AI analysis and trading signals instantly.
Join Channel