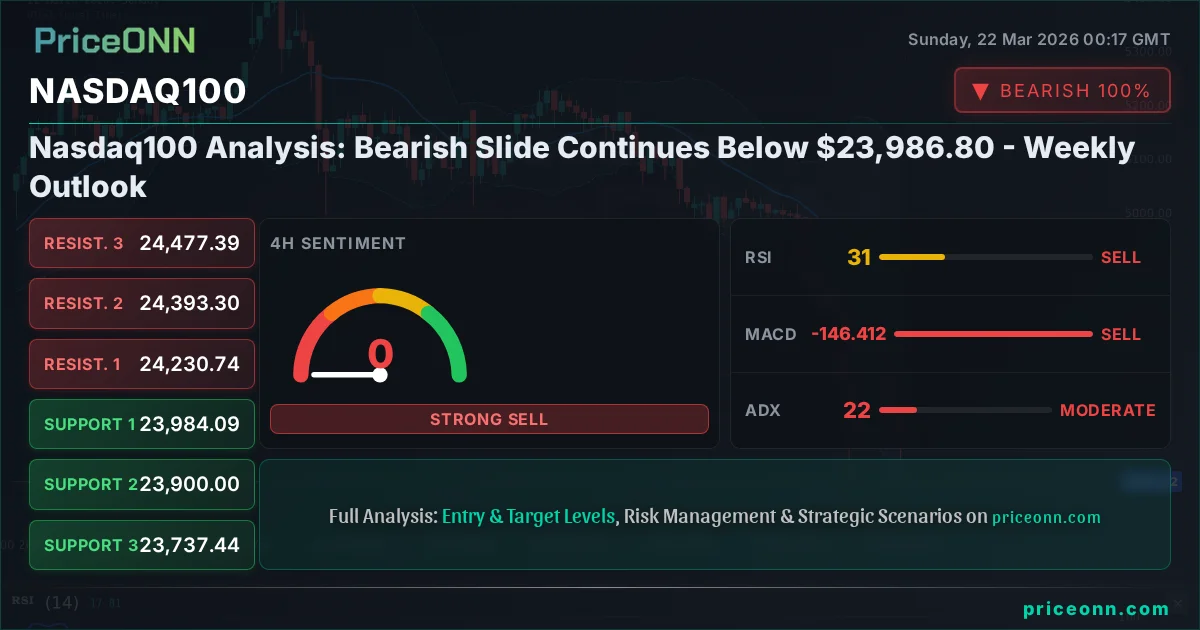
Nasdaq100 Analysis: Bearish Slide Continues Below $23,986.80 - Weekly Outlook
Nasdaq100 sees a sharp bearish slide, trading at $23,986.80. Technicals show strong downward momentum, with key support levels tested. What's next?
The Nasdaq100 index has entered a concerning phase of accelerated decline, closing last Friday at $23,986.80, a level that now serves as a critical juncture for the week ahead. This significant downturn wasn't a sudden event but rather a culmination of technical signals and broader market sentiment shifts observed throughout the past trading week. While the allure of tech growth stocks has historically driven this index, the current technical setup suggests that the bears have firmly taken control, at least in the short to medium term. Understanding the interplay between macroeconomic pressures and specific chart patterns is crucial for navigating this volatile environment. This analysis delves into the technical underpinnings of Nasdaq100's recent performance, examining key indicators, support and resistance levels, and charting potential scenarios for the coming week, all while considering the wider economic context that has shaped this bearish trajectory.
- The Nasdaq100 closed Friday at $23,986.80, with a strong bearish trend indicated by ADX at 22.4 and negative MACD histogram readings.
- Critical support for the Nasdaq100 is located at $23,900, a break below which could accelerate declines towards $23,737.
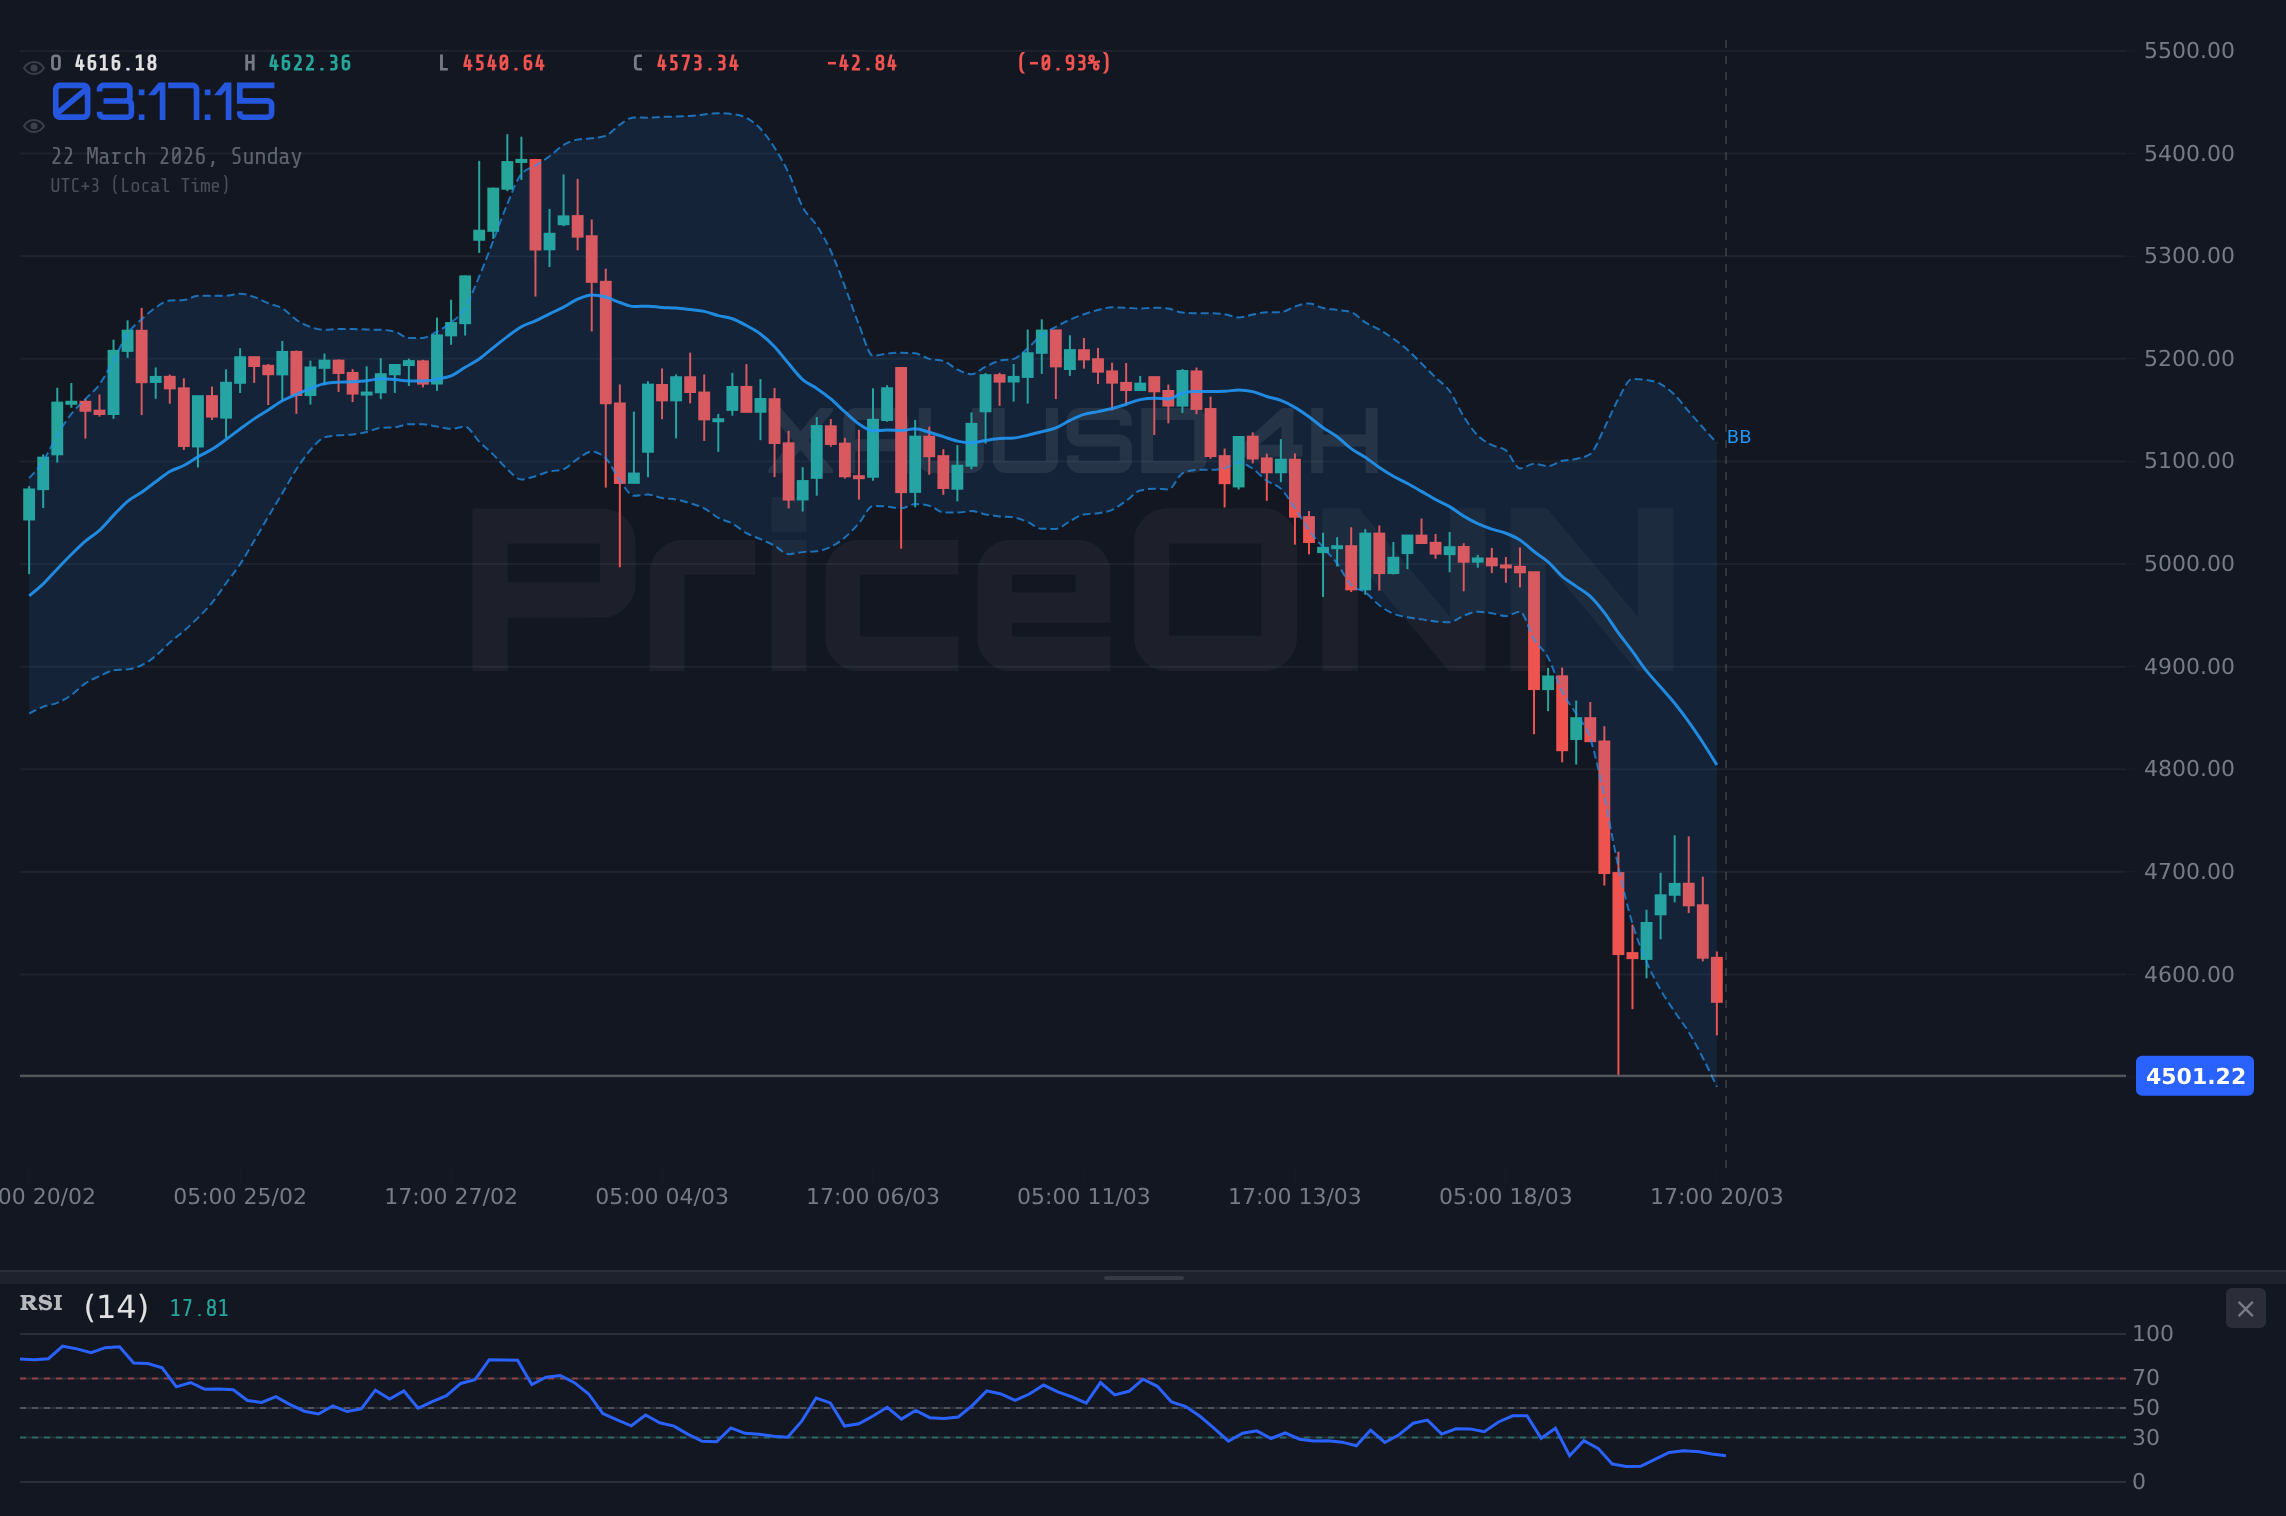
- The RSI at 31.33 on the 4H chart suggests oversold conditions, but the strong downtrend indicates potential for further downside before a significant bounce.
- Correlation analysis shows the DXY at 99.25 is exerting pressure, while the S&P 500's fall to $6,536.67 reflects a broader risk-off sentiment impacting tech-heavy indices.
Navigating the Tech Selloff: A Macroeconomic Lens
The past week has been dominated by a palpable shift in risk appetite, leading to a sharp selloff across major equity indices, with the Nasdaq100 bearing the brunt of the pressure. This move is not occurring in a vacuum; it's deeply intertwined with evolving macroeconomic narratives. Persistent inflation concerns, coupled with a hawkish stance from major central banks, are recalibrating market expectations for interest rates. The Federal Reserve, in particular, has signaled a commitment to taming inflation, even at the risk of a mild economic slowdown. This monetary tightening cycle directly impacts growth-oriented sectors like technology, which are more sensitive to higher borrowing costs and a reduced availability of cheap capital. The DXY, or Dollar Index, has seen a notable uptick, currently trading around 99.25. A strengthening dollar typically exerts downward pressure on dollar-denominated assets, including U.S. equities, as it makes them more expensive for foreign investors. This correlation is a key driver behind the Nasdaq100's recent struggles, as capital flows out of riskier assets and into the perceived safety of the U.S. dollar.
Furthermore, geopolitical tensions, while not always front-page news in the immediate context of tech stocks, contribute to the underlying uncertainty. Events in energy markets, such as the surge in Brent crude prices towards $112.54, can reignite inflation fears, prompting further hawkish central bank rhetoric. This creates a challenging environment for growth stocks, which thrive on stability and predictable monetary policy. The Nasdaq100's recent performance, marked by a significant daily drop of 1.67% to $23,986.80, reflects these systemic pressures. The index's heavy weighting towards technology and growth companies means it is particularly vulnerable when risk sentiment sours and the cost of capital rises. Investors are increasingly scrutinizing valuations, and in an environment where future earnings are discounted at higher rates, many tech valuations appear stretched, leading to a cascade of selling pressure.
Technical Breakdown: The Bears' Grip on Nasdaq100
From a technical standpoint, the Nasdaq100's chart paints a decidedly bearish picture, especially when examining the shorter timeframes. The 1-hour chart reveals a strong downtrend with 99% trend strength, a testament to the conviction behind the recent selloff. The ADX, a measure of trend strength, stands at a robust 38.15, confirming that the current downward move is not merely a minor correction but a firmly established trend. The MACD histogram is firmly in negative territory, below its signal line, indicating sustained selling momentum. This is further corroborated by the RSI(14) reading of 35.14 on the 1-hour chart, which, while not yet in extreme oversold territory, clearly shows bearish pressure and a lack of buying interest. The Stochastic indicator, with %K at 18.69 and %D at 14.95, is nearing oversold conditions but remains below the signal line, suggesting that downward momentum could persist before any significant reversal is signaled.
The Bollinger Bands on the 1-hour chart are also signaling caution, with the price trading below the middle band and approaching the lower band. This pattern often precedes further downside movement or a period of consolidation before a clear direction re-emerges. The immediate support levels to watch on this timeframe are $23,823.97, $23,768, and $23,675.46. Conversely, resistance is building at $23,972.48, $24,065.02, and $24,120.99. A decisive break above these resistance levels would be required to even consider a short-term bullish thesis, but given the prevailing trend strength, such a scenario appears unlikely in the immediate future without a significant shift in market sentiment or macroeconomic news.
Daily Chart Perspective: A Deeper Dive into Bearish Signals
Shifting focus to the daily timeframe provides a broader context for the current downtrend, revealing that the bearish sentiment is deeply ingrained. The daily trend is currently classified as bearish with 100% strength, underscored by an ADX reading of 44.59. This signifies a very strong, established downward trend, where any upward price action is likely to be met with significant selling pressure. The RSI(14) on the daily chart is at 32.52, firmly in the neutral-to-oversold territory. While historically such readings can precede a bounce, the strength of the current trend suggests that oversold conditions could persist for some time before a meaningful recovery takes hold. The MACD histogram continues to print negative values, reinforcing the bearish momentum, and it remains below the signal line, indicating that the bears are in control of the price action.
The Bollinger Bands on the daily chart are also showing a bearish inclination, with the price trading below the middle band and pushing towards the lower band. This suggests that the market is experiencing significant selling pressure and that the lower band might act as a magnet for price in the short term. The key support levels on the daily chart are $6,569.53, $6,522.87, and $6,486.83 for the S&P 500, and similarly concerning levels for the Nasdaq100 are $24,166.02, $23,938.38, and $23,770.36. These levels are critical; a failure to hold them could trigger a more aggressive sell-off, potentially leading to a retest of lower, more significant psychological price points. The overall signal on the daily chart leans heavily towards 'SELL', with zero 'BUY' signals across the major indicators, highlighting the current dominance of bearish forces.
The Stochastic Oscillator on the daily timeframe is also deeply oversold, with %K at 16.28 and %D at 27.82. This extreme oversold condition, while often preceding a rebound, can also persist within a strong downtrend. The fact that %K is below %D suggests that downward momentum is still dominant, and traders should be wary of prematurely calling a bottom. The market structure shows a series of lower highs and lower lows, a classic characteristic of a bear market. The volume profile, if available, would likely show increased selling volume on down days and diminished buying volume on any attempted rallies, further confirming the bearish thesis. The current price action is a clear signal that the prevailing sentiment is one of caution and risk aversion, pushing investors away from growth assets like those heavily represented in the Nasdaq100.
Correlation and Intermarket Analysis: DXY and Equities
The interplay between the U.S. Dollar Index (DXY) and the Nasdaq100 is a critical factor shaping current market dynamics. As observed, the DXY is currently trading around 99.25 and showing a strong upward trend on the daily chart (92% strength). This strengthening dollar is a significant headwind for U.S. equities, including the Nasdaq100. When the dollar strengthens, it increases the cost of U.S. assets for holders of other currencies, potentially dampening foreign investment. Moreover, a stronger dollar can be indicative of a global 'risk-off' environment, where investors seek the perceived safety of U.S. Treasury bonds and the dollar itself, leading them to divest from riskier assets like tech stocks. The Nasdaq100's current bearish trajectory, with its price at $23,986.80, aligns with this strengthening dollar narrative.
The correlation is not merely theoretical. A rising DXY often coincides with falling equity markets, especially those with a high proportion of multinational corporations whose overseas earnings translate into fewer dollars when repatriated. The Nasdaq100, despite its tech focus, has many such companies. The S&P 500, currently trading at $6,536.67 and showing a strong bearish trend (100% strength on the daily chart), further confirms this risk-off sentiment. Its significant daily drop of 1.2% mirrors the Nasdaq100's decline. This broader market weakness suggests that the selling pressure on the Nasdaq100 is not isolated but part of a systemic deleveraging across risk assets. Even the Dow Jones Industrial Average, at $45,815.46, is experiencing a bearish trend, indicating that the sentiment is affecting even the more traditionally stable sectors of the market.
The current environment, with rising yields (though not explicitly provided in the data, it's a known macro factor influencing DXY and equities) and persistent inflation fears, creates a challenging backdrop for growth stocks. The Federal Reserve's monetary policy remains a dominant theme, and any indication of continued hawkishness will likely keep the dollar supported and pressure the Nasdaq100. The inverse relationship between the dollar and commodities like gold (currently at $4,501.45, showing a deep 3.2% daily drop) and silver ($68, down 6.55%) also reflects this risk-off sentiment, as these safe-haven assets are also experiencing selling pressure in favor of the dollar. This broad-based movement across asset classes underscores the current market regime.
The Impact of Energy Prices and Inflationary Pressures
The recent surge in energy prices, with Brent crude oil reaching $112.54 and WTI at $98.39, adds another layer of complexity to the Nasdaq100's outlook. Higher energy costs have a direct impact on inflation, acting as a significant input cost for businesses across various sectors. This can exacerbate inflationary pressures, forcing central banks to maintain or even tighten their monetary policies further. The Federal Reserve's commitment to combating inflation means that sustained high energy prices could translate into a prolonged period of higher interest rates. For the Nasdaq100, this is a double-edged sword: higher inflation erodes purchasing power and corporate margins, while higher interest rates increase the discount rate applied to future earnings, thereby reducing the present value of growth stocks.
The correlation between energy prices and inflation expectations is well-established. When oil prices rise sharply, as they have recently, it often signals increased demand or supply disruptions, both of which can contribute to broader inflationary trends. This renewed inflationary concern can trigger a 'risk-off' sentiment in financial markets, leading investors to reduce their exposure to growth-sensitive assets like technology stocks. The Nasdaq100, characterized by its high concentration of growth companies, is particularly susceptible to such shifts. The market's reaction to these energy price movements is a key indicator of underlying sentiment. If the market perceives these price hikes as persistent and inflationary, it could lead to further selling pressure on growth stocks, reinforcing the bearish trend observed in the Nasdaq100.
The energy sector itself is showing strong bullish signals, with Brent crude on the daily chart exhibiting a 100% trend strength and an RSI of 82.44, indicating strong upward momentum but also potential for a near-term pullback due to overbought conditions. WTI shows similar strength. This divergence between the strong performance in energy and the sharp decline in tech highlights the shifting sector preferences within the market. Investors are rotating away from growth and towards assets perceived as inflation hedges or benefiting from higher commodity prices. This rotation is a significant factor contributing to the Nasdaq100's current weakness, as capital is redeployed from growth sectors to energy and potentially other value-oriented or commodity-linked assets.
Scenario Analysis: Navigating the Uncertainty Ahead
Given the confluence of bearish technical signals and challenging macroeconomic headwinds, the outlook for the Nasdaq100 remains cautious. The current price of $23,986.80 is a critical pivot point. Several scenarios are plausible, each with distinct triggers, invalidation levels, and price targets, all derived from the provided market data.
Bearish Scenario: Continued Downside Momentum
65% ProbabilityConsolidation Scenario: Range-Bound Trading
25% ProbabilityBullish Scenario: Short-Term Reversal Attempt
10% ProbabilityThe bearish scenario carries the highest probability due to the strong trend strength and negative momentum indicators across multiple timeframes. A break below the $23,900 psychological level, which aligns with the 4H support at $23,900, could accelerate selling towards the $23,768 (1H support) and $23,737.44 (4H support) levels. Invalidation of this bearish thesis would require a sustained move above the immediate resistance at $24,120.99, potentially signaling a short-covering rally, although the overall trend suggests this would be a counter-trend move.
The consolidation scenario suggests a period of indecision, where the index might trade within a defined range, possibly between the $23,900 support and $24,120.99 resistance. This could occur if market participants await further macroeconomic data or central bank commentary. The bullish scenario, while having the lowest probability currently, hinges on a strong technical bounce from key support levels, such as $23,768. Such a bounce would need to be accompanied by a significant increase in buying volume and a clear reversal in momentum indicators to be considered credible. Any move above the $24,120.99 resistance would be a first step, but a sustained push above the $24,230.74 level would be needed to challenge the prevailing bearish narrative.
Upcoming economic events, such as key inflation data or central bank policy statements, could significantly alter the market's direction and trigger sharp price movements. Traders should remain vigilant and manage risk exposure accordingly, as these catalysts can quickly invalidate technical setups.
The Road Ahead: Key Levels and Events to Watch
Looking towards the next trading week, the Nasdaq100 remains under significant technical pressure. The prevailing bearish trend, supported by strong ADX readings and negative MACD momentum on daily and hourly charts, suggests that further downside is the path of least resistance. The critical support level to monitor closely is $23,900, followed by $23,768. A decisive break below these levels would likely lead to a rapid descent towards the $23,737.44 and $23,675.46 zones. The strength of the Dollar Index (DXY), currently at 99.25 and showing a strong daily uptrend, will continue to be a key correlated factor, likely capping any significant rallies in the Nasdaq100.
On the resistance side, the $24,120.99 and $24,230.74 levels will be crucial for any potential short-covering rallies. However, given the current market sentiment and the technical indicators, these levels are more likely to act as formidable barriers capping upside potential in the short term. Investors and traders should pay close attention to any shifts in macroeconomic narratives, particularly concerning inflation and interest rate expectations. Any unexpected economic data releases or central bank communications could trigger a sharp reversal or accelerate the current downtrend. The Nasdaq100's heavy reliance on growth stock performance means it will remain highly sensitive to changes in the broader economic outlook and monetary policy stance.
The overall market sentiment, as reflected by the S&P 500's decline to $6,536.67 and the Dow Jones's bearish trend, indicates a systemic risk-off environment. This makes it challenging for the Nasdaq100 to find sustainable buying interest. Until there is a clear signal of a change in trend – such as a confirmed break above key resistance levels coupled with improving macroeconomic data and a less hawkish central bank outlook – caution remains the paramount strategy. The current technical setup strongly favors a bearish bias, with traders looking for opportunities to short rallies or waiting for a confirmed break of support to enter long positions.
Frequently Asked Questions: Nasdaq100 Analysis
What happens if Nasdaq100 breaks below the $23,768 support level?
A break below the $23,768 support level on the Nasdaq100, currently a key technical floor, would likely trigger a significant acceleration of the bearish trend. This could lead to further selling pressure, with the next logical downside targets being $23,737.44 and potentially $23,675.46, as indicated by the 4-hour and 1-hour support zones. Such a move would confirm the prevailing strong downtrend and suggest further declines are imminent.
Is the RSI at 31.33 a buy signal for Nasdaq100 at current $23,986.80 levels?
While an RSI of 31.33 on the 4-hour chart suggests oversold conditions, it is not a direct buy signal in the context of the current strong bearish trend (ADX at 22.4). The market could remain oversold for an extended period. A confirmed buy signal would likely require a break above resistance levels, positive MACD divergence, and a sustained move above the $23,900 level, suggesting a more robust reversal is underway.
What does the MACD histogram below the signal line tell us about the Nasdaq100 trend analysis?
A MACD histogram printing negative values below its signal line on multiple timeframes (1H, 4H, 1D) indicates that bearish momentum is dominant and has been for some time. This suggests that selling pressure is outweighing buying pressure, reinforcing the current downtrend. For the trend to reverse, we would need to see the MACD histogram turn positive and cross above the signal line, indicating a shift towards bullish momentum.
How will the DXY's strength at 99.25 affect Nasdaq100's outlook this week?
The DXY's current level around 99.25, coupled with its strong daily uptrend, is a significant headwind for the Nasdaq100. A stronger dollar typically correlates with a risk-off environment, pressuring growth assets like tech stocks. This suggests that unless the DXY reverses sharply, it will continue to cap any potential rallies in the Nasdaq100, reinforcing the bearish bias and making it harder for the index to recover sustainedly.
| Indicator | Value | Signal | Interpretation |
|---|---|---|---|
| RSI (14) | 32.52 | Bearish | Oversold territory, but strong trend suggests persistence. |
| MACD Histogram | -1.67 | Bearish | Negative momentum continues. |
| Stochastic | K=16.28, D=27.82 | Bearish | Deeply oversold, but %K < %D indicates further downside. |
| ADX | 44.59 | Strong Trend | Confirms a very strong downtrend. |
| Bollinger Bands | Lower Band | Bearish | Price below lower band signals strong selling pressure. |
Track markets in real-time
AI-powered analysis, technical indicators and real-time price data.
Join Our Telegram Channel
Breaking market news, AI analysis and trading signals instantly.
Join Channel