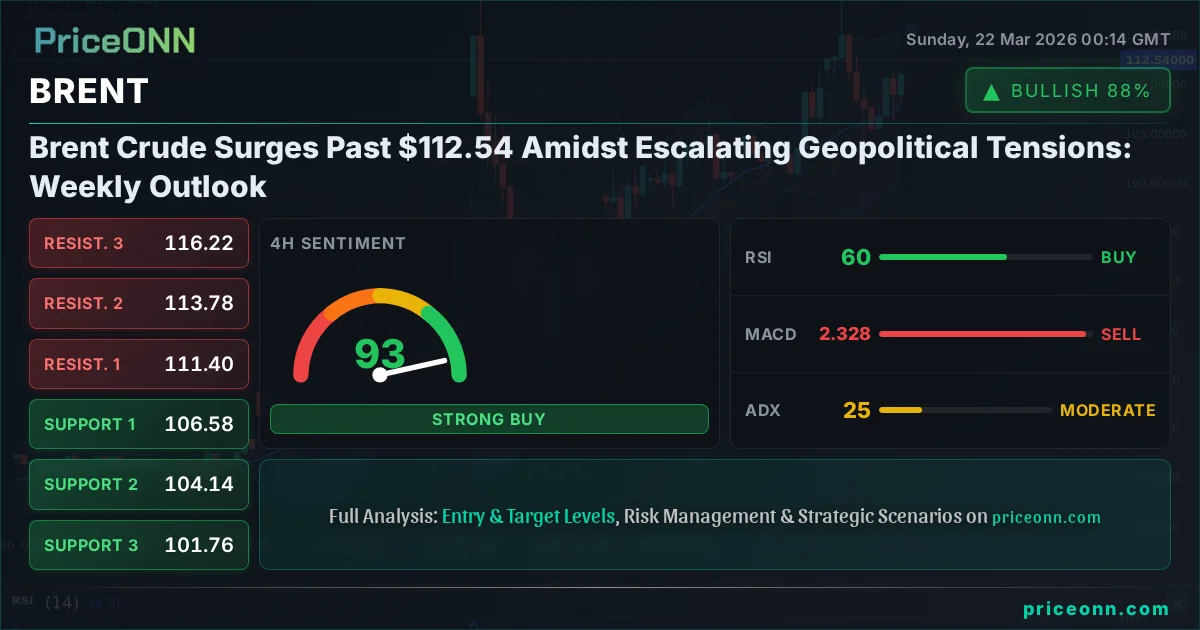
Brent Crude Surges Past $112.54 Amidst Escalating Geopolitical Tensions: Weekly Outlook
Brent crude oil is trading at $112.54 after a significant weekly rally driven by Middle East tensions. Analysis points to continued volatility.
The global energy landscape has been dramatically reshaped this past week, with Brent crude oil surging past the critical $112.54 mark. This significant price action, occurring as markets closed on Friday, is not merely a reaction to fluctuating supply dynamics but a stark reflection of escalating geopolitical risks, particularly in the Middle East. The question on every trader's mind is whether this bullish momentum is sustainable or if the current price levels represent a temporary peak before a potential correction. This analysis delves into the key drivers behind Brent's recent ascent, examines the technical indicators suggesting further price action, and outlines potential scenarios for the week ahead.
- Brent crude is currently trading at $112.54, reflecting a strong weekly upward trend.
- Geopolitical tensions in the Middle East are the primary catalyst, driving supply disruption fears.
- Technical indicators on the daily chart show a strong bullish trend (ADX 65.23), with RSI at 82.44 signaling overbought conditions.
- Key support levels are identified at $101.24, $94.87, and $85.85, while resistance is eyed at $116.63, $125.65, and $132.02.
- The Brent-WTI spread is widening, indicating specific supply concerns impacting Brent more directly.
Geopolitical Storm Clouds Gather Over Oil Markets
The past week has been dominated by a palpable increase in geopolitical uncertainty, with the Middle East once again taking center stage. Reports of heightened tensions and potential escalations have sent shockwaves through the oil markets, directly impacting Brent crude prices. While specific details remain fluid, the mere threat of supply disruptions from a region responsible for a significant portion of global oil output is enough to trigger a risk premium. This premium is not just a theoretical concept; it translates directly into higher prices as traders and consumers alike price in the potential for reduced supply. The market's reaction has been swift and decisive, pushing Brent above $112.54, a level that now serves as a psychological benchmark. This isn't the first time geopolitical events have driven oil prices, but the current backdrop of already tight supply due to OPEC+ production cuts amplifies the market's sensitivity.
The narrative around supply has been tightening for months. OPEC+ has maintained its production discipline, and voluntary cuts announced by key players like Saudi Arabia have further constrained output. This underlying tightness means that any new geopolitical flare-up acts as a significant catalyst. Unlike periods of ample supply, where markets can absorb regional disruptions more easily, the current environment leaves little room for error. The fear of a supply shock, even if it doesn't fully materialize, is enough to bid prices higher. This sentiment is further amplified by the fact that global oil inventories, particularly in key consuming nations, are not at levels that would offer significant buffer against unexpected supply interruptions. The market is, therefore, on edge, and any news hinting at instability in producing regions immediately translates into higher prices for benchmarks like Brent.
The impact of these geopolitical developments is multifaceted. Beyond the immediate fear of supply disruption, there's also the consideration of potential logistical challenges. Shipping routes, particularly those through strategic chokepoints like the Strait of Hormuz, become focal points of concern. Any perceived threat to these routes can lead to increased shipping costs and insurance premiums, further contributing to the upward pressure on oil prices. Furthermore, the specter of broader regional conflict can deter investment in new oil exploration and production, impacting future supply capabilities. This creates a feedback loop where current geopolitical risks not only affect immediate prices but also cast a shadow over long-term supply adequacy, underpinning the current bullish sentiment for Brent crude.
Technical Indicators Paint a Bullish Picture, Albeit Overbought
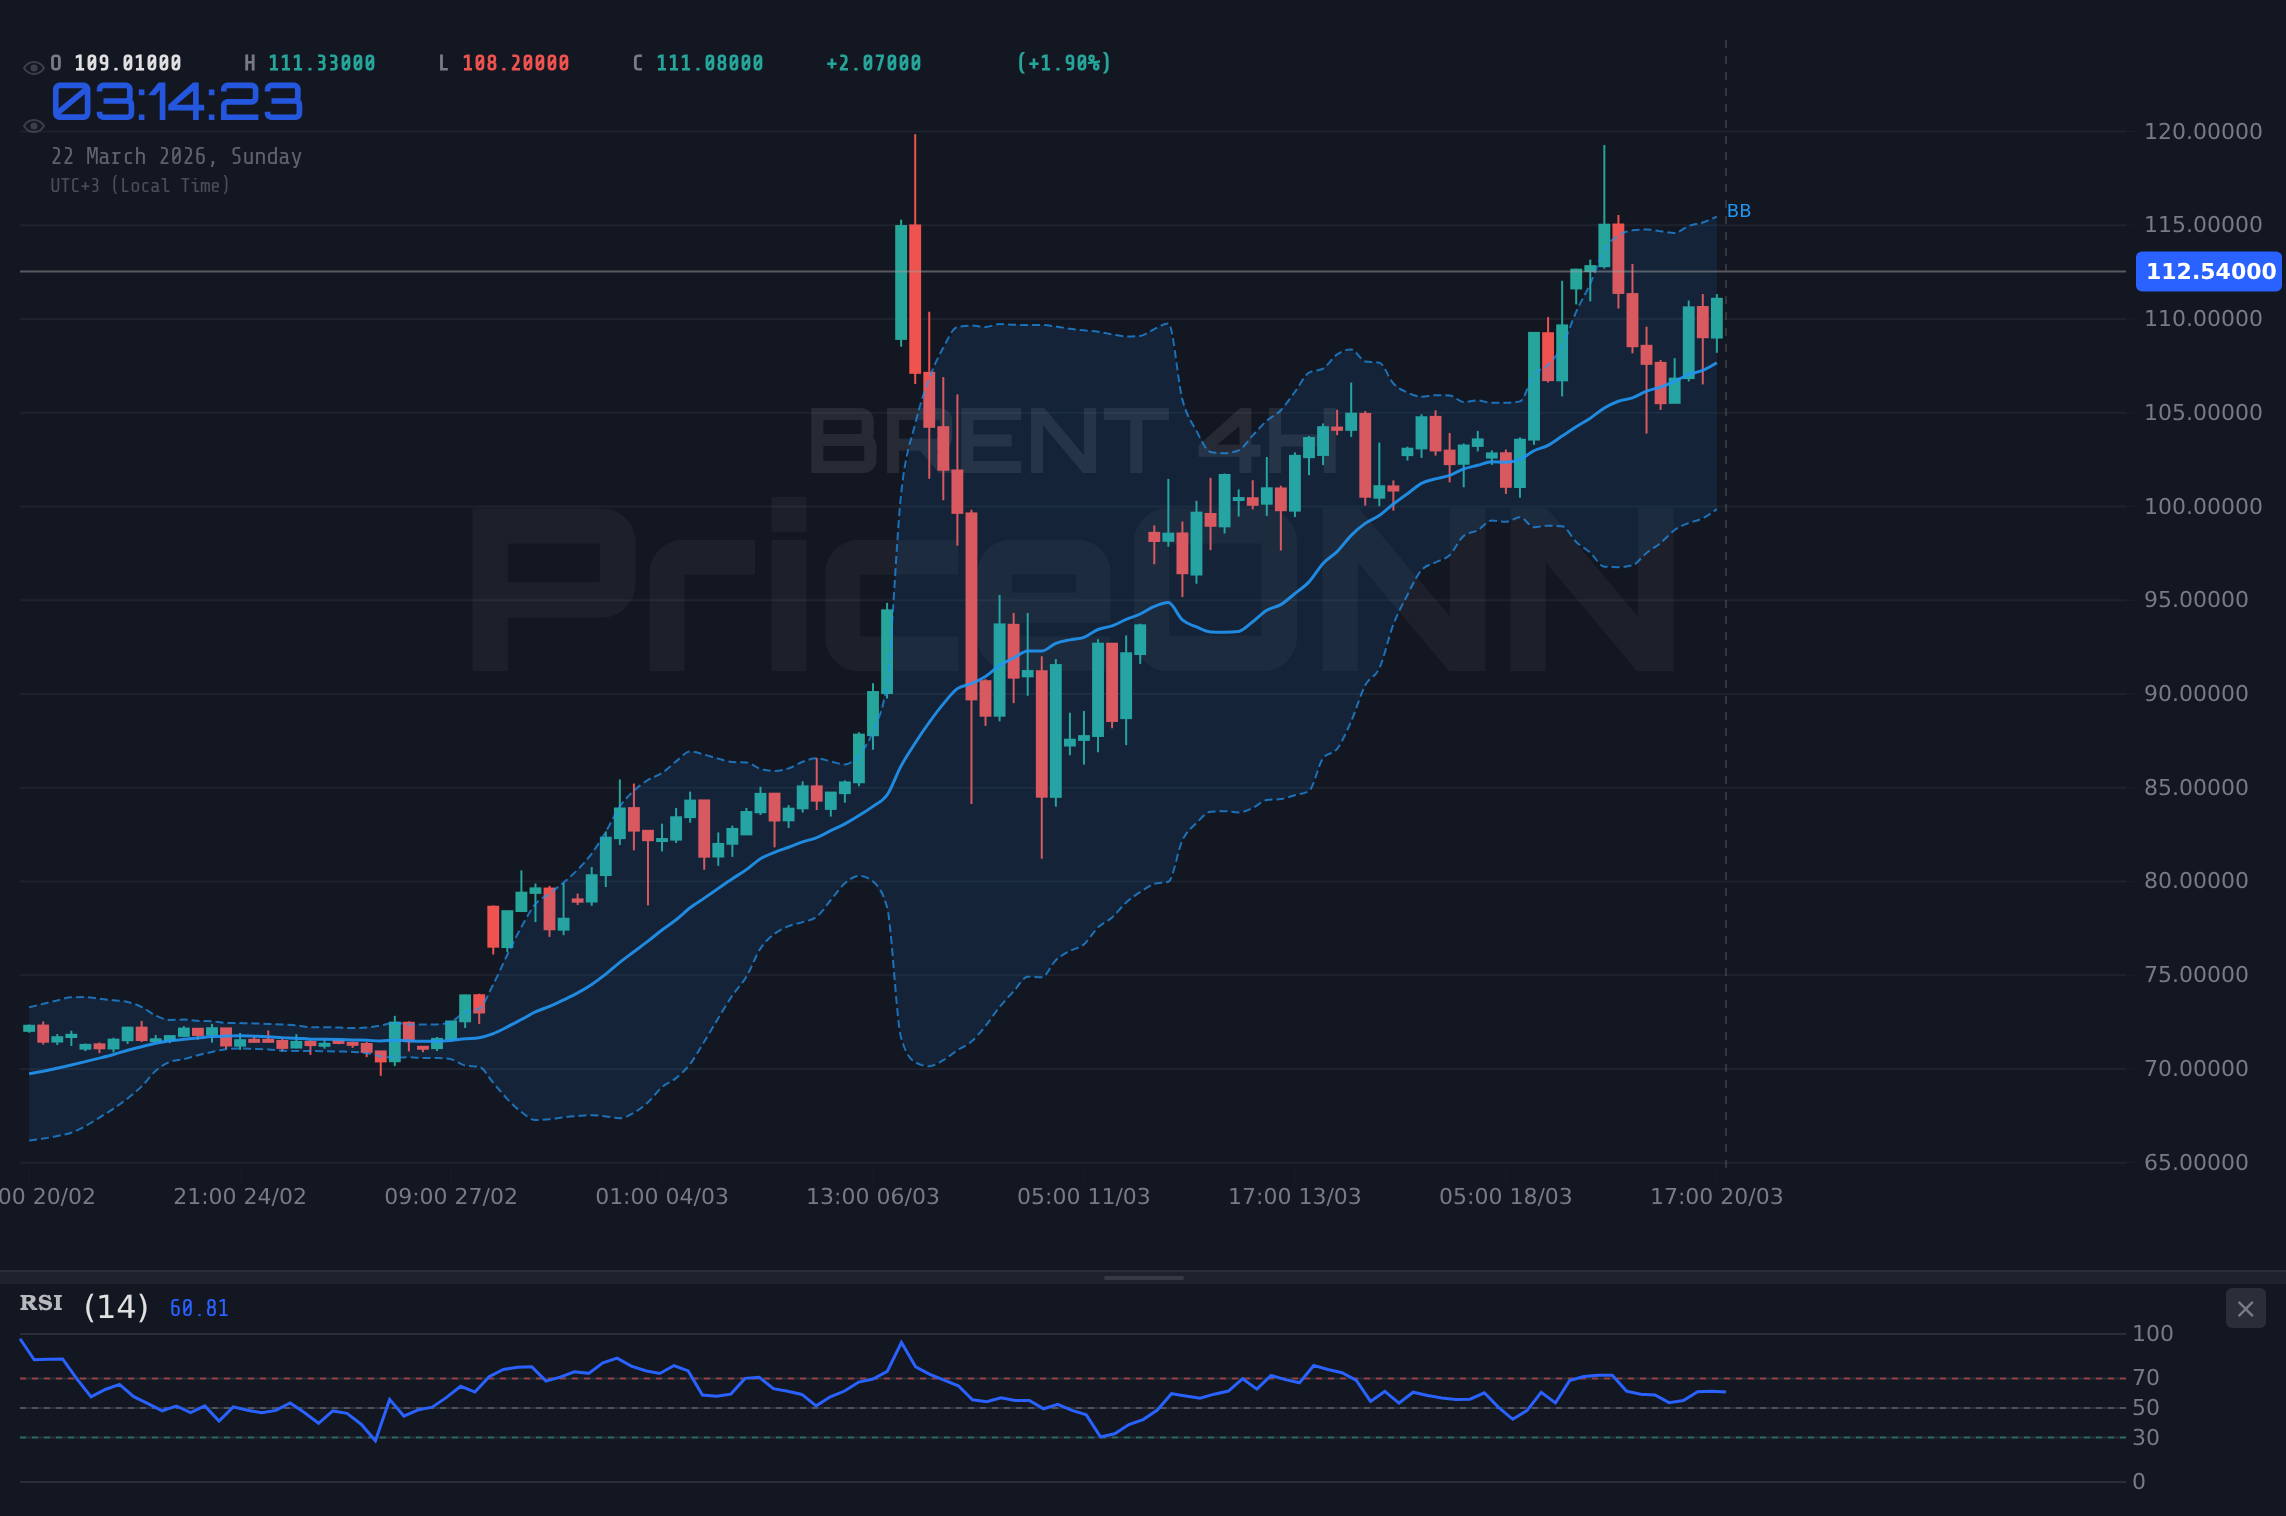
From a technical standpoint, Brent crude's chart action over the past week presents a compelling, albeit extended, bullish picture. The daily timeframe shows a powerful upward trend, underscored by an ADX reading of 65.23 – a level indicating a very strong trend. This suggests that the momentum behind the current rally is significant and has been building considerably. The price has not only broken through previous resistance levels but has done so with conviction, trading well above the $112.54 mark. The 1-day chart shows the price trading decisively above the middle Bollinger Band, and the upward trajectory of the band itself confirms the strength of the trend. The MACD indicator on the daily chart also remains in positive territory, with the MACD line above the signal line, further reinforcing the bullish momentum.
However, the picture is not without its cautionary notes. The Relative Strength Index (RSI) on the daily chart stands at a lofty 82.44. This reading is deep within overbought territory, typically signaling that an asset may be due for a pullback or consolidation. While strong trends can sometimes sustain high RSI levels for extended periods, it increases the probability of a near-term correction. Similarly, the Stochastic Oscillator, with %K at 74.74 and %D at 61.85, also indicates an overbought condition, suggesting that the upward momentum might be losing steam and that profit-taking could emerge. This divergence between the strong trend indicators (ADX, MACD) and the overbought oscillators (RSI, Stochastic) creates a nuanced technical landscape, suggesting that while the trend is up, the immediate path may involve some choppiness.
Zooming out to the 4-hour timeframe, the bullish trend remains dominant, with an ADX of 24.95 indicating a moderately strong trend. The RSI here is at 60.33, still in bullish territory but less extreme than the daily reading. The Stochastic oscillator on this timeframe is at %K 44.45 and %D 31.55, showing a bullish signal with %K above %D. This suggests that on the intermediate timeframe, the upward pressure is still present, though perhaps not as overextended as the daily view implies. The 1-hour chart shows a neutral trend (ADX 17.96), with RSI at 61.07 and Stochastic indicating a bullish signal (%K 93.51, %D 72.44), though this latter reading is approaching extreme overbought levels and might suggest limited immediate upside from current prices.
The confluence of these indicators suggests that while the overall trend is strongly bullish, a period of consolidation or a minor pullback around current levels near $112.54 is plausible. Traders will be watching closely to see if the overbought conditions on the daily chart lead to a significant reversal or if the underlying trend strength can push prices higher, potentially targeting the next resistance levels. The key will be how the market reacts to the $112.54 price point and whether the geopolitical news flow continues to override the technical overbought signals.
Key Levels and Trade Scenarios
Understanding the key support and resistance levels is paramount for navigating the current volatility in Brent crude. On the daily chart, the primary support is found at $101.24. A break below this level would signal a significant shift in sentiment and could open the door for further declines towards $94.87 and subsequently $85.85. These levels represent significant historical price floors and would likely attract substantial buying interest if tested under the right conditions. The strength of the current uptrend, however, makes a decisive break below $101.24 less probable in the short term, unless there is a dramatic de-escalation of geopolitical tensions or a significant shift in OPEC+ policy.
On the upside, the immediate resistance is observed at $116.63. A decisive move above this level, supported by continued positive news flow or sustained geopolitical risk, could pave the way for Brent to test higher targets. The next significant resistance sits at $125.65, followed by $132.02. These levels are substantially higher and would likely require a sustained period of strong demand and potentially further supply constraints to reach. The current price action near $112.54 suggests that the market is consolidating or pausing before potentially challenging the $116.63 resistance. Traders will be closely watching the price action around these levels to gauge the next directional move.
Bullish Scenario: Sustained Geopolitical Risk
40% ProbabilityNeutral Scenario: Consolidation Around $112.54
35% ProbabilityBearish Scenario: De-escalation or Technical Pullback
25% ProbabilityCorrelation Analysis: DXY, Equities, and the Brent Narrative
The interplay between Brent crude prices, the US Dollar Index (DXY), and major equity indices like the SP500 and Nasdaq provides crucial context for understanding market sentiment. Currently, the DXY is showing a mixed trend. On the 1-hour chart, it's in a bullish trend (ADX 22.31), but the 4-hour chart suggests a neutral trend (ADX 19.43) with a bearish signal, while the daily chart indicates a strong bullish trend (ADX 34.64) at 57.21. This divergence in DXY trends adds a layer of complexity. Typically, a strengthening dollar exerts downward pressure on dollar-denominated commodities like Brent, as they become more expensive for holders of other currencies. However, the current surge in Brent is largely driven by geopolitical risk, which often overrides currency effects, especially when the dollar's own trend is not uniformly strong across all timeframes.
The equity markets have experienced a significant downturn this past week. The SP500 closed down 1.2% at 6536.67, and the Nasdaq 100 fell 1.67% to 23986.8. This risk-off sentiment in equities usually correlates with a move towards safe-haven assets. While gold and other safe havens might typically benefit, the dominant narrative for Brent remains supply-driven fear. If the geopolitical situation were to stabilize, we would likely see a sharp sell-off in oil prices as the risk premium evaporates, and the correlation with falling equities and a potentially strengthening dollar (if it acts as a safe haven) would become more pronounced. For now, the fear premium in oil appears to be outweighing the broader risk-off sentiment pushing equities lower.
The widening Brent-WTI spread, as highlighted in recent market news, is also a critical piece of the puzzle. While both benchmarks are rising, Brent's outperformance suggests that the supply concerns are more acute for the international benchmark. This could be due to specific disruptions affecting supply routes or production facilities crucial for Brent, rather than WTI. Understanding this spread is key, as it can provide insights into the specific nature of the supply fears. If the spread continues to widen, it implies that the market is specifically pricing in risks that impact global seaborne crude more than US domestic production, reinforcing the bullish case for Brent based on immediate geopolitical threats.
The relationship between oil prices and inflation expectations also remains a significant factor. A sustained rise in oil prices, like the one we're witnessing, directly contributes to higher inflation. This can complicate the policy decisions of central banks, potentially leading to higher interest rates. Higher interest rates, in turn, can dampen economic growth and reduce oil demand in the medium to long term. However, in the current environment, the immediate supply-driven fears are the dominant force. Central banks are already grappling with inflation, and rising oil prices add another layer of concern, but the market's immediate focus is on the physical availability of crude rather than the secondary effects on monetary policy.
Fundamental Drivers: Supply Cuts and Demand Resilience
The fundamental picture for Brent crude remains bullish, primarily supported by ongoing supply management efforts and surprisingly resilient demand. OPEC+ continues to demonstrate remarkable discipline in adhering to production quotas, with key members like Saudi Arabia and Russia extending voluntary cuts. This deliberate reduction in supply has been a cornerstone of the price recovery, tightening the global balance and creating a deficit in the market. The data from the "GÜNCEL PİYASA VERİLERİ" section confirms this tight supply environment, with Brent trading strongly and WTI lagging, suggesting specific logistical or geopolitical factors are at play that disproportionately affect Brent. The market is clearly pricing in a scenario where supply remains constrained, regardless of demand fluctuations.
Demand, while facing headwinds from global economic slowdown fears and high inflation, has shown remarkable resilience. China's economic activity, a key driver of global oil demand, has been closely watched. While there are always concerns about the pace of recovery, recent data has not indicated a significant collapse in demand. Furthermore, the energy transition, while ongoing, has not yet significantly reduced the world's reliance on fossil fuels, especially for transportation and industrial sectors. The recent surge in oil prices, driven by geopolitical risk, also paradoxically supports higher prices by potentially dampening demand in the longer term if prices remain elevated, but in the short term, the immediate supply fears are paramount.
The recent news regarding Alaska's oil lease sale generating record revenue of $163.7 million signals a renewed interest in major oil exploration, particularly in areas perceived as less geopolitically sensitive. While this might offer a glimmer of hope for future supply increases, it is a long-term play and does not alleviate the immediate concerns surrounding current geopolitical hotspots. Similarly, the discussion around thermal batteries and AI's energy demand highlights the evolving energy landscape. However, these technological advancements are unlikely to offset the immediate impact of supply disruptions in major producing regions on benchmarks like Brent. The market's immediate focus remains firmly on the physical availability of oil in the coming weeks and months.
The attack on Qatar's Ras Laffan energy hub, mentioned in the recent news, also underscores the vulnerability of critical energy infrastructure. While the immediate impact might be localized, such events contribute to a broader sense of unease and increase the risk premium attached to oil prices. This reinforces the idea that supply disruptions are not just theoretical but a tangible risk that the market is actively pricing in. The combination of proactive supply management by producers and the ever-present threat of geopolitical instability creates a strong fundamental case for sustained higher prices for Brent crude, at least in the near to medium term.
The Road Ahead: Watching Key Levels and Geopolitical Developments
Looking ahead, the trajectory of Brent crude will likely remain heavily influenced by the evolving geopolitical situation in the Middle East and the market's interpretation of OPEC+'s supply strategy. The $112.54 level is now a key pivot point. A sustained hold above this mark, especially if accompanied by continued bullish news flow, could propel prices towards the $116.63 resistance. Conversely, any de-escalation of tensions or significant profit-taking by traders could see prices retreat towards the $101.24 support level. The ADX at 65.23 on the daily chart indicates a very strong trend, suggesting that any pullback might be a correction within a larger uptrend rather than a full reversal, unless fundamental conditions drastically change.
Traders should remain vigilant regarding economic data releases that could influence global demand expectations. While geopolitical risk currently dominates, shifts in inflation data, central bank policy signals, or key economic growth indicators could introduce new dynamics. The correlation with the DXY and equity markets will also be important to monitor. A clear risk-off move in equities coupled with a strengthening dollar could signal a broader market correction, potentially pulling oil prices down with it, especially if the geopolitical premium begins to fade. However, as the past week has shown, the fear of supply disruption can create a powerful counter-narrative.
The current technical setup, with daily RSI at 82.44 and Stochastic in overbought territory, suggests that the market might be due for a breather. However, the sheer strength of the trend indicated by the ADX implies that dips might be shallow and short-lived. The key will be to observe price action around the $112.54 mark and the immediate resistance at $116.63. A decisive breakout above the latter could signal the continuation of the bullish run, targeting higher levels. Failure to overcome this resistance, coupled with signs of de-escalation or significant profit-taking, could lead to a test of lower support levels, starting with $101.24. The market remains highly sensitive to headlines, making a disciplined approach to risk management essential.
The widening Brent-WTI spread is a critical indicator to watch, as it highlights specific supply concerns that are impacting Brent more directly. If this trend continues, it reinforces the idea that the current price surge is fundamentally driven by factors affecting global seaborne crude. Traders should remain focused on the interplay between geopolitical developments, OPEC+ actions, and key technical levels. Patience will be rewarded, as the market is likely to remain volatile, offering opportunities for those who can navigate the noise and identify setups based on confirmed price action and fundamental catalysts.
Frequently Asked Questions: Brent Crude Analysis
What happens if Brent crude breaks below the $101.24 support level?
A close below the $101.24 support level on the daily chart would invalidate the current bullish trend and signal a significant shift in market sentiment. This could lead to further downside pressure, with the next key support observed at $94.87.
Should I consider buying Brent at current levels around $112.54 given the overbought RSI?
While the daily RSI is at 82.44, indicating overbought conditions, the strong trend (ADX 65.23) suggests caution against immediate shorting. Waiting for a confirmed pullback to a support level or a consolidation around $112.54 before considering long positions might offer a better risk/reward ratio.
Is the daily ADX reading of 65.23 a definitive buy signal for Brent crude?
An ADX reading of 65.23 signifies a very strong trend, which is bullish in this context. However, it also indicates extreme trend strength, which, when combined with overbought oscillators like RSI, suggests that the trend may be nearing exhaustion or due for a pause, rather than signaling an immediate buy. Confirmation from other indicators and price action is crucial.
How will the widening Brent-WTI spread affect Brent prices this week?
The widening Brent-WTI spread suggests that specific geopolitical risks are disproportionately impacting global seaborne crude supply. If this trend continues, it reinforces the fundamental bullish case for Brent, as it points to tangible supply constraints that could support prices above current levels, potentially targeting resistance at $116.63.
Technical Outlook Summary
| Indicator | Value | Signal | Interpretation |
|---|---|---|---|
| RSI (14) | 82.44 | Overbought | Caution advised, potential for pullback. |
| MACD Histogram | Positive | Bullish Momentum | Trend strength supports upside. |
| Stochastic | K=74.74, D=61.85 | Overbought | Momentum may be fading. |
| ADX | 65.23 | Very Strong Trend | Confirms powerful upward move. |
| Bollinger Bands | Above Middle Band | Bullish Trend | Price action confirms uptrend. |
Track markets in real-time
AI-powered analysis, technical indicators and real-time price data.
Join Our Telegram Channel
Breaking market news, AI analysis and trading signals instantly.
Join Channel