WTI Crude Oil at $98.39: Chart Pattern Analysis and Weekly Outlook
WTI Crude Oil hovers near $98.39, with key technical indicators flashing mixed signals. This week's analysis focuses on potential breakout scenarios and crucial support/resistance levels.
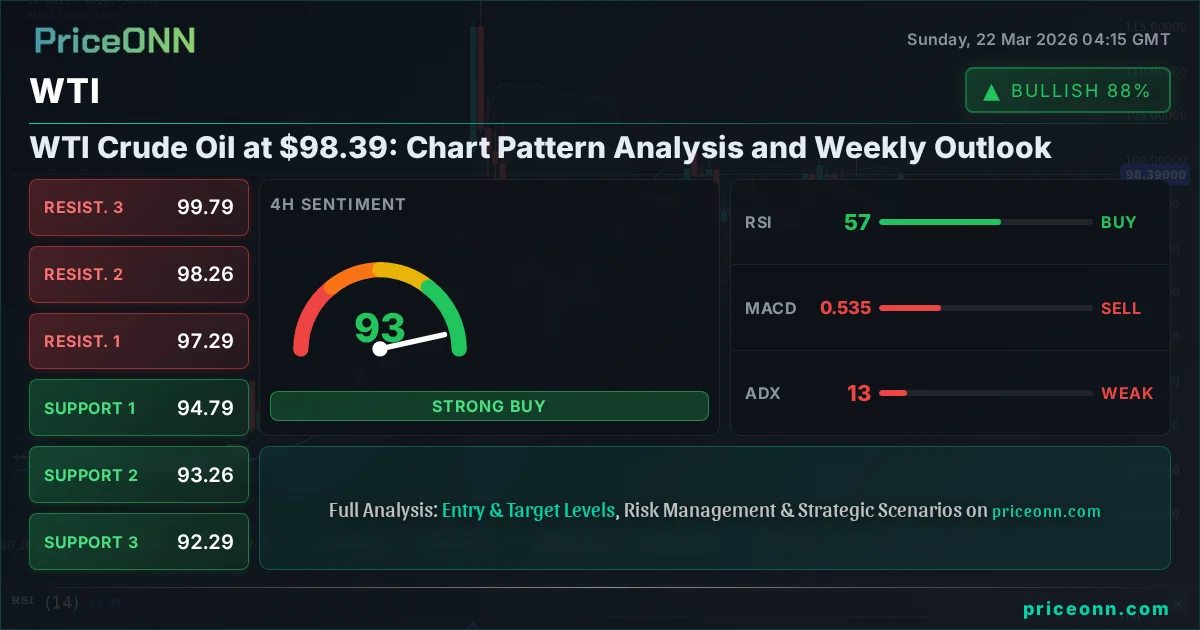
WTI Crude Oil is currently priced at $98.39, a critical juncture that demands close observation from traders and analysts alike. As the weekend draws to a close, the market is poised at a technical crossroads, with indicators suggesting a potential shift in momentum. This weekly review delves into the intricate dance of price action, key support and resistance levels, and the underlying technical signals that will likely dictate WTI's trajectory in the coming days. The recent price action, marked by a significant daily drop of -3.76% and a volatile trading range between $92.79 and $99.05, paints a picture of a market grappling with conflicting forces. Understanding these dynamics is paramount for navigating the inevitable price swings.
- WTI Crude Oil is trading at $98.39, showing a strong upward trend on the daily chart (ADX 59.27) but exhibiting weakness on shorter timeframes.
- Critical support is identified at $92.29, while resistance looms around $99.79, levels that will be pivotal in determining the next directional move.
- The RSI at 70.58 on the daily chart signals overbought conditions, suggesting potential for a pullback despite the dominant uptrend.
- Geopolitical tensions and AI's energy demand are influencing WTI's correlation with broader market sentiment and inflation expectations.
The energy markets have been a focal point of discussion, and WTI's position at $98.39 is no exception. Last week's trading saw a notable surge, with WTI climbing from a low of $92.79 to a high of $99.05, reflecting a robust upward momentum on the daily timeframe. This rally, however, was met with selling pressure, as evidenced by the daily price change of +3.76% but a closing price that suggests the peak might be in. The ADX reading of 59.27 on the daily chart underscores the strength of the prevailing uptrend, indicating that significant directional conviction is present. Yet, caution is warranted. The RSI(14) on the daily chart stands at 70.58, firmly in overbought territory. This divergence between a strong trend and overbought conditions often precedes a consolidation or a correction, making the $98.39 level a critical point for observation.
Digging deeper into the technicals, the 1-hour chart presents a more nuanced picture. Here, the trend is neutral (50% strength), with immediate support at $97.77 and resistance at $99.54. The RSI(14) at 61.45 suggests a slight upward bias, but the MACD is showing negative momentum, hovering below its signal line. Stochastic K and D lines are in the overbought zone at 91.26 and 89.37 respectively, hinting at a potential reversal or at least a pause in the immediate upward push. This conflict between the daily's strong uptrend and the 1-hour's neutral-to-cautious signals highlights the choppiness that traders might encounter. The ADX at 17.29 on this shorter timeframe confirms a lack of strong directional commitment, suggesting that intraday traders might face range-bound conditions or whipsaws.
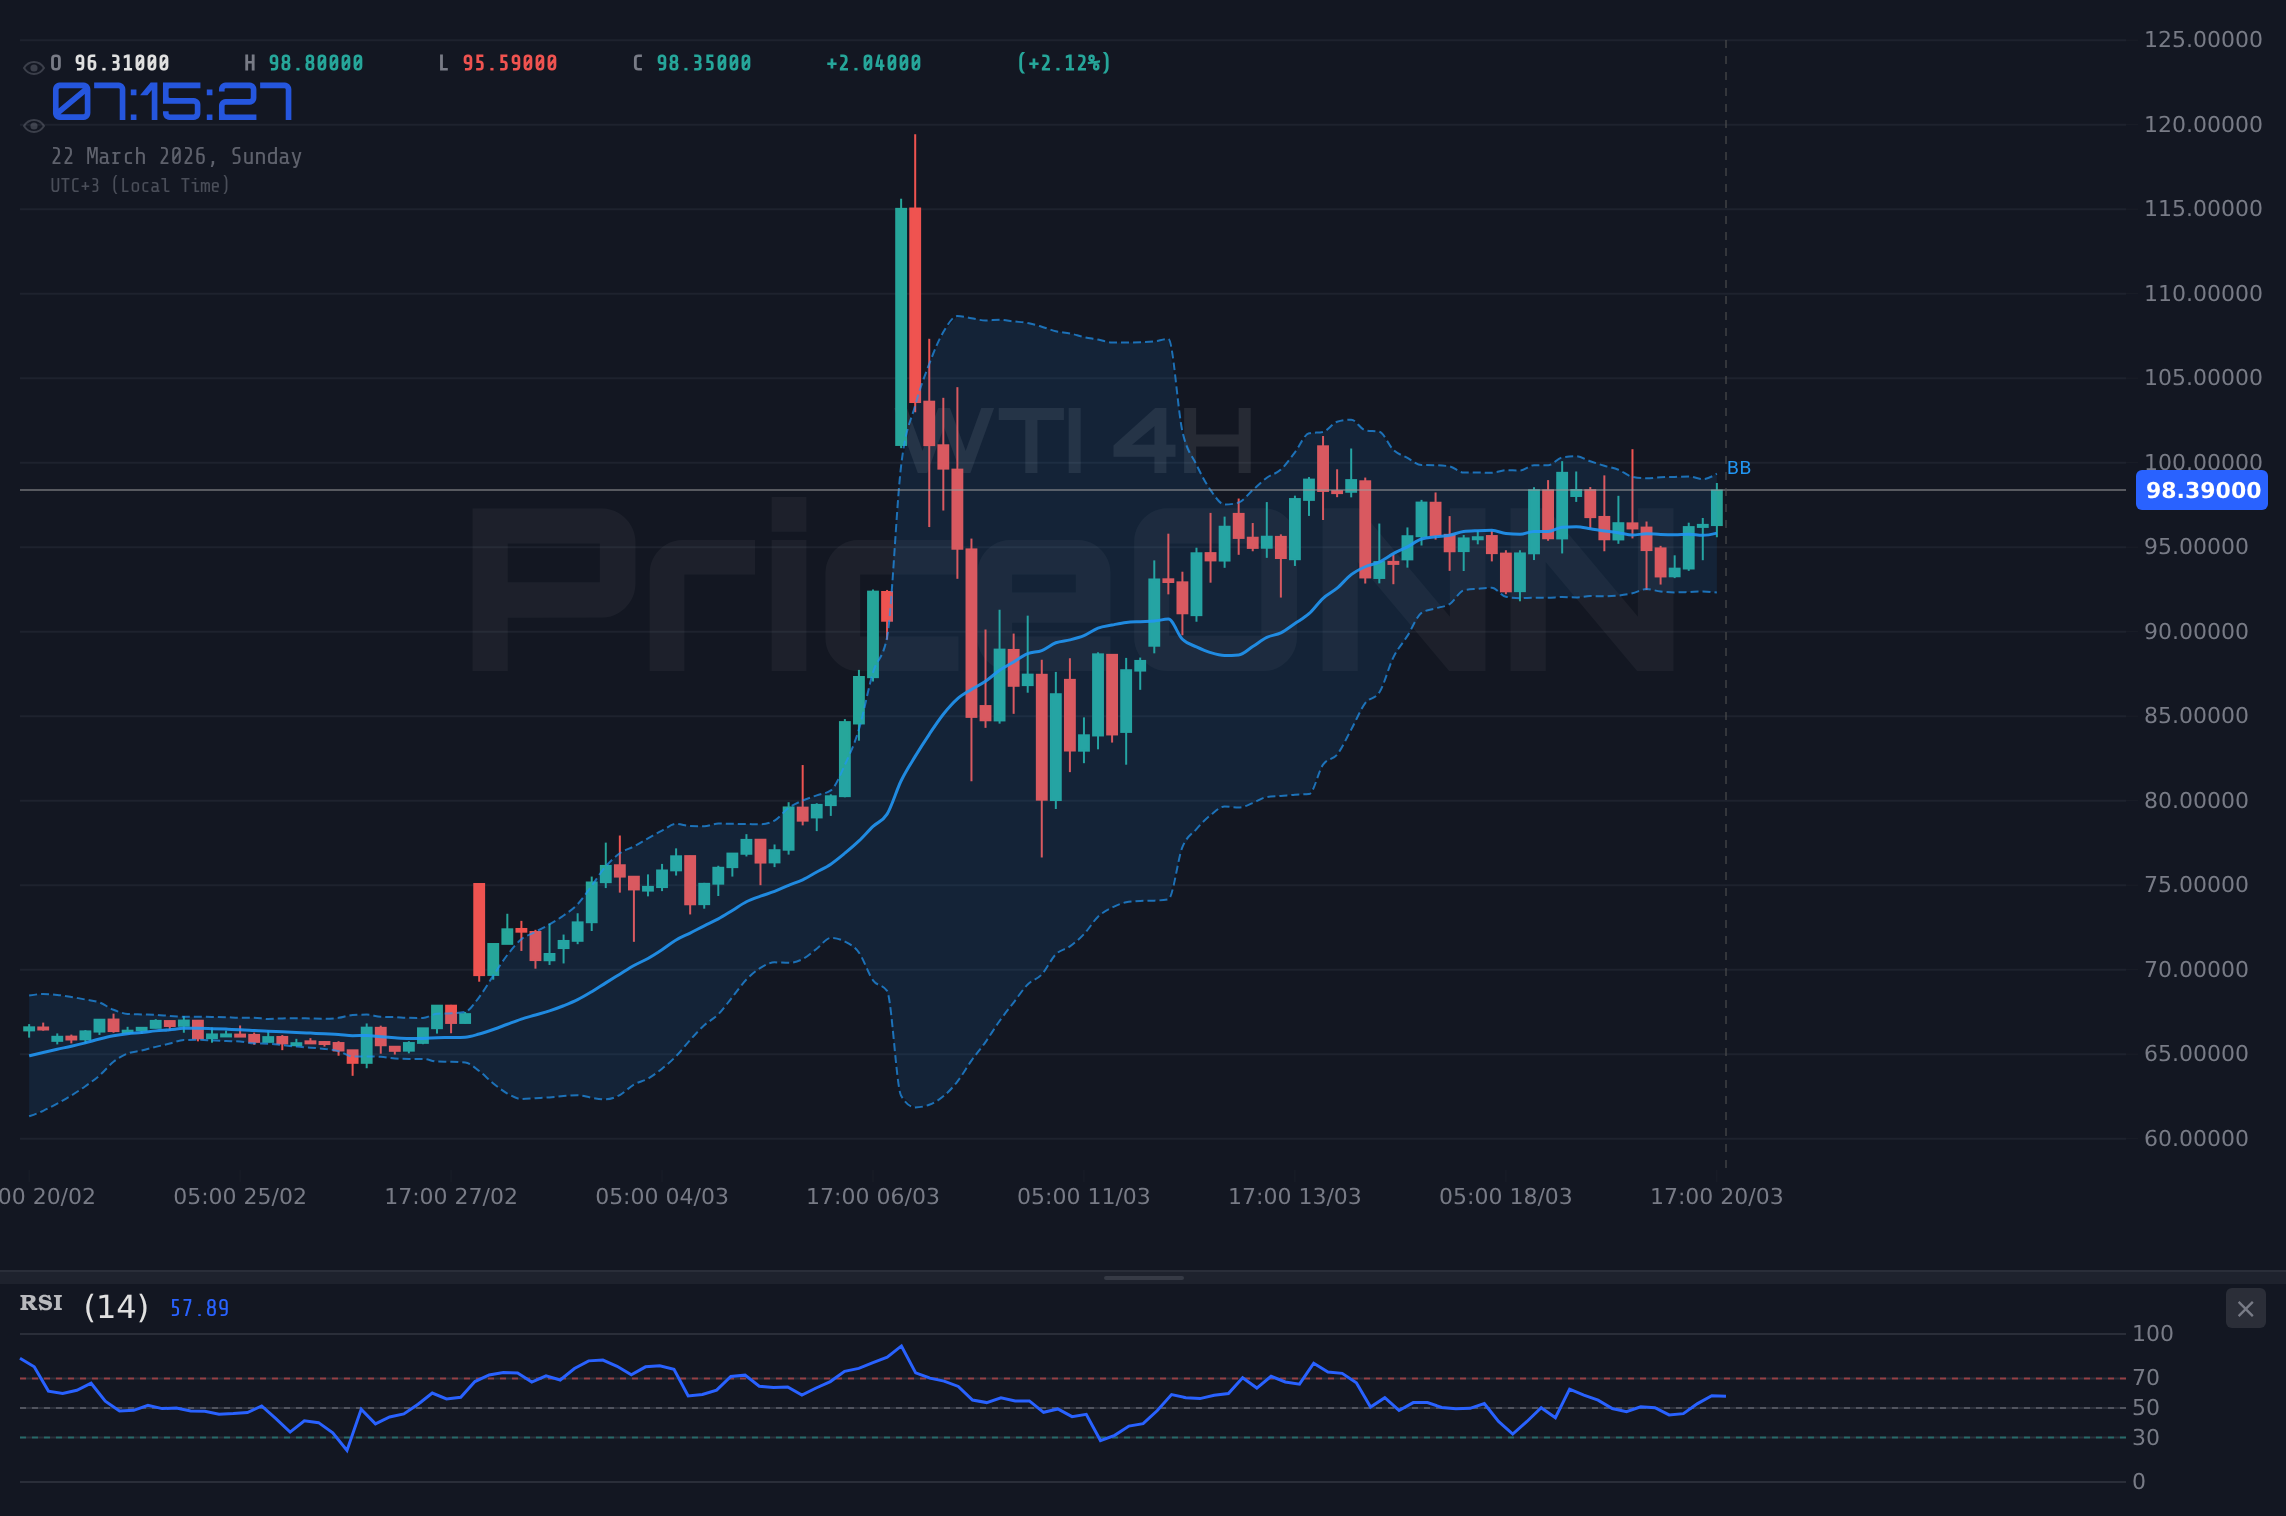
The 4-hour timeframe offers further insight. Here, the trend is showing an 82% strength towards the upside, with support identified at $94.79 and resistance at $97.29. The RSI at 57.06 remains in the neutral zone, leaning towards bullish, and the Stochastic lines (K=54.04, D=33.86) indicate a bullish crossover, reinforcing the idea of upward potential. However, the MACD is again showing negative momentum, a recurring theme across shorter timeframes that cannot be ignored. This suggests that while the daily trend is strongly bullish, the immediate path forward might be hindered by short-term selling pressure and consolidation. The ADX at 13.05 on this timeframe is notably weak, signaling a lack of a strong trend and potentially choppy price action. This is a crucial observation for any short-term trading strategy, as it implies that significant breakouts might be difficult to sustain without further confirmation.
The Bull's Roadmap: Navigating Towards $100+
For the bulls to maintain control and push WTI prices significantly higher, several conditions must be met. The immediate hurdle is the $99.54 resistance level on the 1-hour chart. A decisive break and sustained hold above this point would be the first sign of renewed bullish conviction. Following this, the next significant resistance lies at $100.18. A clear move above $100 would not only be psychologically important but would also break through a key psychological barrier, potentially triggering further upside momentum. The ultimate target in this bullish scenario, looking at the daily chart's resistance levels, could extend towards $104.37 and potentially $107.94. For this bullish thesis to remain intact, the price must decisively break and hold above the $99.54 and $100.18 levels, invalidating the short-term bearish signals seen on the hourly and 4-hour charts.
The daily chart's RSI at 70.58 is a significant factor to consider. While it indicates overbought conditions, it does not necessarily preclude further price appreciation in a strong trend. Historically, RSI can remain in overbought territory for extended periods during powerful uptrends. However, the confluence of this overbought RSI with the weak ADX readings on shorter timeframes suggests that a period of consolidation or a mild pullback might be more probable before any significant upward continuation. The key here is not to chase the price higher but to wait for confirmation. A bullish scenario likely requires a period of consolidation around the $98-$99 mark, allowing shorter-term indicators to reset before a potential push towards the higher resistance levels. The market sentiment, influenced by factors like the DXY's current level of 99.25 and ongoing geopolitical developments, will play a crucial role in determining whether this bullish outlook can materialize.
Furthermore, the broader market context cannot be ignored. The DXY's recent strength, currently at 99.25, typically exerts downward pressure on commodities priced in dollars, including WTI. However, the simultaneous strength in WTI suggests that fundamental supply-side factors or specific geopolitical risks might be overriding this inverse correlation. The recent news regarding the Ras Laffan attack and the broader discussion around AI's energy demand and a potential nuclear power resurgence add layers of complexity. These factors can create volatility and price spikes, even if the broader trend is influenced by dollar strength. A sustained bullish move above $100 would need to overcome these headwinds, signaling a strong market appetite for oil despite a strengthening dollar and potential inflationary pressures.
Where Bears Take Control: The Risk of a Pullback
Conversely, the bearish scenario hinges on the failure of WTI to sustain its price above the critical $98.39 level. The immediate trigger for a bearish move would be a break below the 1-hour support at $97.77. If this level gives way, the next target would be the $96.64 support, followed by $96.00. A decisive close below $96 would signal a significant shift in momentum, invalidating the short-term bullish outlook and opening the door for a deeper correction. The 4-hour chart's support at $94.79 would then become the next major level to watch, with a potential downside extension towards $93.26 and even $92.29, which represents a significant psychological and technical support.
The daily chart's RSI at 70.58, while not an immediate sell signal, does suggest that the market is 'getting tired' at these elevated levels. A break below key short-term support levels could accelerate the RSI's descent from overbought territory, potentially leading to a decline towards the 50 level. The ADX on the daily chart, while strong at 59.27, can still see pullbacks if the trend falters. If WTI breaks below the $96 mark, we could see a rapid unwinding of long positions, exacerbating the downward move. This bearish thesis would be further supported if the DXY continues to strengthen and risk-off sentiment permeates the broader markets, as indicated by the SP500's current price of 6536.67 and its -1.2% daily change.
Geopolitical factors could also act as a catalyst for a bearish turn, paradoxically. While tensions often drive prices up, de-escalation efforts or a resolution to ongoing conflicts could remove the 'risk premium' currently embedded in oil prices. News reports suggesting a calming of Middle East tensions, or a significant easing of sanctions on oil-producing nations like Venezuela (currently trading with a strong trend on its 4H chart), could lead to a swift sell-off. The widening Brent-WTI spread, a topic of recent market commentary, also warrants attention. If this spread narrows significantly due to specific supply adjustments or geopolitical shifts, it could signal a weakening in the overall oil market structure, potentially dragging WTI lower.
The Waiting Game: Consolidation Around $98.39
A neutral scenario suggests that WTI might struggle to make a decisive move in either direction in the short term, consolidating around the current $98.39 level. This would likely occur if bullish momentum falters at the $99.54 resistance, and bearish pressure fails to break the $97.77 support decisively. In such a scenario, we could see a period of range-bound trading, characterized by lower volatility and choppy price action. The ADX readings on the 1-hour and 4-hour charts, currently showing weakness (17.29 and 13.05 respectively), support this possibility. Price might oscillate between $97.00 and $99.00, with traders looking for smaller intraday opportunities rather than significant directional trades.
This consolidation phase could be driven by a market waiting for clearer signals. Investors might be holding back ahead of key economic data releases, such as employment figures or inflation reports, or awaiting further clarity on central bank policy directions. The Fed's stance, particularly regarding interest rates, continues to be a major driver for commodity prices through its impact on the dollar and overall market risk appetite. If the market remains in a holding pattern, expect the RSI to hover around the 50-60 mark, and MACD to give mixed signals, oscillating around the zero line. Stochastic oscillators might also trade sideways within the neutral zone. This phase could be crucial for allowing the RSI on the daily chart to cool down from its overbought 70.58 level, setting the stage for a more sustainable move once a clear catalyst emerges.
The interplay between geopolitical news and fundamental supply/demand factors could also keep WTI in a tight range. For instance, positive news regarding de-escalation in the Middle East might be offset by reports of strong demand or supply disruptions elsewhere, leading to a stalemate. Similarly, concerns over AI's energy consumption driving demand could be balanced by news of increased oil production or strategic reserve releases. In this neutral environment, price action would likely become more sensitive to minor news events, leading to short-term fluctuations without establishing a clear trend. Traders would need to focus on the boundaries of the range, using support as potential buying opportunities and resistance as potential selling points, always with tight risk management given the lack of directional conviction.
Which Scenario Dominates: A Probabilistic Outlook
Considering the technical indicators and market context, the most probable scenario for WTI in the immediate short term (next 1-3 days) leans towards a cautious bullish outlook, but with a high probability of consolidation before any significant upward move. The powerful daily uptrend, evidenced by the ADX of 59.27 and the price holding above key daily support levels like $91.26, provides a strong foundation. However, the overbought RSI of 70.58 and the conflicting signals on shorter timeframes suggest that the path upwards will not be linear. Therefore, I assign a 55% probability to a scenario involving initial consolidation or a mild pullback, followed by a potential continuation of the uptrend. A purely bearish scenario, where prices decisively break below $92.29, is assigned a 30% probability, primarily driven by a significant shift in geopolitical sentiment or a strong dollar rally.
The remaining 15% probability is allocated to a scenario where WTI breaks decisively above $99.79 resistance and targets $100.18 and beyond, suggesting a strong bullish impulse that overcomes the current overbought conditions and short-term bearish signals. This would likely require a significant bullish catalyst, such as unexpected supply disruptions or a major geopolitical escalation. The current price at $98.39 is a pivot point; a failure to hold this level could quickly shift the balance towards the bearish or consolidation scenarios. The strength of the daily trend is undeniable, but the immediate choppy signals on shorter timeframes indicate that the market needs to resolve these contradictions before committing to a sustained move. Therefore, patience and observation are key for traders looking to capitalize on the next significant price movement.
The Bear's Grip: A Retreat Below $92.29
30% ProbabilityThe Waiting Game: Consolidation Around $98.39
55% ProbabilityThe Bull's Charge: Breaking $100.18
15% ProbabilityWhat I'm Watching This Week: Key Triggers to Monitor
As we move into the trading week, three key factors will be crucial in shaping WTI's price action. Firstly, the sustained price action around the $98.39 level is paramount. A clear hold above this mark, especially with follow-through above the $99.54 resistance, would validate the bullish outlook. Conversely, a decisive break below $97.77 support could signal a deeper correction. Secondly, I'll be closely monitoring the DXY's movement. Its current level of 99.25 and the prevailing trend will significantly influence WTI's correlation and potential price direction. Any sharp moves in the dollar index could trigger corresponding moves in oil. Thirdly, geopolitical developments remain a wild card. Any escalation or de-escalation in the Middle East, or significant news related to energy supply chains or AI energy demand, could inject significant volatility and override technical signals. Traders should remain vigilant for these catalysts.
Frequently Asked Questions: WTI Analysis
What happens if WTI Crude Oil breaks below $97.77 support this week?
A break below $97.77 on the 1-hour chart would invalidate the immediate bullish bias, potentially triggering a move towards the $96.64 support. This scenario gains probability if geopolitical de-escalation occurs or if the DXY strengthens further.
Should I consider buying WTI at current levels near $98.39 given the daily RSI at 70.58?
Buying at current levels requires caution due to the daily RSI signaling overbought conditions. A more prudent approach would be to wait for a pullback to a more favorable support level like $97.00-$97.77, or for confirmation of a sustained breakout above $99.54.
Is the ADX reading of 13.05 on the 4-hour chart a signal to avoid trading WTI?
An ADX of 13.05 indicates a weak trend and potentially choppy or range-bound conditions. While not a complete 'avoid' signal, it suggests that trades might be riskier, with lower probability of sustained moves and higher chances of whipsaws. Patience for clearer trend signals is advised.
How will the potential AI energy demand impact WTI prices this week?
The increasing energy demand from AI and data centers could provide underlying support for WTI prices by boosting demand expectations. If this factor gains prominence in market narratives, it could help WTI overcome short-term headwinds and push towards higher resistance levels, especially if supply remains constrained.
The energy markets are dynamic, and WTI's current position at $98.39 presents a complex picture. While the daily trend remains bullish, shorter-term indicators suggest caution and potential consolidation. The interplay between technical signals, geopolitical events, and macroeconomic drivers will be crucial in determining the next move. By understanding the different scenarios and focusing on key triggers, traders can navigate this environment with greater confidence. Patience and disciplined risk management remain the cornerstones of successful trading, especially in periods of uncertainty.
| Indicator | Value | Signal | Interpretation |
|---|---|---|---|
| RSI (14) | 70.58 | Neutral | Overbought on Daily, but can sustain in strong trends. |
| MACD Histogram | -0.23 | Bearish | Negative momentum on 1H, suggesting short-term weakness. |
| Stochastic | K: 91.26, D: 89.37 | Bearish | Overbought on 1H, indicating potential reversal or pause. |
| ADX | 59.27 | Bullish | Very strong uptrend on Daily, but weak on 1H/4H. |
| Bollinger | Lower Band | Watch | Price is near upper band on Daily, but below middle on 1H/4H. |
Track markets in real-time
AI-powered analysis, technical indicators and real-time price data.
Join Our Telegram Channel
Breaking market news, AI analysis and trading signals instantly.
Join Channel