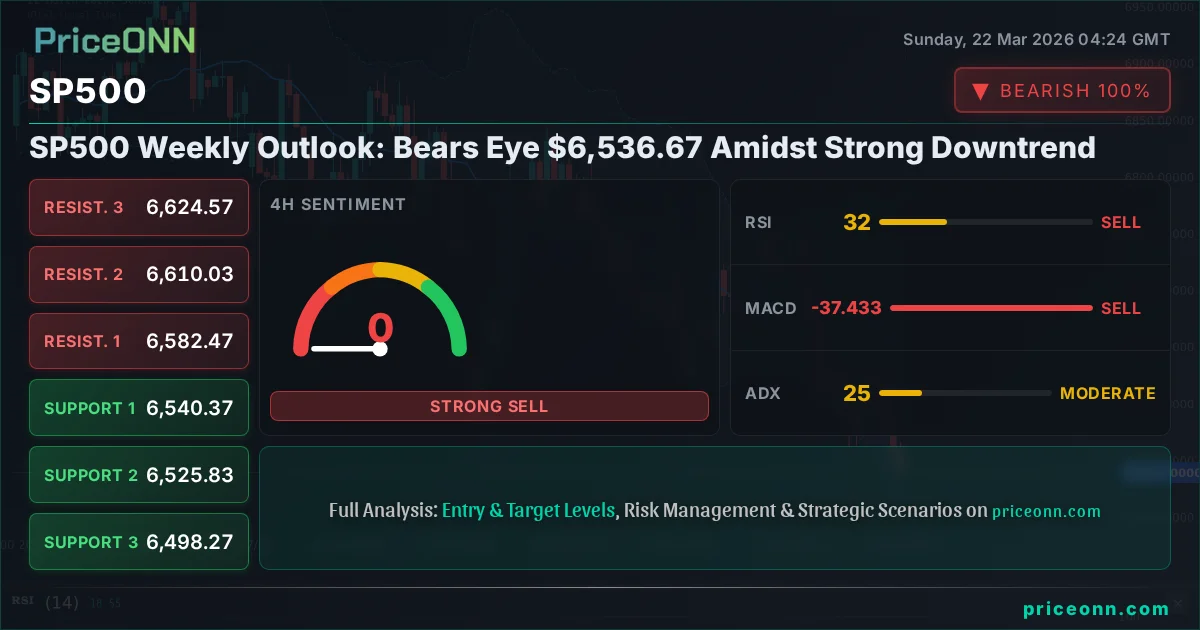
SP500 Weekly Outlook: Bears Eye $6,536.67 Amidst Strong Downtrend
The SP500 is trading at $6,536.67, with bears pushing lower. Analysis of RSI, MACD, and ADX indicates a strong downtrend, highlighting key support and resistance levels to watch.
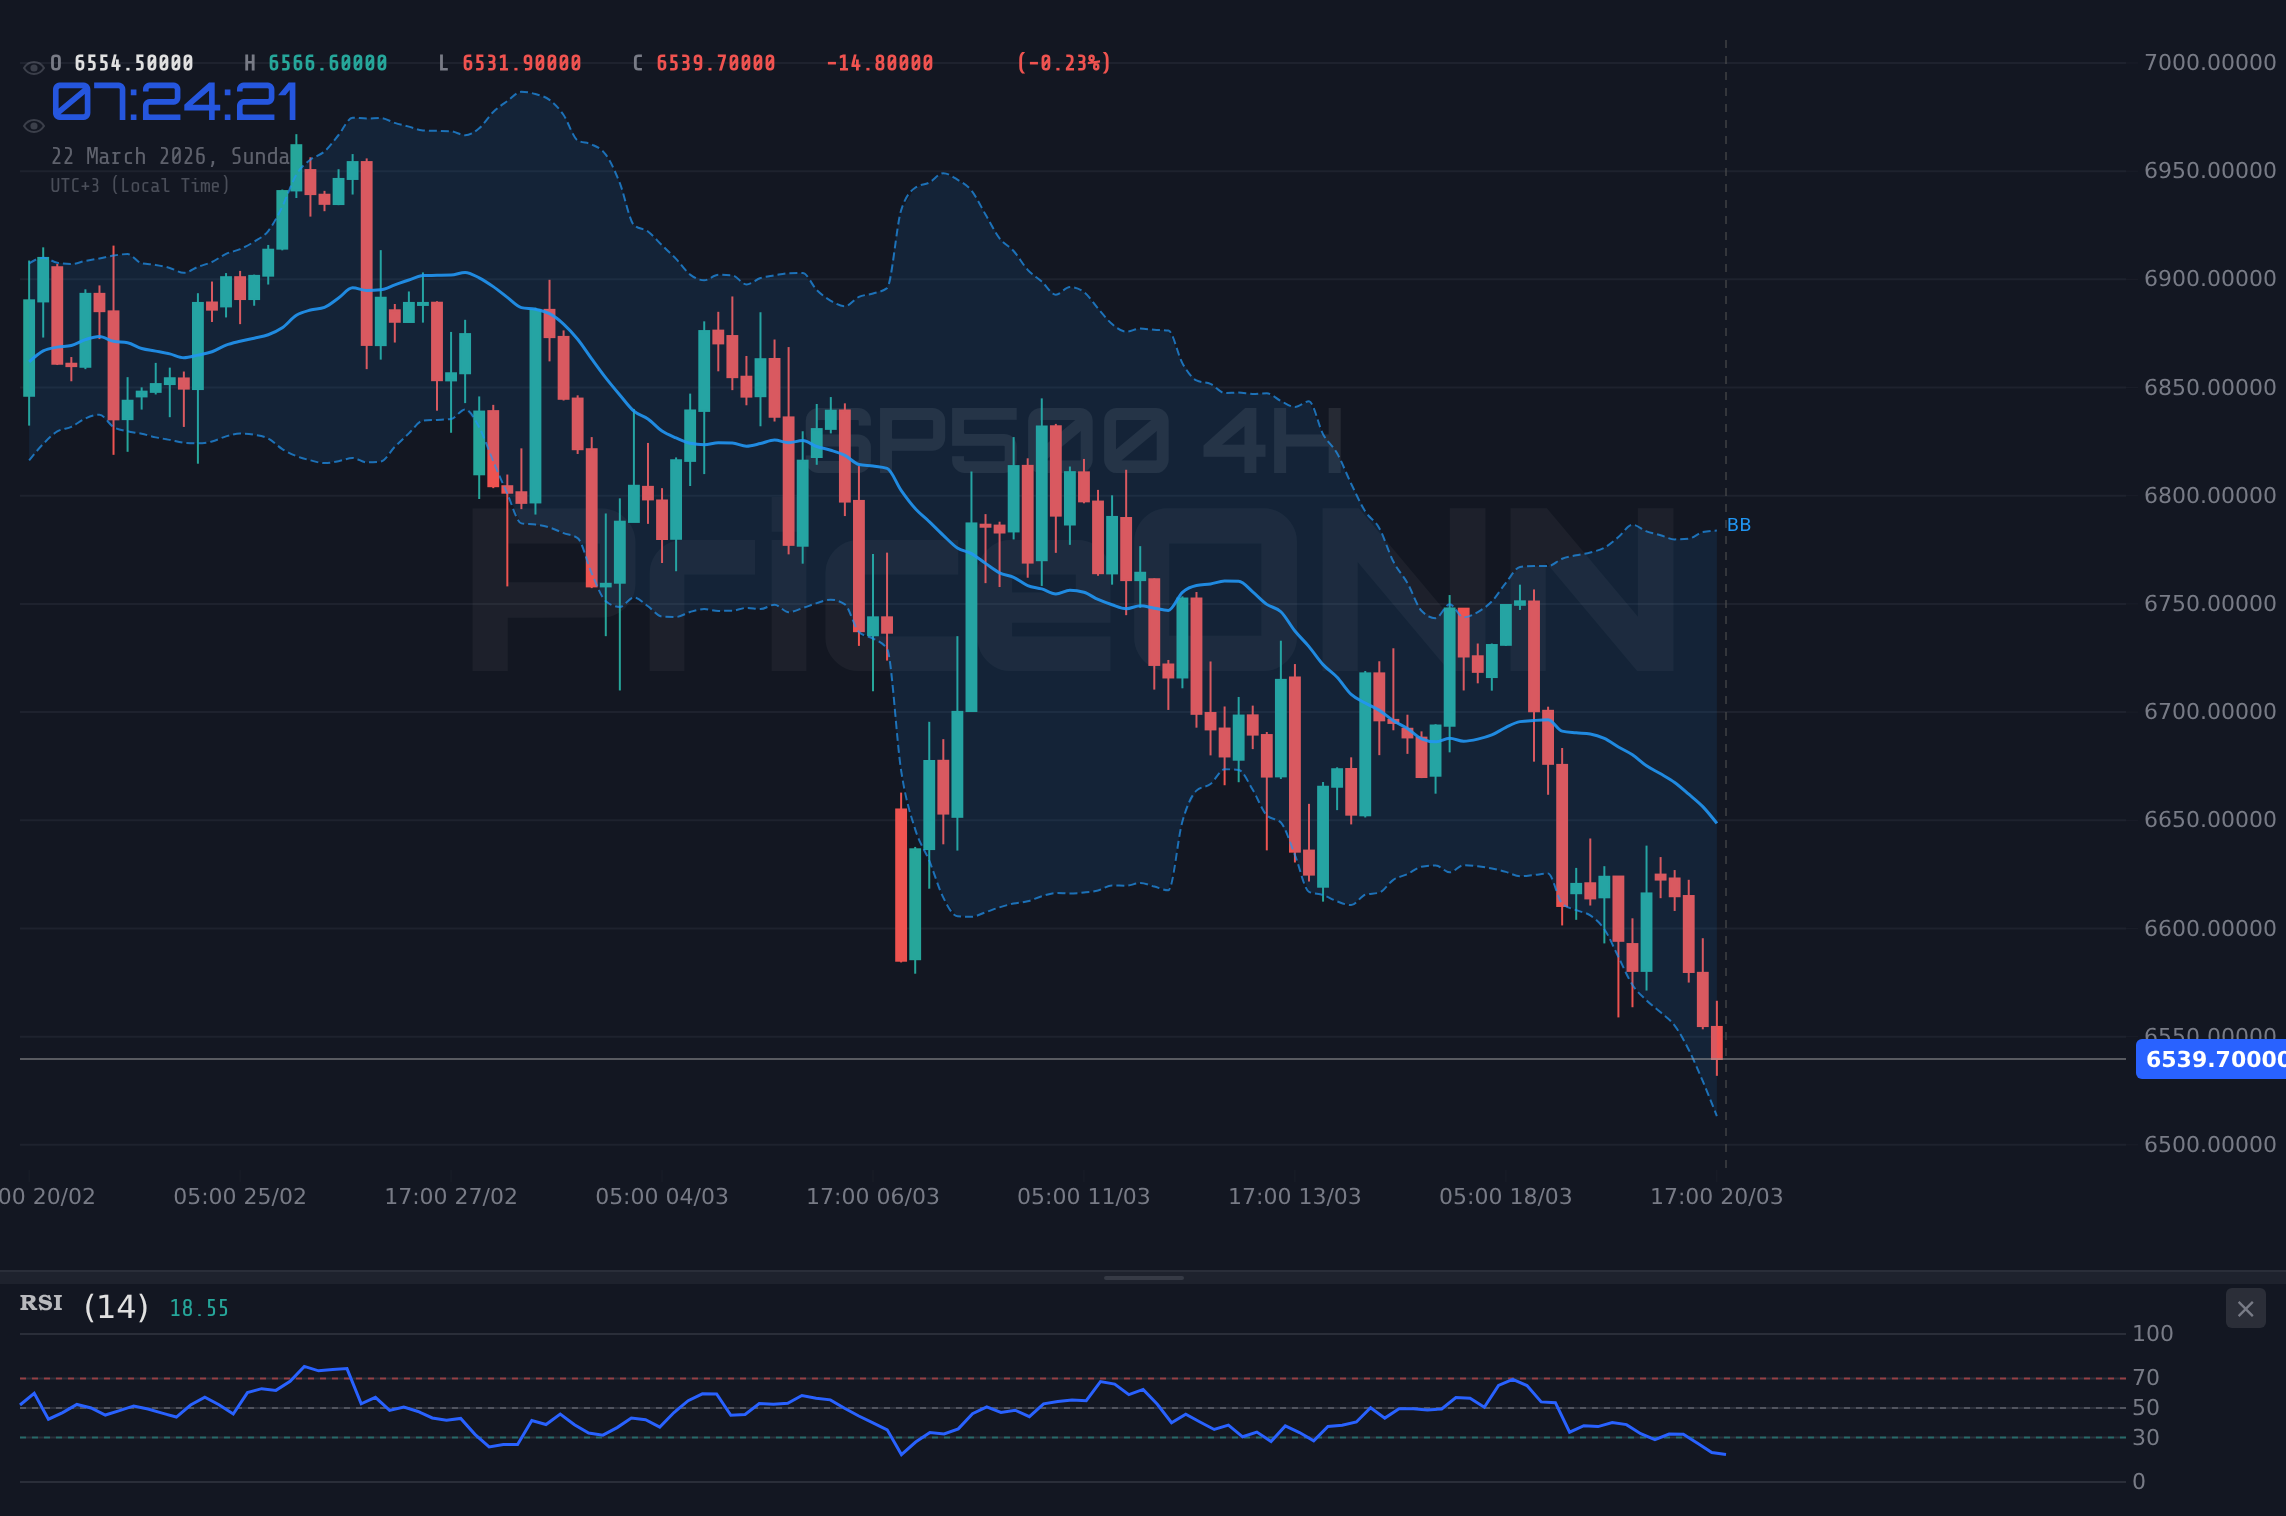
The past week has been a stark reminder of the market's inherent volatility, with the SP500 index shedding significant ground and last closing at $6,536.67. This sharp downturn, particularly evident in the 1-hour and 4-hour charts, signals that the bears have regained considerable control, pushing the index into a strong downtrend on multiple timeframes. While the daily chart still shows some potential for consolidation, the overwhelming technical picture across shorter timeframes suggests further downside pressure is likely. This analysis delves into the specific technical indicators and price action that have defined the past week and outlines the critical levels and scenarios to monitor as we head into the next trading period.
- The SP500 closed at $6,536.67, marking a significant weekly decline driven by strong bearish momentum.
- RSI readings across 1H (37.71) and 4H (32.35) indicate a downtrend, nearing oversold conditions but not yet signalling a reversal.
- ADX values of 37.97 (1H) and 24.88 (4H) confirm a strong to moderate downtrend, with momentum potentially waning on the daily.
- Key support levels to watch are $6,491.3, $6,476.4, and $6,450.9, while resistance looms at $6,531.7 and $6,557.2.
- Geopolitical tensions and central bank policy divergence are contributing factors, though the primary driver remains technical momentum.
The narrative for the SP500 this past week has been unequivocally bearish. After a period of consolidation, the index decisively broke below key support levels, triggering stop-loss orders and accelerating the downward move. The 1-hour chart paints a grim picture, with a powerful downtrend (94% strength) dominating price action. This is further corroborated by the MACD histogram consistently printing negative values, indicating bearish momentum is firmly in place. The ADX at 37.97 on this timeframe reinforces the strength of this move, suggesting that any attempts at a bounce are likely to be met with selling pressure. Traders are clearly favouring short positions as risk appetite diminishes.
Digging deeper into the 4-hour timeframe, the bearish sentiment persists, albeit with slightly less intensity in trend strength (92%). The SP500 price action here shows the index trading firmly below its middle Bollinger Band, a classic sign of a downtrend. The Stochastic Oscillator, with %K at 10.52 and %D at 26.57, is deep in oversold territory, hinting that a short-term bounce might be on the cards. However, this is not a buy signal in itself, especially when considering the prevailing trend. The RSI at 32.35 also resides in the bearish zone, reinforcing the idea that sellers are in command. The ADX reading of 24.88 here suggests a moderate trend, which could imply that the sharpest part of the sell-off might be behind us, but the overall direction remains down.
On the daily chart, the picture becomes slightly more nuanced, though still predominantly bearish. The trend strength is currently at 100%, indicating a very strong established downward movement. The SP500 is trading below the middle Bollinger Band, and the Stochastic Oscillator (%K: 16.28, %D: 27.82) is deeply oversold, presenting a potential catch for falling knives. The RSI at 32.52 suggests that while oversold, there is still room for further downside before any significant reversal is likely. The ADX here at 44.59 is notably high, confirming a very strong trend on this longer timeframe. This suggests that the current price action, while appearing oversold on shorter timeframes, is part of a larger, powerful bearish move that is far from over. The key support at $6,486.83 will be crucial to watch.
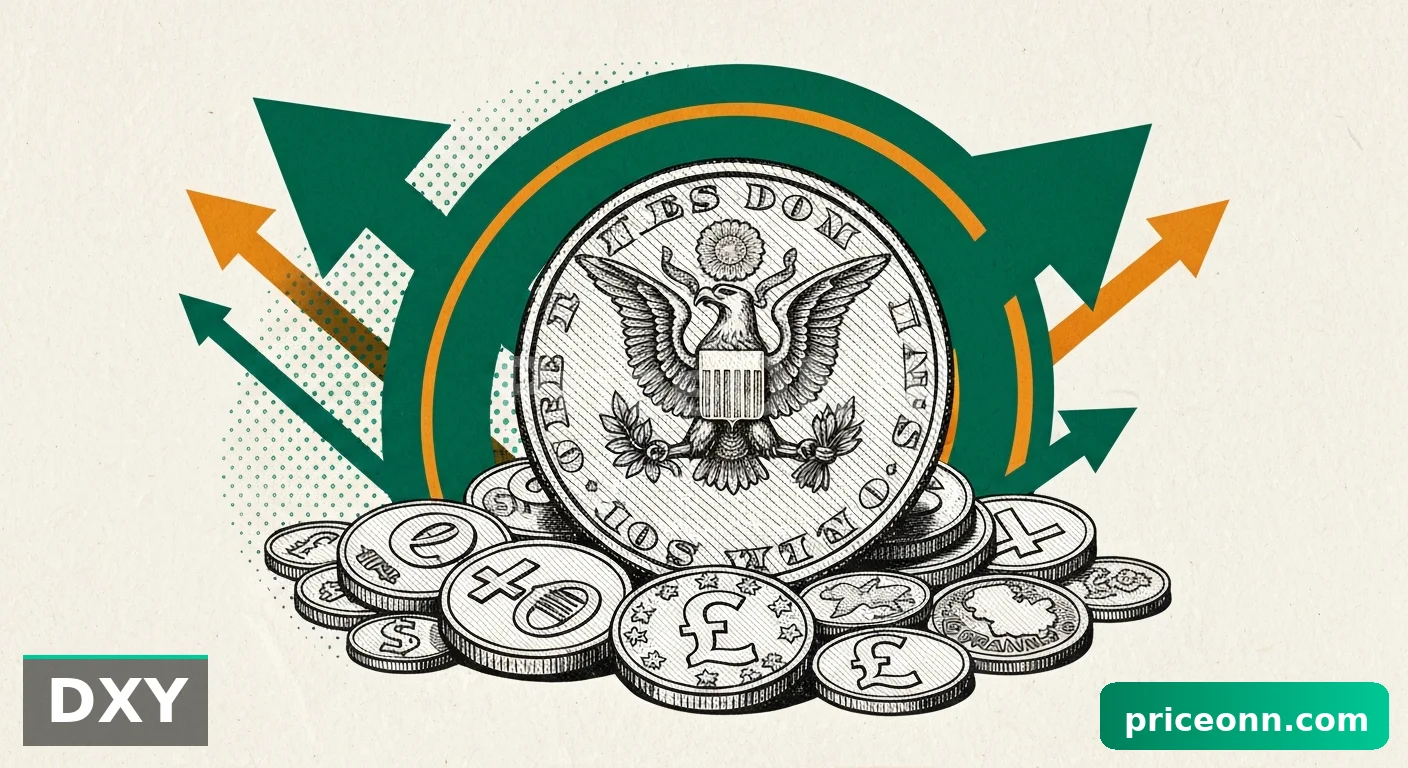
The correlation with the US Dollar Index (DXY) is a critical factor to consider. As the DXY showed a strong upward move on the 1-hour and daily charts (91% and 92% strength respectively), it exerts downward pressure on risk assets like the SP500. The DXY's current price of 99.25, trading above its middle Bollinger Band and with a strong ADX reading of 34.64 on the daily chart, indicates a strengthening dollar. This inverse relationship is a well-established market dynamic; a rising dollar often signifies a 'risk-off' sentiment, leading investors to pull capital from equities and seek the perceived safety of the US currency. This macro backdrop adds another layer of confirmation to the bearish outlook for the SP500.
Geopolitical events, though not directly tied to the SP500's immediate price action in the past 48 hours, continue to cast a long shadow over global markets. The recent energy market turmoil, including reports of attacks on Qatar's Ras Laffan energy hub and the subsequent debate around the LNG glut narrative, underscores the persistent instability in energy supply chains. While this primarily impacts energy prices and inflation expectations, such global uncertainties invariably contribute to a general 'risk-off' sentiment. This sentiment fuels demand for safe-haven assets, often at the expense of riskier assets like equities. The energy crisis narrative, coupled with the ongoing global pivot back towards nuclear power and Alaska's record oil lease sales, creates a complex and unpredictable macro environment that can quickly spill over into broader market sentiment, impacting indices like the SP500.
The recent news regarding Big Tech's AI boom fueling a carbon emissions crisis and the subsequent push into carbon credits also adds a layer of complexity. While seemingly unrelated to direct price action, the sheer energy demand of AI data centers highlights potential future economic bottlenecks and resource constraints. This can indirectly influence investor sentiment and risk perception. Furthermore, the news about Alaska's oil lease sale, while positive for energy production, also signals a renewed interest in fossil fuels, which could have long-term implications for inflation and central bank policy, indirectly affecting the SP500 through interest rate expectations.
Looking at the technical indicators in more detail, the RSI readings across the board are telling a story of oversold conditions without immediate reversal signals. On the 1-hour chart, RSI is at 37.71; on the 4-hour, it's 32.35; and on the daily, 32.52. While these are approaching the oversold threshold (typically below 30), they are not yet indicating a strong buy divergence. This suggests that while the market might be 'due' for a bounce, the underlying selling pressure remains dominant. The ADX, however, is a different story. On the 1-hour, it's a strong 37.97, indicating a forceful trend. On the 4-hour, it drops to a more moderate 24.88, and on the daily, it spikes to 44.59, confirming a very strong trend on the longer timeframe. This divergence in ADX strength across timeframes is worth noting; it suggests the immediate trend might be losing steam, but the daily trend remains robust.
The MACD indicator further reinforces the bearish sentiment. Across all three timeframes (1H, 4H, 1D), the MACD histogram is printing negative values and remains below the signal line. This consistently indicates bearish momentum. There are no signs of bullish crossovers or positive divergence that would suggest an imminent trend reversal. The consistent negative readings mean that sellers are actively pressing their advantage, and buyers are hesitant to step in aggressively. This lack of positive MACD signals is a key reason why the oversold RSI readings should be treated with caution rather than as immediate buy signals.
Stochastic Oscillators also paint a picture of bearish dominance, albeit with a potential for short-term fluctuations. On the 1-hour chart, the Stochastic is in oversold territory but showing a slight upward cross (%K: 21.93, %D: 17.22), hinting at a possible short-term bounce. However, on the 4-hour chart, it's also oversold (%K: 10.52, %D: 26.57) but showing a bearish cross (K < D), suggesting further downside. The daily Stochastic (%K: 16.28, %D: 27.82) is also deeply oversold and showing a bearish cross. This conflicting signal between the 1-hour and the longer timeframes suggests that any bounce seen on the shorter timeframe might be temporary and could be absorbed by the stronger bearish trend observed on the daily chart. Patience and confirmation are key here.
Bollinger Bands are also acting as expected in this bearish environment. On the 1-hour and 4-hour charts, the price is trading below the middle band, indicating downward pressure. On the daily chart, the SP500 has even broken below the lower Bollinger Band, which typically signifies extreme bearishness and can sometimes precede a bounce. However, in a strong trend, prices can 'walk the band' for extended periods. The band width itself doesn't show significant expansion or contraction that would suggest an imminent breakout, but the consistent position below the middle band reinforces the bearish narrative.
The critical support levels we are watching are $6,491.3, $6,476.4, and $6,450.9 on the 1-hour chart. A decisive break below these levels would confirm the continuation of the downtrend and likely trigger further selling. On the 4-hour chart, the key support zone is around $6,498.27. The daily chart presents more significant support at $6,486.83 and further down at $6,450.9. These levels are crucial psychological and technical barriers that bulls need to defend to even contemplate a stabilization. Conversely, resistance levels on the 1-hour chart are at $6,531.7 and $6,557.2. A sustained move above these levels would be the first sign of potential capitulation from the bears, but given the current technical setup, this seems unlikely in the short term. On the 4-hour chart, resistance is seen at $6,582.47 and $6,610.03.
The overall market sentiment, as reflected by the SP500's performance, is currently one of caution and risk aversion. This is amplified by the strengthening DXY and the ongoing geopolitical uncertainties, particularly in energy markets. While specific news events from the last 48 hours, such as the Ras Laffan attack or the AI emissions debate, might not have directly moved the SP500 in a dramatic fashion, they contribute to the broader narrative of global instability. This backdrop makes investors more sensitive to negative technical signals, reinforcing the bearish bias. The market appears to be pricing in potential future economic headwinds, possibly linked to energy prices or inflation concerns, which would naturally weigh on equity valuations.
Considering the confluence of technical signals - strong downtrend on multiple timeframes, negative MACD, oversold RSI without clear divergence, and a strong DXY - the probability leans heavily towards further downside for the SP500 in the immediate short term. However, the deeply oversold conditions on the daily Stochastic and RSI cannot be entirely ignored. A short-term technical bounce is plausible, especially if the price tests the lower daily support levels. The key will be whether this bounce can gather enough momentum to overcome the resistance levels and signal a genuine shift in sentiment, or if it will merely be a pause before the next leg down.
The current market structure suggests that while bears are in control, the depth of the oversold indicators on longer timeframes warrants a degree of caution against blindly chasing shorts. A capitulation event, where extreme fear drives a rapid sell-off, could lead to a sharp, albeit potentially temporary, reversal. However, without clear bullish divergence or a confirmed break of key resistance, the path of least resistance remains to the downside. Traders should be looking for confirmation signals before initiating new positions, whether long or short. Risk management remains paramount, especially given the potential for sharp moves in either direction as these oversold conditions interact with the strong prevailing trend.
The strength of the daily ADX at 44.59 is a significant factor. It indicates that the current downtrend is not a mere correction but a well-established, powerful move. This implies that any potential bounce is likely to be a retracement within this larger trend, rather than the start of a new bull market. Therefore, short-term traders might look for opportunities to fade rallies, selling into strength near resistance levels, while longer-term investors might wait for more definitive signs of a bottoming process, such as bullish divergence on the daily RSI or MACD, and a confirmed break above significant resistance.
The interplay between central bank policies and market expectations also remains a background driver. While specific Fed actions haven't been the immediate catalyst this week, the ongoing divergence in global monetary policy, as hinted at by forex market movements, contributes to overall market uncertainty. If inflation remains persistent, central banks might be forced to maintain tighter policies for longer, which would continue to be a headwind for equity markets. Conversely, any signs of a dovish pivot or a faster-than-expected easing cycle could spark a risk-on rally, but the current technicals do not support such a scenario yet.
The recent price action on the SP500, closing at $6,536.67, has firmly established a bearish tone. The technical indicators across multiple timeframes overwhelmingly point towards further downside pressure, supported by a strong dollar and ongoing geopolitical concerns. While oversold conditions are present on longer timeframes, they lack the necessary confirmation for a sustained reversal. The key levels to watch are the immediate supports at $6,491.3 and $6,476.4, and resistances at $6,531.7 and $6,557.2. A break below these support levels would likely accelerate the downtrend, while a convincing move above resistance would be needed to signal a potential shift.
Bearish Scenario: Continued Downside Pressure
70% ProbabilityNeutral Scenario: Consolidation and Bounce
20% ProbabilityBullish Scenario: Short-Term Reversal
10% Probability| Indicator | Value | Signal | Interpretation |
|---|---|---|---|
| RSI (14) | 37.71 | Bearish | Nearing oversold, but trend remains down. |
| MACD Histogram | -15.20 | Bearish | Negative momentum persists. |
| Stochastic %K | 21.93 | Bearish | Oversold, but showing potential short-term bounce signal. |
| Stochastic %D | 17.22 | Bearish | Confirms oversold conditions. |
| ADX | 37.97 | Bullish Trend | Strong trend on 1H, confirms bearish momentum. |
| Bollinger Bands | N/A | Neutral | Price below middle band, indicating downtrend. |
Frequently Asked Questions: SP500 Analysis
What happens if the SP500 breaks below the $6,476.4 support level?
A break below $6,476.4 would invalidate any short-term bullish hopes and likely trigger further selling, targeting $6,450.9 as the next significant support level. This would confirm the continuation of the strong bearish trend observed on the daily chart.
Should I consider buying SP500 at current levels around $6,536.67 given the oversold RSI?
Buying solely based on oversold RSI at 37.71 (1H) or 32.35 (4H) is risky, as these levels do not yet show bullish divergence and the ADX indicates a strong trend. A more prudent approach would be to wait for confirmation, such as a hold above $6,476.4 and a move towards resistance at $6,531.7, or wait for clear bullish signals on the daily timeframe.
Is the ADX reading of 44.59 on the daily chart a strong sell signal for SP500?
An ADX of 44.59 signifies a very strong trend, but it measures trend strength, not direction. In this context, it confirms the strength of the prevailing downtrend. While it doesn't initiate a sell order on its own, it validates the bearish sentiment and suggests that the current downward move is robust and likely to continue until trend strength begins to wane.
How might the strengthening DXY at 99.25 impact the SP500's outlook this week?
The rising DXY, currently at 99.25, typically exerts downward pressure on risk assets like the SP500 due to its inverse correlation. This suggests that the dollar's strength may continue to weigh on equity markets, potentially exacerbating the current bearish trend and making it harder for the SP500 to stage a significant recovery without a shift in currency dynamics or broader risk sentiment.
Track markets in real-time
AI-powered analysis, technical indicators and real-time price data.
Join Our Telegram Channel
Breaking market news, AI analysis and trading signals instantly.
Join Channel