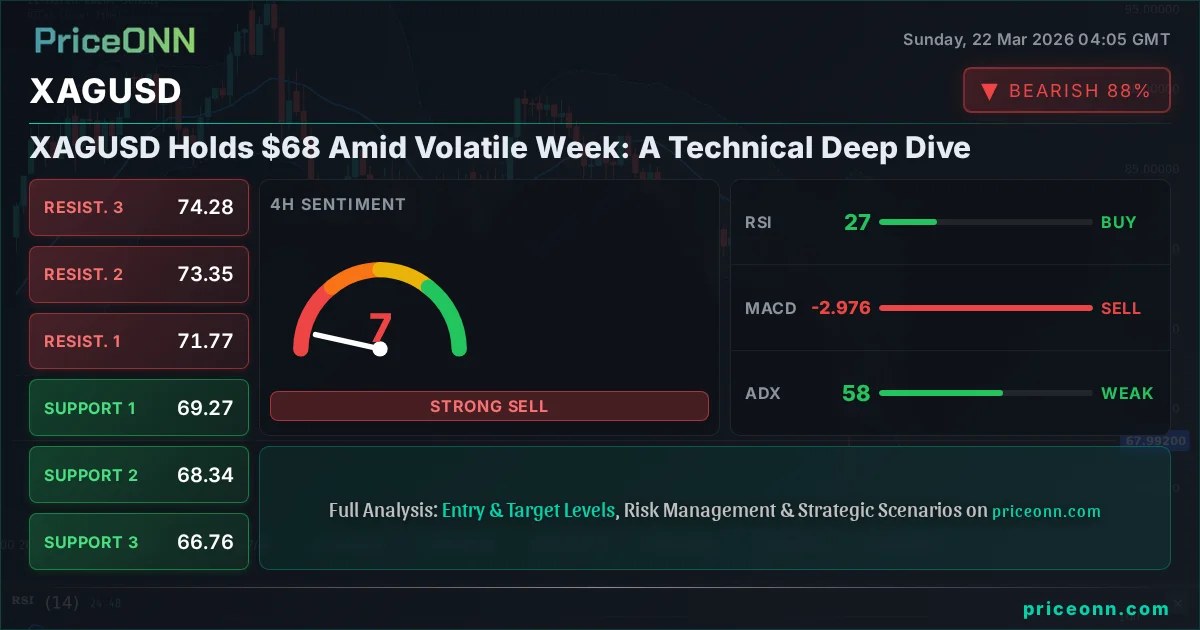
XAGUSD Holds $68 Amid Volatile Week: A Technical Deep Dive
Silver experienced a sharp downturn, testing critical $68 support. Analysis of indicators and key levels reveals the outlook for the coming week.
The financial markets are rarely a calm sea, and last week proved this adage once again for silver traders. Following a period of intense volatility, XAGUSD found itself testing the crucial $68 psychological and technical level. This significant price action occurred within a broader context of market shifts, including a strengthening US Dollar and a risk-off sentiment gripping global equities. Understanding the interplay of these factors, alongside a deep dive into the technical indicators, is paramount for navigating the potential choppy waters ahead. As we dissect the charts and data, we aim to paint a clear picture of what drove silver's recent movements and what levels traders should be watching closely as we move into the new trading week.
- Silver's sharp weekly decline saw XAGUSD test the critical $68 support level, closing the week near this zone.
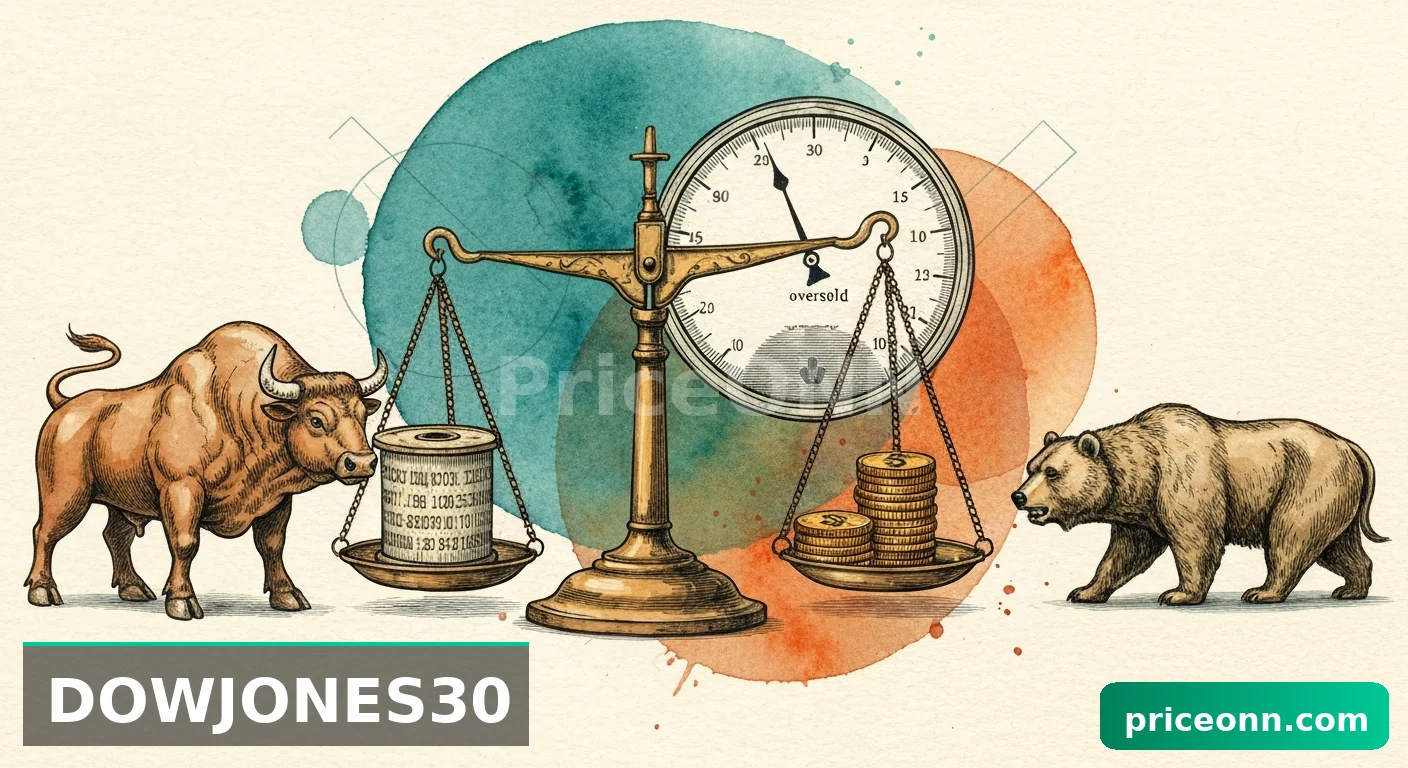
- The 4-hour chart shows a strong downtrend (ADX 57.73) with RSI at 27.35 indicating oversold conditions, potentially signaling a short-term bounce opportunity.
- The Dollar Index (DXY) is showing strength, trading at 99.25, which typically exerts downward pressure on precious metals like silver.
- Key levels to watch: Support at $67.33 and resistance at $69.26 on the 1-hour chart, with broader daily levels at $66.58 (support) and $77.79 (resistance).
Macroeconomic Crosscurrents and Their Impact on Silver
The Dollar's Dominance and Gold's Shadow
Last week was a stark reminder of the enduring correlation between the US Dollar Index (DXY) and silver prices. As the DXY climbed to 99.25, a reflection of underlying strength or perhaps a flight to safety, it simultaneously applied considerable pressure on silver. This inverse relationship is a cornerstone of precious metal analysis. When the dollar strengthens, it makes dollar-denominated assets, like silver, more expensive for holders of other currencies. Furthermore, a stronger dollar often signals a risk-averse environment, which can lead investors to reduce exposure to riskier assets, including commodities that are not directly tied to immediate industrial demand. The DXY's climb, coupled with a general risk-off sentiment seen in the S&P 500's drop to 6536.67, created a challenging backdrop for silver.
The geopolitical landscape also played a role, with ongoing energy market turmoil and broader global uncertainties. While typically seen as a safe-haven asset itself, silver's industrial demand component can sometimes make it more sensitive to economic slowdown fears than gold. The recent attack on Qatar's Ras Laffan energy hub, while primarily impacting energy markets, adds another layer of geopolitical tension that can indirectly influence investor sentiment and currency flows. This complex web of factors – a strong dollar, falling equities, and geopolitical undercurrents – set the stage for the technical breakdown observed in XAGUSD.
Energy Market Turmoil and Inflationary Signals
The energy sector experienced significant price swings last week, with Brent crude oil rising to 112.54 and WTI crude at 98.39. These upward movements in oil prices are often a bellwether for inflation expectations. Higher energy costs ripple through the economy, increasing transportation and production expenses for a wide range of goods and services. This inflationary pressure is a key factor that central banks, particularly the US Federal Reserve, monitor closely. While higher inflation can sometimes support precious metals as an inflation hedge, the immediate impact of rising energy prices, especially when coupled with a strong dollar and risk aversion, can be mixed. In this specific market environment, the dominant narrative appeared to be one of risk reduction, overshadowing silver's traditional role as an inflation hedge. The market seemed more focused on the potential for higher borrowing costs or economic slowdown stemming from persistent inflation, rather than its immediate value as a store of wealth.
This dynamic highlights the nuanced role of inflation in the current market. While silver historically performs well in inflationary periods, its price action last week suggests that other forces were at play. The aggressive sell-off in XAGUSD, despite elevated oil prices, indicates that the market was prioritizing the immediate strength of the dollar and the broader risk-off sentiment. This is a critical observation for traders: the 'usual' correlations can sometimes break down when extreme sentiment or specific macro drivers take precedence. The narrative around energy abundance being shattered, as suggested by recent news, could also imply sustained upward pressure on energy prices, which in turn could keep inflation concerns elevated, but the immediate market reaction for silver was bearish.
XAGUSD: A Technical Breakdown on Multiple Timeframes
The 1-Hour Chart: Immediate Pressure and Oversold Signals
Turning our attention to the 1-hour chart for XAGUSD, the picture is one of clear bearish momentum. The trend is overwhelmingly downwards, with a strength of 98%. This is corroborated by key indicators. The RSI(14) stands at 30.79, hovering in neutral territory but showing a downward inclination, suggesting that while oversold conditions are approaching, the selling pressure is still dominant. The MACD is firmly below its signal line, indicating negative momentum that has persisted throughout the recent price action. Bollinger Bands are also showing the price trading below the middle band, a classic sign of bearish pressure. Stochastic oscillators are deep in oversold territory (K: 13.94, D: 13.99), suggesting that a short-term bounce might be on the cards, but the ADX at 31.58 confirms a strong existing downtrend. The overall signal from the 1-hour timeframe is a strong 'SELL', reflecting the immediate selling pressure observed.
Crucially, the immediate support level to watch on this timeframe is $67.33, followed by $66.59. On the upside, resistance is eyed at $69.26. A break above $69.26 would be the first sign of a potential short-term reversal, but given the broader trend and other timeframes, such a move would need significant follow-through to be considered sustainable. The price closing below $67.33 would confirm further downside, potentially targeting the next support at $65.40. The current price of $68.00 sits precariously between these immediate levels, highlighting the tight range and the potential for sharp moves in either direction based on intraday catalysts.
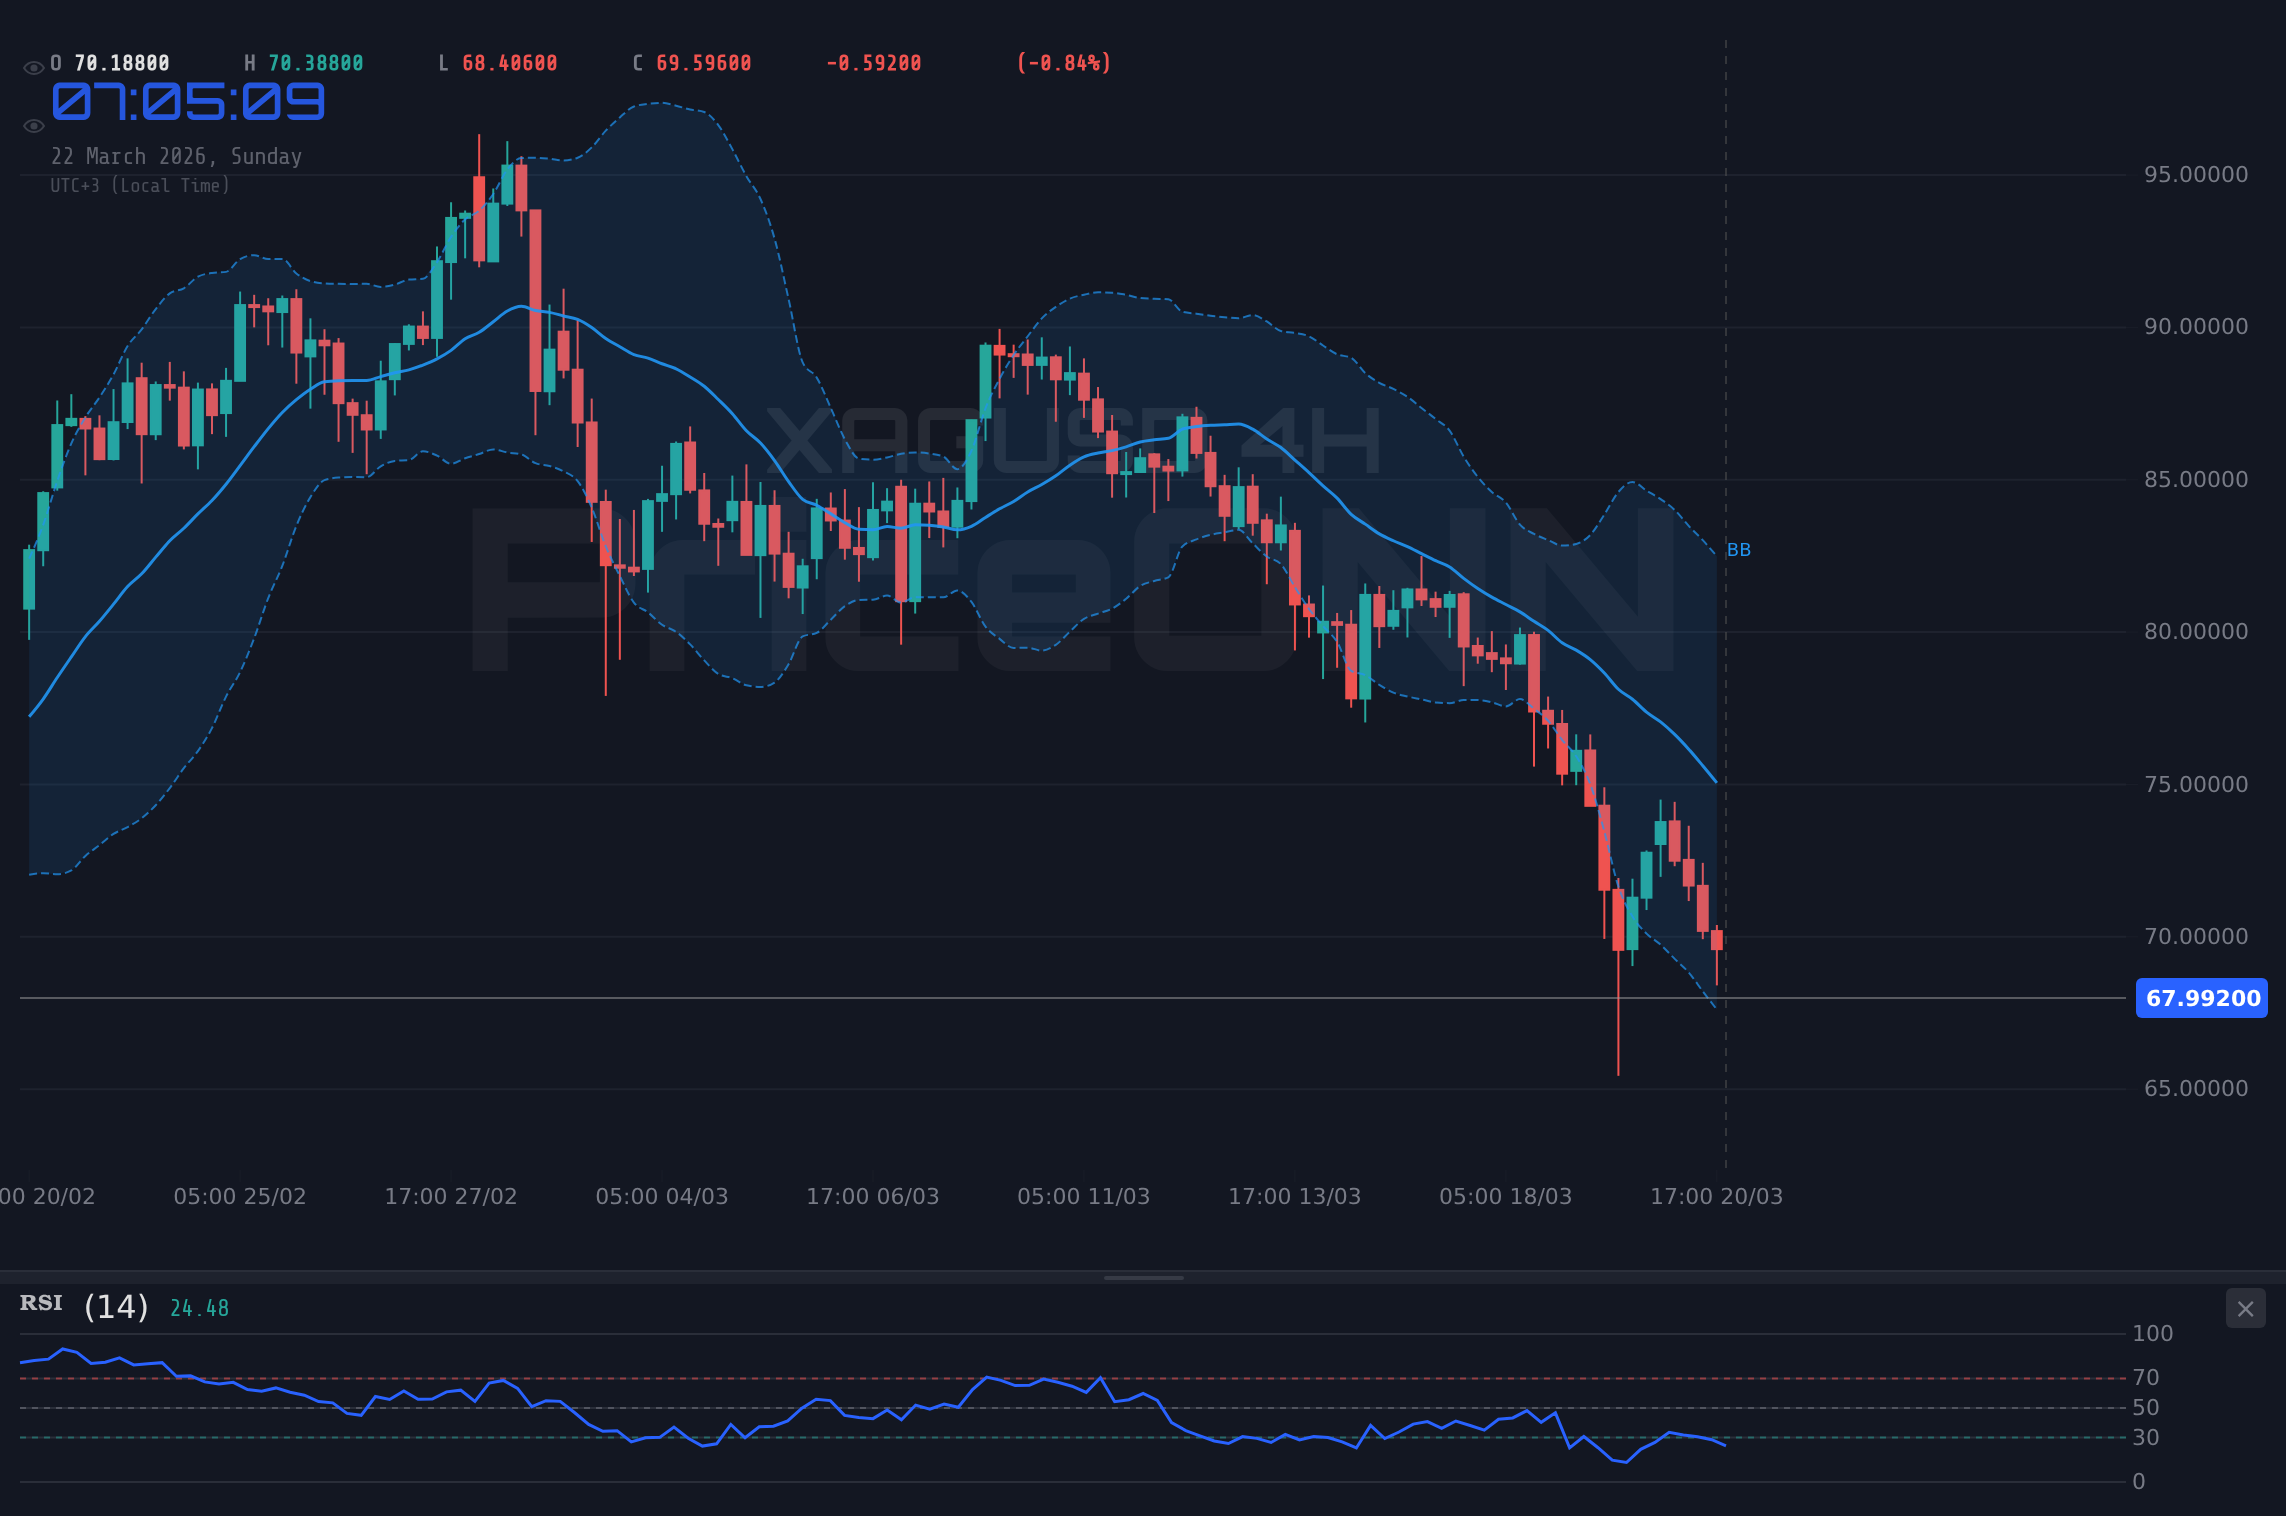
The 4-Hour Chart: Confirming the Bearish Trend
Expanding the view to the 4-hour chart reinforces the bearish sentiment observed on the shorter timeframe. Here, the trend is unequivocally 'Düşüş' (Downtrend) with a strength of 100%. The RSI(14) at 19.3 is deeply oversold, far more so than on the 1-hour chart. This extreme reading suggests that the market may be technically due for a bounce, but it doesn't negate the underlying trend. The MACD remains negative, and the Stochastic oscillators (K: 25.57, D: 34.97) show a clear bearish signal with %K below %D, though also moving out of extreme oversold territory. The ADX value here is particularly striking at 62.89, indicating an exceptionally strong downtrend. This is not a market exhibiting weak selling; it is a market where sellers are firmly in control.
On the 4-hour chart, key support levels are identified at $69.27, $68.34, and $66.76. Resistance is seen at $71.77, $73.35, and $74.28. The fact that the current price of $68.00 is hovering just above the $67.33 support (from the 1H chart) and approaching the $66.76 support on the 4H chart emphasizes the critical juncture silver is at. A break below $66.76 on this timeframe would signal a significant acceleration of the downtrend, potentially opening the door for much lower prices. The confluence of strong bearish signals across indicators, coupled with the robust ADX reading, suggests that any upward movement is likely to be met with significant selling pressure until proven otherwise by a sustained break of key resistance levels.
The Daily Chart: A Neutral Trend Under Pressure
The daily chart presents a slightly different, yet still concerning, picture. While the overall trend is categorized as 'Neutral' (50% strength), this neutrality is occurring within the context of a broader downtrend and significant selling pressure observed on shorter timeframes. The RSI(14) at 29.67 is in the oversold zone, similar to the 1-hour chart, indicating potential for a relief rally. The MACD is negative, and the Stochastic oscillators (K: 8.67, D: 13.12) are deeply oversold, suggesting that the selling may be extended. However, the ADX at 19.51 indicates a weak trend on the daily timeframe, implying that the market is currently in a consolidation phase or that the strong downtrend observed on shorter timeframes is not yet fully reflected in the daily perspective. This could mean that the current price action is a temporary pause before a further move or that the daily chart is lagging behind the more dynamic shorter-term trends.
The daily support levels are more substantial: $66.58, $60.41, and $55.38. Resistance is much higher up at $77.79, $82.82, and $89.00. The fact that the current price of $68.00 is below the 1-hour resistance of $69.26 and above the 4-hour support of $66.76 places it in a critical zone. The daily chart's oversold indicators coupled with a weak trend reading could suggest that the market is poised for a bounce, but this would need to overcome the strong bearish momentum seen on the 1-hour and 4-hour charts. The 'SAT' (SELL) signal on the daily timeframe (Al: 3, Sat: 5, Nötr: 0) suggests that the majority of technical indicators are leaning towards further downside, despite the oversold readings.
Trade Scenarios: Navigating the $68 Level
Bearish Scenario: Breakdown Below Key Support
The most immediate threat for silver is a sustained breakdown below the $68.00 mark. Given the strong downtrend on the 1-hour and 4-hour charts, confirmed by ADX readings above 30 and extremely oversold RSI levels, sellers are clearly in control. If the price fails to find significant buying interest around the current levels and breaks decisively below the $67.33 support on the 1-hour chart, the probability of a further slide increases significantly. This bearish scenario is further supported by the overall 'SELL' signals dominating the shorter timeframes. The market sentiment, driven by a strong dollar and risk aversion, provides a conducive environment for such a move. A break below $67.33 would likely trigger stop-loss orders, accelerating the price decline towards the next key support levels identified on the 4-hour chart.
Neutral Scenario: Consolidation Around $68
While the short-term charts scream 'sell', the daily chart's weak ADX and oversold RSI present a case for a potential consolidation phase. The $68.00 level has historically acted as a significant psychological barrier, and it's possible that the market will pause here to digest recent losses. This neutral scenario suggests that silver might trade within a defined range for a period, perhaps between the 1-hour resistance at $69.26 and the 4-hour support at $66.76. Such consolidation could be driven by a temporary cooling of the dollar's strength, a slight uptick in risk appetite, or simply a lack of conviction from either buyers or sellers to make a decisive move. During this phase, indicators might oscillate, with RSI moving back towards the 50 level and MACD histograms showing less conviction. This period of indecision could set the stage for a larger move, but for now, it represents a holding pattern.
Bullish Scenario: A Relief Rally from Oversold Conditions
The most optimistic outlook for silver involves a relief rally stemming from the deeply oversold conditions observed across multiple timeframes. The RSI readings below 30 on the 1-hour and daily charts, and below 20 on the 4-hour chart, are strong technical signals for a potential short-term bounce. If the US Dollar were to weaken unexpectedly, or if geopolitical tensions were to ease, creating a more positive risk sentiment, silver could find buyers stepping in. A decisive break and hold above the 1-hour resistance at $69.26 would be the first confirmation of this bullish scenario. This could potentially lead to a test of the next resistance at $70.45. However, given the overwhelming bearish technicals on the 4-hour chart (ADX 62.89) and the dominant 'SELL' signals, this bullish scenario appears to be the least probable in the immediate short term. It would require significant external catalysts or a dramatic shift in market sentiment to materialize fully.
Bearish Scenario: Sellers Retake Control
70% ProbabilityNeutral Scenario: Range-Bound Play Around $68
25% ProbabilityBullish Scenario: Oversold Bounce
5% ProbabilityKey Levels and What They Mean
Navigating Support and Resistance
The $68.00 level for XAGUSD is more than just a number; it's a battleground where buyers and sellers are currently locked in a tense standoff. On the 1-hour timeframe, immediate support is seen at $67.33, with further levels at $66.59 and $65.40. Resistance looms at $69.26, $70.45, and $71.18. These levels are critical because they represent price points where significant buying or selling interest has historically emerged. A break below $67.33 would likely confirm the continuation of the bearish trend observed on shorter timeframes, potentially leading to a swift move towards $66.59. Conversely, a sustained push above $69.26 could signal the beginning of a short-term recovery, but would need to overcome the stronger bearish signals from the 4-hour chart.
The 4-hour chart presents a more formidable picture, with support at $69.27, $68.34, and $66.76. Resistance is higher, at $71.77, $73.35, and $74.28. The current price of $68.00 is teetering just above the $66.76 support level on this timeframe, making it a pivotal point. A failure to hold this level could see a rapid decline towards $60.41, a significant support on the daily chart. On the daily chart, the key support is established at $66.58, followed by $60.41 and $55.38. Resistance on the daily chart is much further afield, starting at $77.79. The proximity of the current price to these multiple support levels across different timeframes underscores the importance of the $68.00 area. Traders will be closely watching how price reacts to these levels in the coming days; a failure to hold $68.00 could initiate a cascade towards lower supports, while a bounce could signal a temporary reprieve.
Market Sentiment and Trader Psychology
The Fear and Greed Index: A Barometer of Sentiment
While not explicitly provided in the market data, understanding market sentiment is crucial. The extreme oversold conditions indicated by RSI and Stochastic oscillators suggest that fear might be prevailing among traders. When fear dominates, markets often experience irrational selling, pushing prices lower than fundamentals might dictate. This is precisely what we observed with the sharp drop in XAGUSD. However, extreme fear can also be a contrarian indicator, signaling that a potential bottom is near. The question for traders is whether this fear will persist, driven by macro factors like a strong dollar and geopolitical uncertainty, or if the oversold technicals will eventually trigger a buying spree. The fact that the ADX remains high on shorter timeframes suggests that the bearish trend is still strong, implying that fear is currently winning out over any potential greed for a bounce.
The Role of Volatility and Trading Signals
The volatility in silver last week was significant, with the price experiencing sharp swings and the daily range on the 1H chart being quite wide ($67.65 - $74.50). This level of volatility can be both a challenge and an opportunity. For short-term traders, it presents opportunities for quick gains, but it also increases the risk of stop-outs and rapid reversals. The overall 'SELL' signal across the 1-hour and 4-hour timeframes, despite the oversold conditions, suggests a dominant bearish sentiment. However, the 'BUY' signals on the 1-hour Stochastic and the daily timeframe's weak ADX indicate conflicting signals within the market. This divergence is where careful risk management and precise entry/exit strategies become paramount. Relying solely on one indicator can be misleading; a holistic view across multiple timeframes and indicators, combined with an understanding of the macro environment, is essential for making informed trading decisions.
The PriceONN market news from last week, highlighting the sharp plunge in silver prices and testing of levels below $70, directly reflects the bearish sentiment we've analyzed. Reports of billions wiped off mining stocks further underscore the broad-based impact of this sell-off. While some reports mention silver recovering towards $74, the dominant narrative and technical picture suggest that this was likely a temporary bounce within a larger downtrend, or an attempt to consolidate around key levels. The question of whether Santacruz Silver Mining (SCZM) is oversold at $6.90, with technical indicators signaling a potential reversal, is an interesting micro-level observation but does not negate the broader bearish trend for XAGUSD itself. The current price of $68.00 remains the focal point, with the market seemingly waiting for a catalyst to break decisively in either direction.
FAQ Section: Your XAGUSD Questions Answered
Frequently Asked Questions: XAGUSD Analysis
What happens if XAGUSD breaks below $67.33 support?
If XAGUSD breaks decisively below the $67.33 support on the 1-hour chart, it would confirm the continuation of the strong bearish trend observed across multiple timeframes. This could trigger further selling, potentially leading to a rapid decline towards the next support level at $66.59, and possibly extending towards $65.40.
Should I buy XAGUSD at current levels around $68.00 given the oversold RSI?
Buying solely based on oversold RSI at $68.00 carries significant risk due to the strong bearish trend (ADX 62.89 on 4H). While a short-term bounce is possible, a more prudent approach would be to wait for confirmation, such as a hold above $69.26 resistance, or a clear bullish divergence across multiple timeframes. Risk management is key; consider entering only if the price breaks key resistance with conviction.
Is the ADX at 57.73 a strong sell signal for XAGUSD on the 4-hour chart?
An ADX reading of 57.73 on the 4-hour chart indicates an exceptionally strong trend, in this case, a downtrend. While not a direct 'sell' signal itself, it confirms the dominance of the current bearish momentum. This means that any counter-trend trades (buys) are against a very powerful force, and are likely to fail unless accompanied by strong bullish confirmation or a significant shift in macro conditions.
How will the strong DXY at 99.25 affect XAGUSD this week?
The current strength of the US Dollar Index (DXY) at 99.25 typically exerts downward pressure on silver prices (XAGUSD). A stronger dollar makes silver more expensive for holders of other currencies and often correlates with a risk-off sentiment, which can dampen demand for commodities. Therefore, continued DXY strength could pose a significant headwind for any potential silver rallies this week.
The Path Forward: Strategy and Outlook
Managing Risk in a Volatile Market
The technical picture for XAGUSD remains predominantly bearish, particularly on the 4-hour and 1-hour charts. The strong downtrend, confirmed by high ADX values and oversold RSI and Stochastic indicators, suggests that further downside is possible. However, the extreme oversold readings also hint at the potential for a short-term bounce or consolidation. For traders, this environment calls for strict risk management. Entry decisions should be guided by clear price action confirmation at key levels rather than attempting to catch a falling knife. The $68.00 level is critical; a hold here could lead to a bounce towards $69.26, while a break below it could open the door to $66.76 and lower. The overarching influence of the DXY at 99.25 and the general risk-off sentiment cannot be ignored and will likely continue to weigh on silver prices.
The market is at a crucial juncture. While the aggressive selling pressure has pushed silver into oversold territory, the underlying trend remains firmly down. Any bullish case hinges on a significant shift in macro sentiment or a confirmed technical breakout above key resistance levels, starting with $69.26. Until then, caution is advised. Traders should focus on managing their risk exposure, waiting for clear setups, and avoiding premature entries. The potential for a bounce from current oversold levels exists, but it is currently outweighed by the strong bearish momentum and macro headwinds. Patience and discipline will be rewarded as the market eventually provides clearer direction.
Technical Outlook Summary
| Indicator | Value | Signal | Interpretation |
|---|---|---|---|
| RSI (14) | 29.67 | Oversold | Potential for bounce, but trend is strong |
| MACD Histogram | -15.20 | Negative Momentum | Sellers are in control |
| Stochastic | 8.67 | Oversold | Extreme selling, potential reversal candidate |
| ADX | 19.51 | Weak Trend | Daily trend is weak, shorter timeframes show strength |
| Bollinger | Lower Band | Breakdown | Price below lower band suggests oversold or breakdown |
Key Levels
Support Levels
Resistance Levels
Track markets in real-time
AI-powered analysis, technical indicators and real-time price data.
Join Our Telegram Channel
Breaking market news, AI analysis and trading signals instantly.
Join Channel