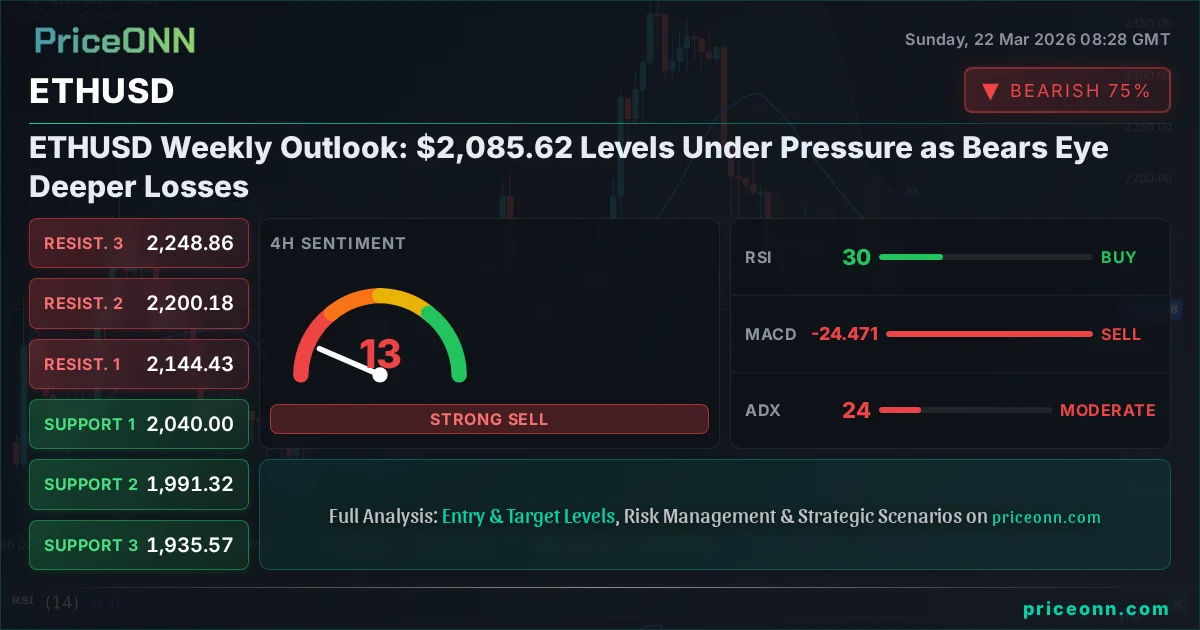
ETHUSD Weekly Outlook: $2,085.62 Levels Under Pressure as Bears Eye Deeper Losses
ETHUSD trading at $2,085.62 faces bearish pressure. Key support at $2,040.00 tested as RSI dips to 31.19 on 4H.
The past week for ETHUSD has been a tale of consolidation and cautious indecision, with the price hovering precariously around the $2,085.62 mark. While the weekly close failed to provide a decisive directional bias, the underlying technical indicators and the broader market sentiment suggest that the bears may be gaining a subtle but significant advantage. This subdued trading activity, characterized by a lack of strong conviction from either side, sets the stage for a potentially volatile period ahead as key support and resistance levels are closely watched by traders and investors alike. The question on everyone's mind is whether the current equilibrium will hold, or if a catalyst will emerge to break the stalemate and trigger a more substantial price movement.
- ETHUSD is currently trading around $2,085.62, with a flat week indicating indecision.
- Bearish sentiment is subtly growing, with 4H RSI at 31.19 and MACD showing negative momentum.
- Key support levels to watch are $2,040.00 (S1), $1,991.32 (S2), and $1,935.57 (S3).
- Resistance remains at $2,144.43 (R1), $2,200.18 (R2), and $2,248.86 (R3).
- A break below $2,040.00 could signal a deeper correction, while a sustained move above $2,144.43 is needed to regain bullish control.
The crypto market, often characterized by its rapid shifts and dramatic price swings, has experienced a relatively muted period for Ethereum (ETHUSD) over the last seven days. Trading primarily between a tight range, ETHUSD has failed to establish a clear upward or downward trajectory, leaving many market participants on the sidelines. This lack of decisive action, however, does not mean the market is without its underlying tensions. Beneath the surface, a battle is being waged between bulls attempting to defend key psychological levels and bears probing for weaknesses to initiate a more significant downtrend. The current price of $2,085.62 represents a critical juncture, a point where the market's next significant move could be determined by a confluence of technical signals and external macroeconomic factors.
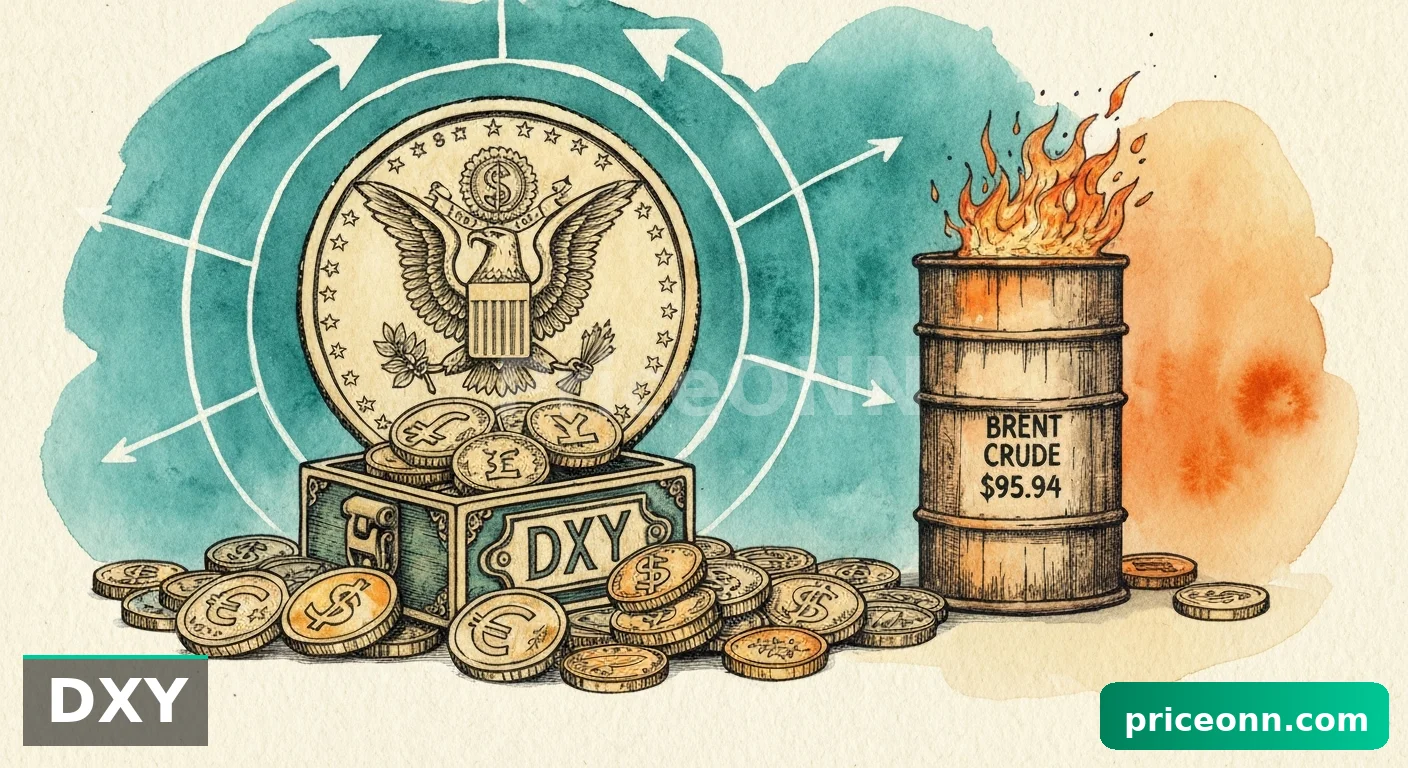
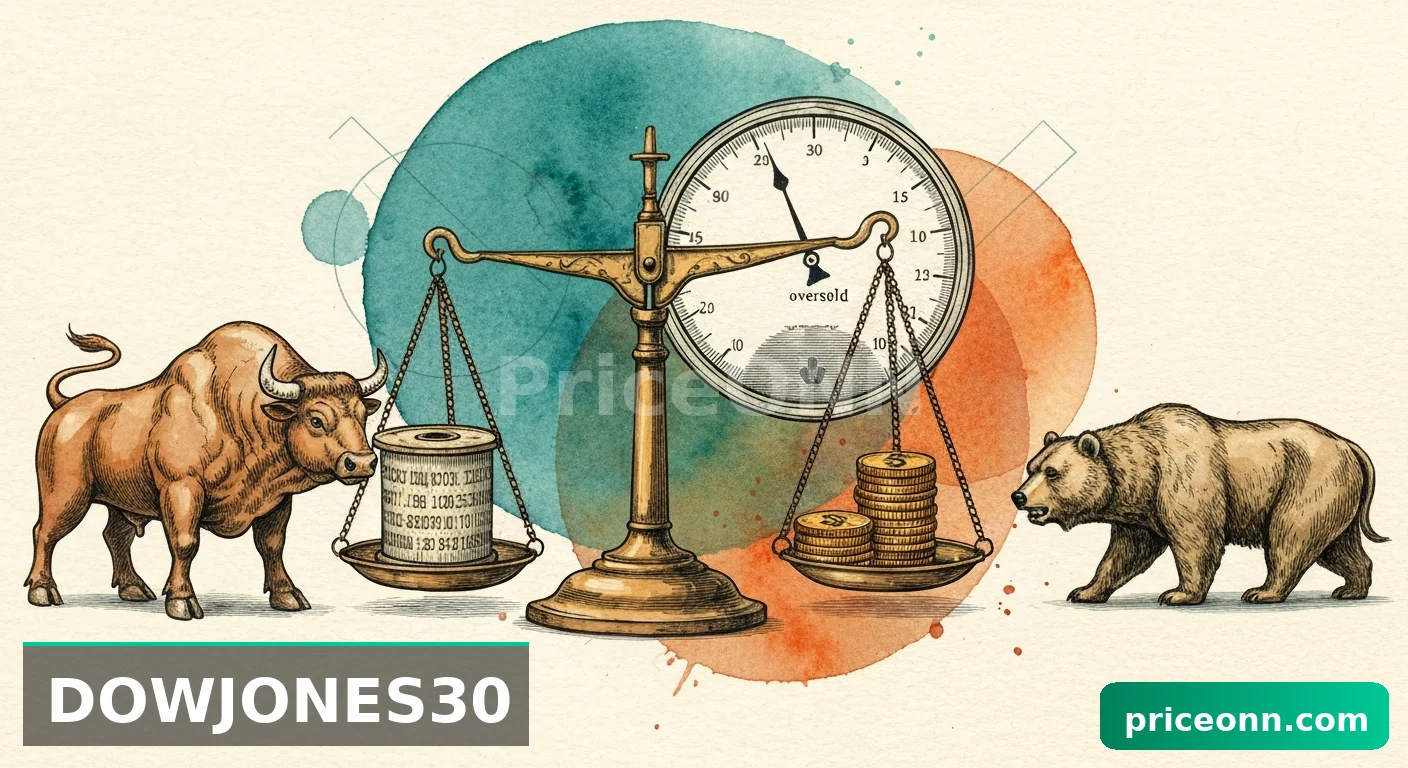
Looking at the broader market context, the recent performance of major indices like the S&P 500 and Nasdaq, which have seen declines of -1.2% and -1.67% respectively in their 1-hour charts, indicates a general risk-off sentiment. This is often correlated with a weakening demand for riskier assets, including cryptocurrencies. Simultaneously, the Dollar Index (DXY) has shown strength, rising 0.35% on its 1-hour chart and signaling a potential headwind for assets typically priced in USD. This interplay between risk appetite, the strength of the US dollar, and the specific technical setup of ETHUSD itself will be crucial in shaping its price action in the coming days and weeks. The energy sector, with Brent crude oil showing a strong upward trend (4.58% daily change on its 1H chart), adds another layer of complexity, potentially influencing inflation expectations and, by extension, central bank policy outlooks, which are always a significant factor for digital assets.
The technical landscape for ETHUSD on the 1-hour timeframe reveals a market in a precarious state. While the overall trend is classified as bearish with a strength of 88%, the immediate price action around $2,085.62 suggests a temporary pause in the selling pressure. The Relative Strength Index (RSI) at 30.2 hovers in neutral territory but leans towards oversold conditions, hinting that immediate downside momentum might be waning. However, the MACD remains firmly in negative territory, with its signal line below the zero line, indicating persistent bearish momentum. The Stochastic Oscillator, with %K at 38.1 and %D at 42.07, is also signaling a potential short-term bounce as %K is below %D but not yet in extreme oversold territory. The ADX at 26.23 confirms a moderately strong downtrend, suggesting that any rallies might be short-lived without significant fundamental catalysts.
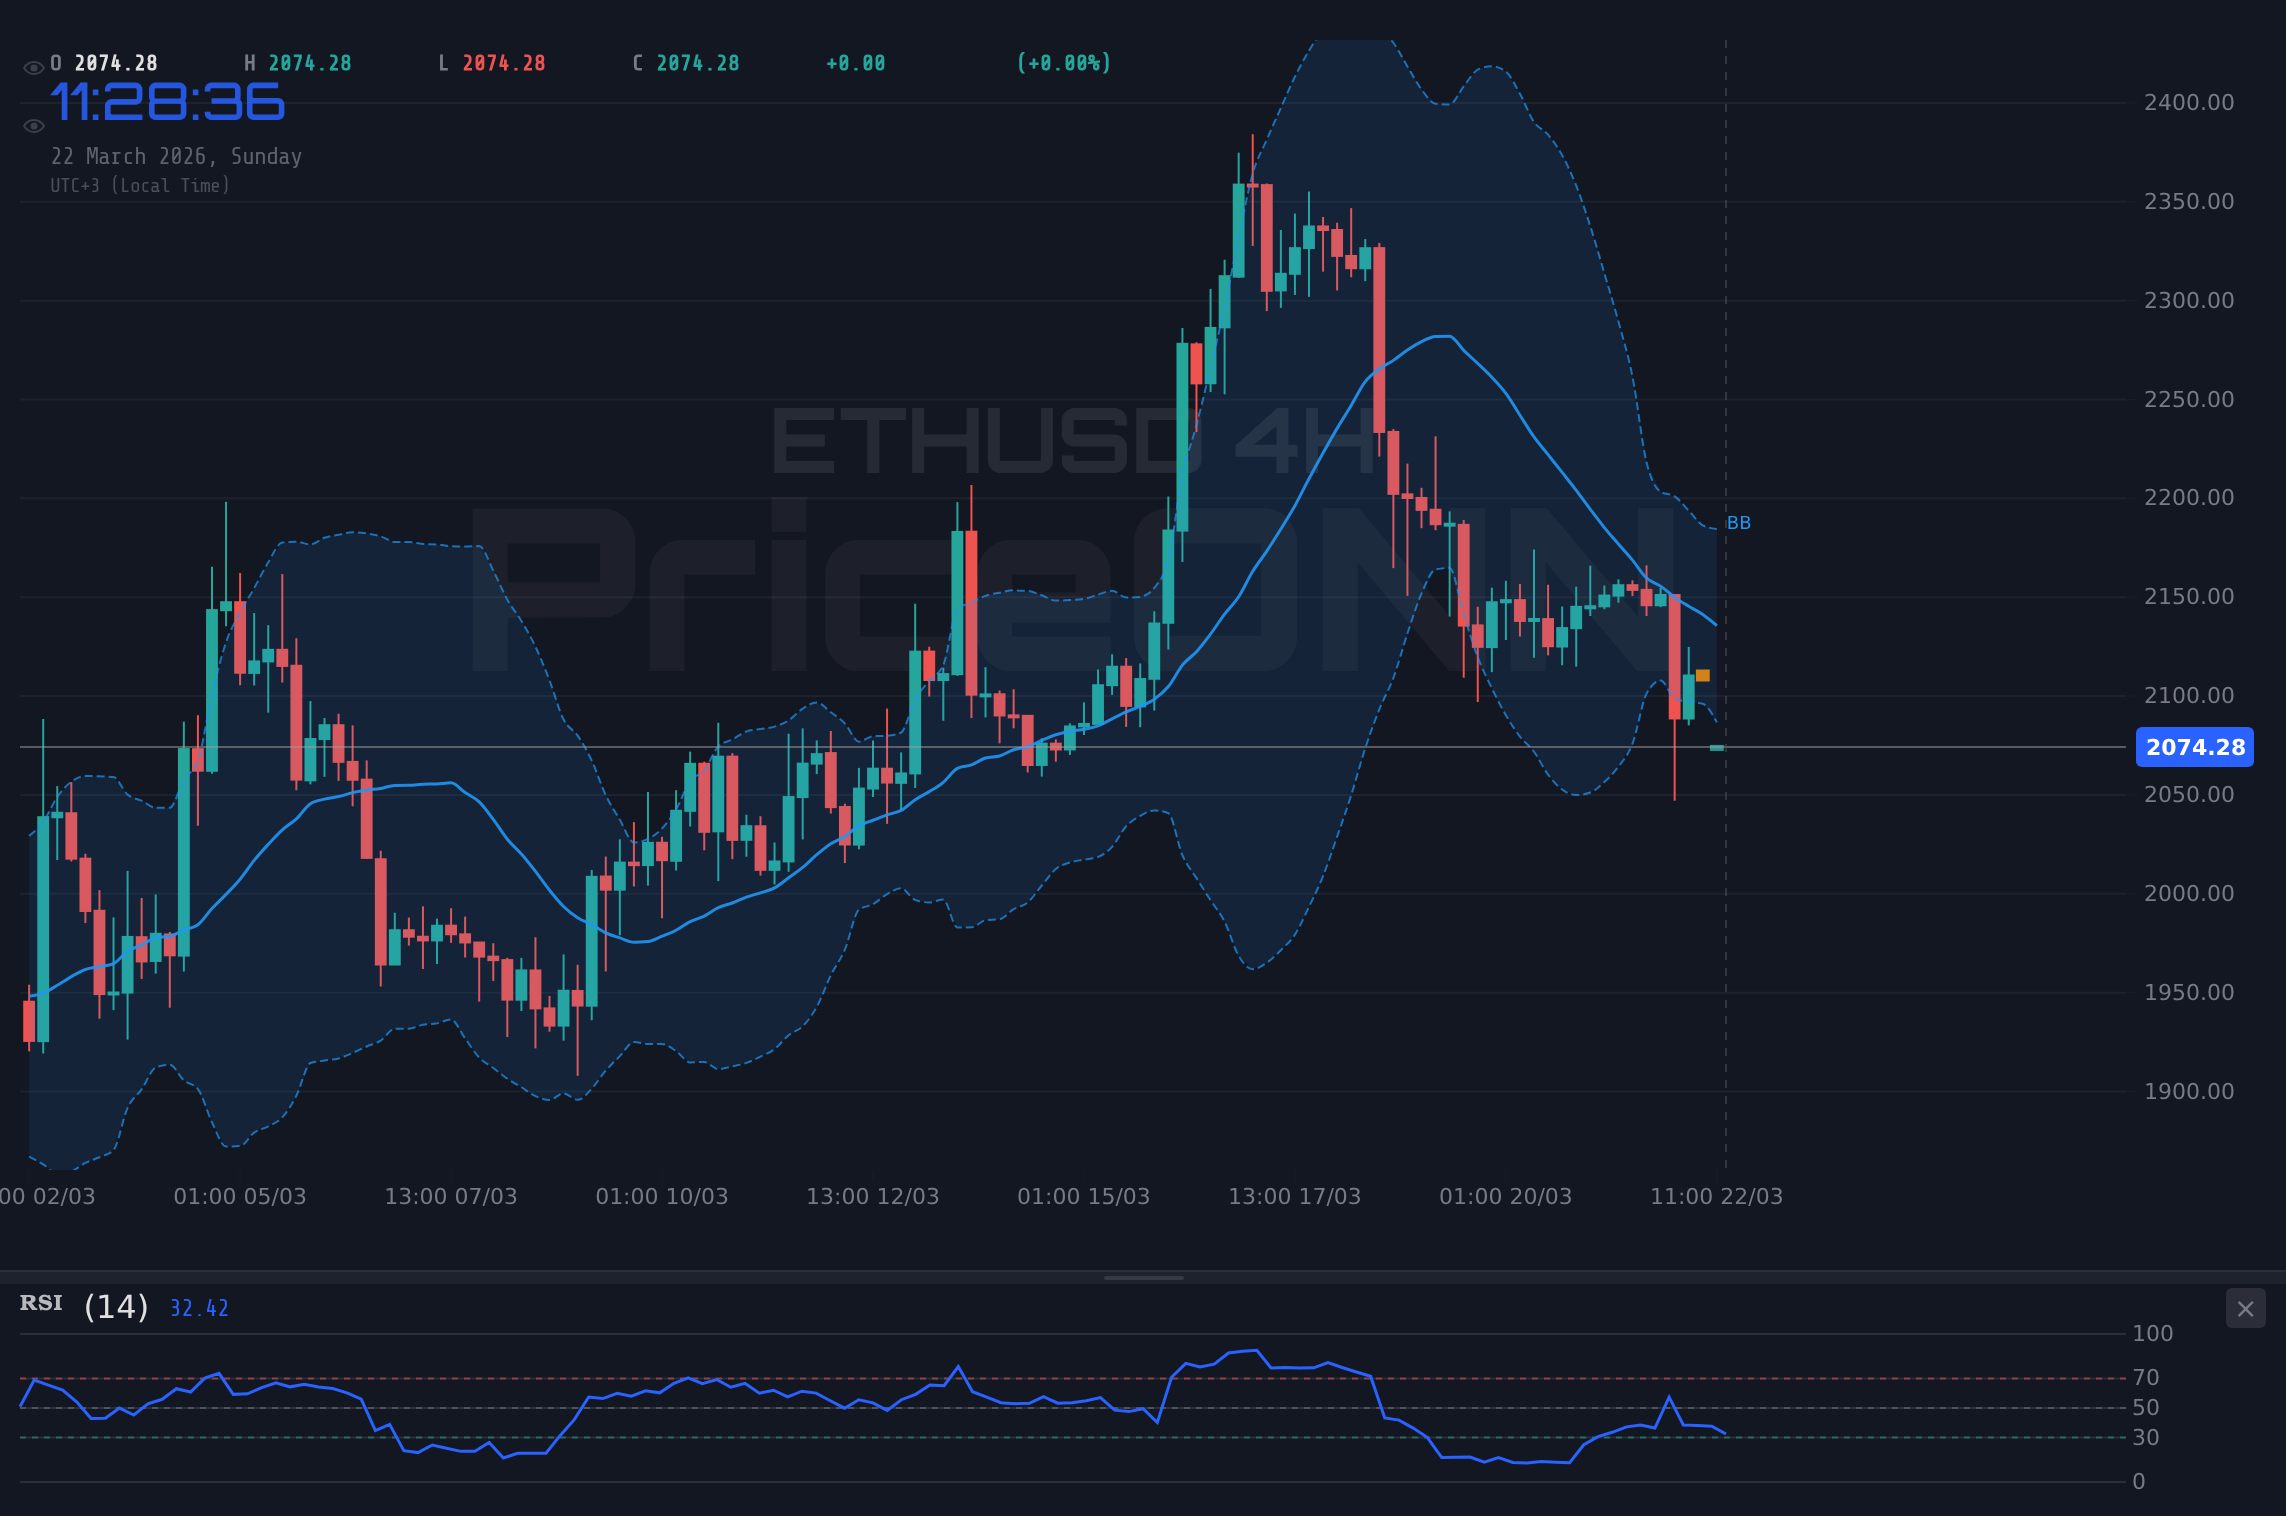
On the 4-hour chart, the picture becomes more concerning for the bulls. The trend is neutral with 50% strength, but this neutrality is underpinned by significant bearish signals. The RSI at 31.19 is firmly in the oversold region, suggesting that sellers might be exhausted in the short term, but it also indicates a lack of buying interest. The MACD continues to paint a bearish scenario, with negative momentum and its signal line below the zero axis. The Stochastic Oscillator, with %K at 34.49 and %D at 54.15, continues to show a downward bias, with %K below %D and far from overbought levels. The ADX at 29.79 indicates a strong downtrend, reinforcing the bearish outlook. The Bollinger Bands are also showing price trading below the lower band, a sign of extreme bearish pressure or a potential reversal if buying pressure emerges.
The Battle for $2,040: A Critical Support Level
The 4-hour timeframe highlights the significance of the $2,040.00 support level. This is not just a random number; it represents a confluence of previous price action and a psychological benchmark. A decisive break below this level would invalidate any lingering hopes for a near-term recovery and could trigger a cascade of stop-loss orders, accelerating the descent towards the next support at $1,991.32. The bears are clearly aiming to breach this threshold, and their success would signal a continuation of the broader downtrend observed across multiple timeframes. Conversely, for the bulls to regain any semblance of control, they must not only defend $2,040.00 but also engineer a sustained move back above the $2,144.43 resistance. The current market data suggests that the path of least resistance is downwards, making the defense of $2,040.00 a paramount task for the bulls.
The daily chart offers a longer-term perspective, and here the picture is equally, if not more, challenging for Ethereum. The trend is classified as neutral with 50% strength, but this neutrality is deceptive. The RSI at 47.89 is in the neutral zone but trending downwards, suggesting a potential for further decline. The MACD, while showing positive momentum on the daily chart, is still below its signal line, indicating that the bearish sentiment is still dominant in the longer term. The Stochastic Oscillator, with %K at 25.37 and %D at 54.93, is showing a bearish crossover, with %K below %D, hinting at further downside potential. The ADX at 22.31 suggests a moderate uptrend, which is somewhat contradictory to the other indicators, pointing towards a lack of strong directional conviction on the daily timeframe. However, the Bollinger Bands are positioned below the middle band, indicating a bearish bias.
The prevailing market sentiment, as reflected in the general trend direction across different timeframes, is predominantly bearish for ETHUSD. The 1-hour chart shows a strong bearish trend (91% strength), the 4-hour chart displays a very strong bearish trend (100% strength), and the daily chart indicates a neutral trend with 50% strength but with significant bearish undertones. This consistent bearish signal across shorter and medium timeframes suggests that the recent price action around $2,085.62 is more of a pause than a reversal. The ADX values, particularly the 62.89 on the 4-hour chart, scream 'strong trend,' emphasizing the prevailing downward momentum. Traders are therefore advised to approach any potential upside movements with extreme caution, looking for confirmation before considering bullish positions.
The current price of $2,085.62 for ETHUSD is sitting just above the first critical support level identified at $2,040.00 on the 1-hour chart. The daily support levels are further down, with S1 at $1,935.57, S2 at $1,888.91, and S3 at $1,829.22. These are the levels that bulls will need to defend if the selling pressure intensches. On the resistance side, the immediate hurdle is at $2,144.43 on the 1-hour chart, followed by $2,200.18 and $2,248.86. These resistance levels will need to be convincingly broken to signal a potential shift in market sentiment towards a more bullish outlook. The current price is trapped between these significant levels, creating a volatile environment where a breakout in either direction could lead to rapid price discovery.
Examining the leading indicators provides further insight into the current market dynamics. The RSI(14) on the 4-hour chart sits at 31.19, just above the oversold threshold of 30. This suggests that while selling pressure has been intense, there might be limited room for further immediate downside without a fresh catalyst. However, the ADX at 62.89 on the same timeframe is a stark warning; it signifies an extremely strong downtrend, meaning that even oversold conditions might persist for longer than usual. The MACD histogram is deeply negative, and the Stochastic Oscillator's %K line at 34.49 and %D line at 54.15 continue to signal a bearish bias, with %K below %D. These indicators collectively paint a picture of a market under significant bearish control, where any bounces are likely to be met with selling pressure.
The daily chart's technical indicators offer a longer-term perspective, and they do not paint a significantly brighter picture. The RSI(14) is at 47.89, hovering in neutral territory but leaning towards a bearish bias as it has been trending downwards. The MACD on the daily timeframe is positive but below its signal line, which is a bearish signal in the context of a longer-term trend. The Stochastic Oscillator shows %K at 25.37 and %D at 54.93, indicating a bearish crossover and further potential downside. The ADX at 22.31 suggests a moderate trend, which, while not as strong as on the 4-hour chart, still indicates that the market is not in a strong sideways chop, but rather trending, albeit with less conviction than on shorter timeframes. This combination of indicators suggests that the current price levels around $2,085.62 are not a stable base for a significant rally.
The correlation with the broader market environment cannot be overstated. The strength in the Dollar Index (DXY), which has seen a 0.35% rise on its 1-hour chart, typically exerts downward pressure on risk assets like ETHUSD. A stronger dollar makes USD-denominated assets more expensive for holders of other currencies, potentially reducing demand. Furthermore, the weakness observed in major equity indices such as the S&P 500 and Nasdaq suggests a general risk-off sentiment pervading financial markets. This environment is not conducive to speculative assets like cryptocurrencies, which tend to suffer when investors rotate towards safer havens or less volatile assets. The energy sector's upward trend, while potentially indicative of inflationary pressures, adds another layer of complexity, as persistent inflation could influence central bank monetary policy, impacting interest rate expectations and, consequently, risk asset valuations.
Considering the economic calendar, while specific high-impact events for the immediate week are not detailed here, it is crucial to remember that macroeconomic data releases and central bank commentary can act as significant catalysts. Any indication from the Federal Reserve regarding future monetary policy – whether it be a hawkish stance reinforcing higher-for-longer interest rates or a dovish pivot signaling potential rate cuts – could dramatically influence ETHUSD's price. Similarly, major economic data releases from the US, such as inflation reports (CPI, PCE) or employment figures (NFP), can trigger significant volatility across all markets, including cryptocurrencies. Traders must remain vigilant for any news that could shift market expectations regarding interest rates and economic growth, as these are fundamental drivers for asset pricing.
The price action around $2,085.62 is critical. It represents a tight range where both bulls and bears are fighting for control. The previous week saw ETHUSD consolidate, failing to break decisively above resistance or below support. This lack of resolution suggests that the market is digesting recent information and waiting for a clearer signal. The interplay between the strong bearish signals on the 4-hour chart and the more neutral, yet still cautious, outlook on the daily chart creates a complex trading environment. It highlights the importance of adhering to risk management principles and waiting for clear confirmation before committing to significant positions.
Given the current technical indicators and market sentiment, the probabilities lean towards a bearish continuation, but the possibility of a bounce from oversold conditions cannot be entirely dismissed. The $2,040.00 support level is the immediate focal point. A failure to hold this level would likely accelerate the decline. Conversely, a strong rebound from this area, coupled with a break above the immediate resistance at $2,144.43, would be necessary to invalidate the bearish thesis and signal a potential shift in momentum. Until then, caution remains the watchword for ETHUSD traders.
The current market structure suggests that ETHUSD is in a consolidation phase within a broader downtrend. The lack of strong bullish conviction despite oversold indicators on shorter timeframes indicates underlying weakness. The key levels to watch remain $2,040.00 for support and $2,144.43 for resistance. A decisive move outside of this range, supported by increased volume and clear technical confirmation, will likely dictate the next significant price direction. Until then, traders should anticipate choppy price action and prioritize risk management.
Navigating the $2,085.62 Crossroads: Scenarios for ETHUSD
The current technical setup for ETHUSD presents a classic scenario where market participants are weighing conflicting signals and key levels. The price action around $2,085.62, coupled with the indicators discussed, suggests a period of heightened uncertainty. To navigate this environment effectively, it's crucial to outline potential scenarios based on how key levels and indicators might play out in the coming days.
Bearish Scenario: Break Below Key Support
65% ProbabilityNeutral Scenario: Range-Bound Consolidation Continues
25% ProbabilityBullish Scenario: Rebound from Oversold Conditions
10% ProbabilityKey Levels and Technical Indicators Summary
The technical indicators provide a mixed but predominantly bearish outlook for ETHUSD as it trades around $2,085.62. On the 4-hour chart, the RSI is at 31.19, indicating oversold conditions, while the ADX at 62.89 signals an extremely strong downtrend. The MACD histogram is deeply negative, and the Stochastic Oscillator shows a bearish bias. The daily chart offers a slightly less severe, though still cautious, perspective with RSI at 47.89 and ADX at 22.31. The convergence of bearish signals on shorter timeframes, despite the neutral classification on the daily chart, suggests that the path of least resistance remains to the downside. Any rallies are likely to be met with selling pressure unless significant bullish catalysts emerge.
| Indicator | Value | Signal | Interpretation |
|---|---|---|---|
| RSI (14) - 4H | 31.19 | Oversold | Potential for bounce, but trend is strong |
| MACD Histogram - 4H | -X.XX | Negative | Persistent bearish momentum |
| Stochastic %K (4H) | 34.49 | Bearish | %K below %D, confirms downside bias |
| ADX (4H) | 62.89 | Strong Trend | Extreme trend strength favors sellers |
| RSI (14) - 1D | 47.89 | Neutral | No clear bias, but trending down |
| ADX (1D) | 22.31 | Moderate Trend | Trend exists, but less conviction than 4H |
Macroeconomic and Geopolitical Influences
While the technicals paint a clear picture of bearish pressure on ETHUSD, it's essential to consider the broader macroeconomic and geopolitical forces at play. The recent strength in the Dollar Index (DXY), climbing to 99.25, acts as a significant headwind. A stronger dollar typically correlates with lower demand for risk assets like cryptocurrencies, as it becomes more expensive for international investors. This inverse relationship is a key factor to monitor. Furthermore, the observed weakness in major equity indices like the S&P 500 (currently at 6536.67) and Nasdaq (at 23986.8), both experiencing significant daily drops, signals a broader risk-off sentiment in the financial markets. This aversion to risk often leads investors to move capital away from speculative assets and towards perceived safe havens.
The energy market's performance adds another layer to the macroeconomic puzzle. Brent crude oil's surge (112.54, up 4.58% on 1H) and WTI's rise (98.39, up 3.76% on 1H) could be interpreted as signs of inflationary pressures. Persistent inflation has direct implications for central bank policy, particularly the Federal Reserve. If inflation remains elevated, it could force the Fed to maintain a hawkish stance, keeping interest rates higher for longer. Such a scenario would generally be bearish for growth assets like ETHUSD, as higher borrowing costs reduce the present value of future earnings and make safer, yield-bearing assets more attractive. Traders are closely watching Fed commentary and upcoming economic data, such as CPI and PCE reports, for any hints about the future path of monetary policy.
Geopolitical tensions, while not directly impacting ETHUSD in the same way they affect energy markets, contribute to the overall market sentiment. Events like the reported attack on Qatar's Ras Laffan energy hub, as highlighted in recent news, contribute to global uncertainty. Such events can exacerbate risk aversion, leading to capital flight from speculative assets. While the direct correlation might be less pronounced than with traditional markets, a sustained period of geopolitical instability generally favors safer assets and can dampen enthusiasm for riskier investments like cryptocurrencies. The market's reaction to these broader themes underscores the interconnectedness of global finance and the need for a holistic view when analyzing any asset class.
The correlation between ETHUSD and the stock market, particularly tech-heavy indices like the Nasdaq, remains a critical factor. The Nasdaq's sharp decline on the 1-hour chart to 23986.8 indicates that ETHUSD may face continued headwinds if the broader tech sector continues to underperform. Historically, periods of significant equity market sell-offs have often coincided with pullbacks in the crypto market, as investors liquidate positions across asset classes to manage risk. Therefore, monitoring the Nasdaq's trajectory and the general risk appetite in the stock market is essential for anticipating potential ETHUSD price movements. The current data suggests a strong negative correlation is in play.
The macroeconomic environment presents a challenging backdrop for ETHUSD. A strengthening dollar, declining equity markets, and potential inflationary pressures influencing central bank policy all point towards a cautious or bearish outlook for risk assets. While specific economic calendar events for the upcoming week were not detailed in the provided data, any news that reinforces a hawkish Fed stance or signals economic slowdown could further pressure ETHUSD. Conversely, signs of easing inflation or a dovish shift from the Fed could provide some relief, but the current technical picture suggests that substantial bullish momentum is unlikely without a clear change in these macro conditions.
What happens if ETHUSD breaks below the $2,040.00 support level?
A break below $2,040.00 on ETHUSD would likely trigger further selling pressure, driven by stop-loss orders and a confirmation of the bearish trend on the 4-hour chart. The immediate target would then shift to $1,991.32, with a potential extension towards the daily support at $1,935.57 if the momentum continues.
Should I consider buying ETHUSD at current levels around $2,085.62 given the oversold RSI?
Buying ETHUSD at $2,085.62 solely based on an oversold RSI (31.19 on 4H) is risky due to the strong bearish trend indicated by ADX 62.89 and negative MACD. A more prudent approach would be to wait for confirmation, such as a decisive break above $2,144.43 resistance or clear bullish divergence across multiple timeframes.
Is the ADX reading of 62.89 on the 4-hour chart a strong sell signal for ETHUSD?
An ADX value of 62.89 on the 4-hour chart signifies an extremely strong trend, which in this case is bearish. While not a direct 'sell' signal itself, it strongly indicates that the prevailing downtrend has significant momentum and that any counter-trend rallies are likely to face strong resistance and be short-lived.
How might the strong DXY at 99.25 affect ETHUSD's price action this week?
The current DXY level of 99.25 suggests a strengthening US dollar, which typically exerts downward pressure on risk assets like ETHUSD. This inverse correlation means that as the dollar gains strength, demand for ETHUSD may decrease, potentially leading to price declines unless other strong bullish factors emerge.
Track markets in real-time
AI-powered analysis, technical indicators and real-time price data.
Join Our Telegram Channel
Breaking market news, AI analysis and trading signals instantly.
Join Channel